13.06.21 Technical analysis of ETH / USD and LTC / USD – breakthrough in sight, but everything depends on BTC
4 min readTable of Contents

After yesterday’s analysis of indexes, we will stay with alto and select two specific ones for analysis – Litecoin (LTC) and ETH (ETH). I consider both altos to be flagships, which basically set the direction for the others, so it’s good to know how they’re doing. Today’s analysis will therefore be mainly about assessing the situation and possible options when the courses go to one side or the other.
Current situation at 1D TF ETH / USD
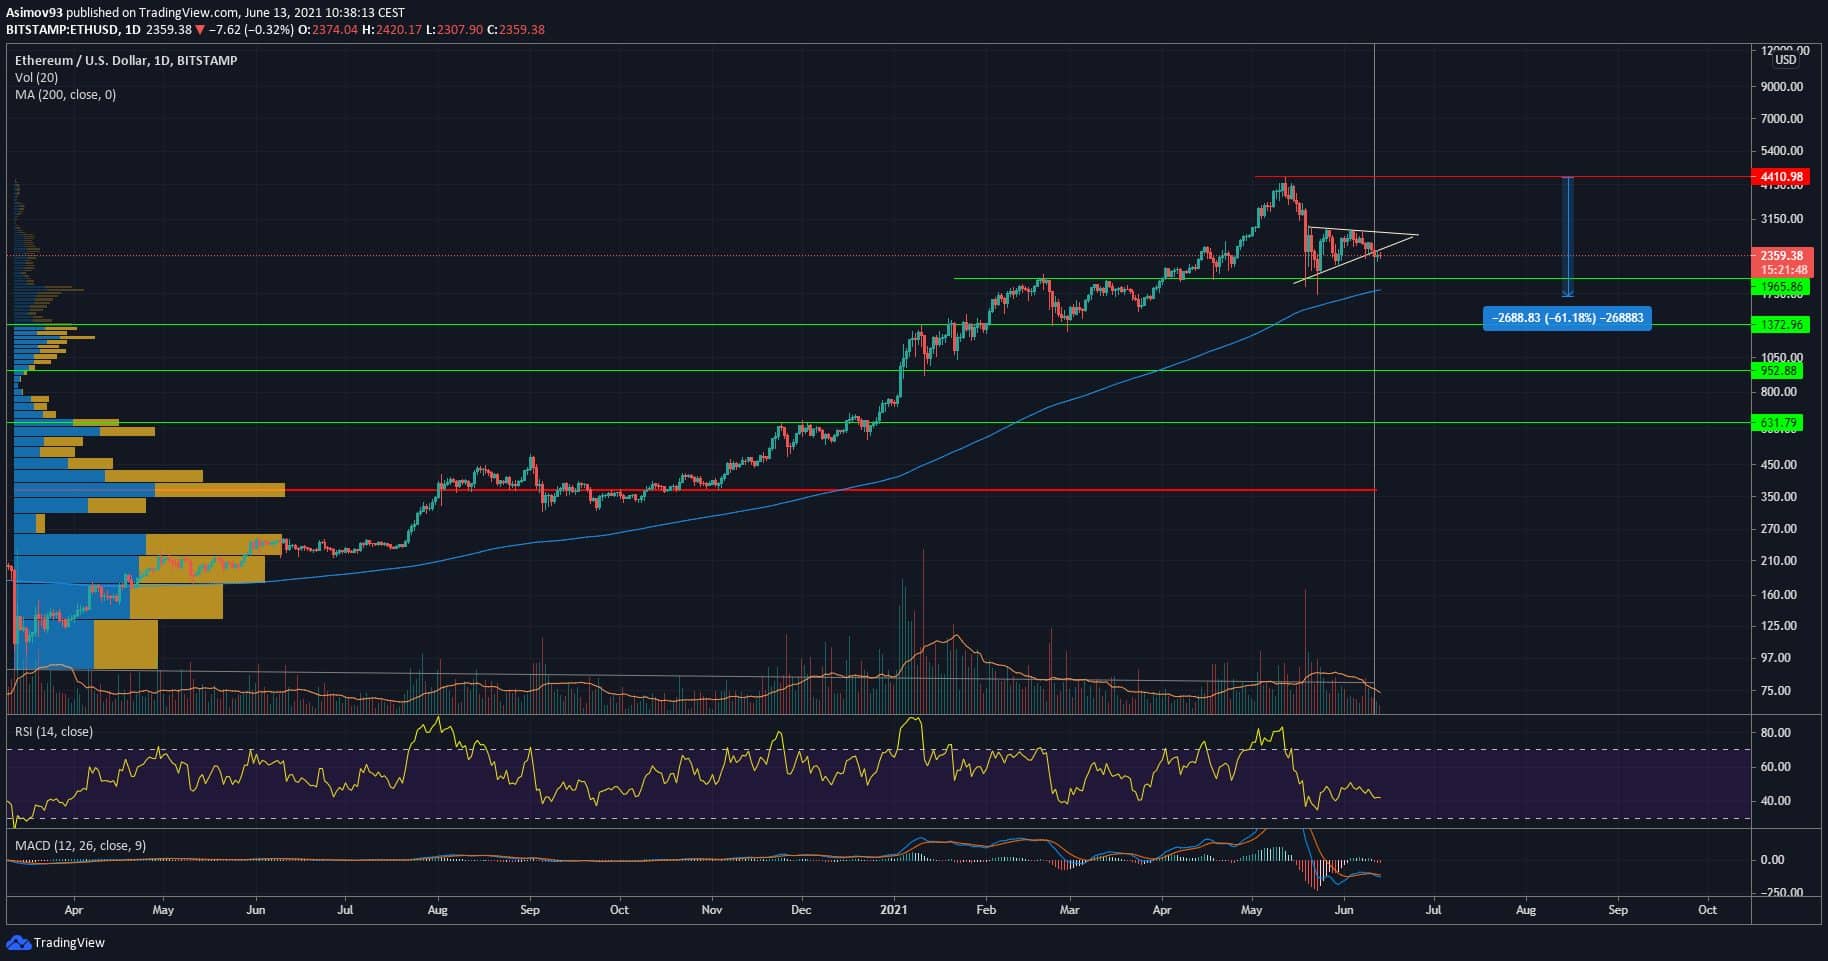
Let’s start with the ETH coin, the graph is on a logarithmic scale with a daily time frame. As for the drop itself, ETH depreciated by about 61%, which is enough, but significantly less than other top altcoins. The local bottom is basically at the S / R level of USD 1,965, but in fact the price went much lower. But the daily close ended above said level.
The sellers attacked the level twice in total, but even the breakthrough failed. Then the retracement up always started, but it lasted only a few days, which eventually resulted in a side consolidation pattern – triangle. Along with that dynamics and volumes out of the market. As long as the course is within the observed pattern, this is a normal phenomenon.
But we can see that there has already been a breakthrough from the unit. But the dynamics and volumes are still nowhere. Which just tells us he’s waiting for BTC. Without him, we probably won’t see movement. In any case, if ETH gets lost and wants to up, the first big hurdle is the ATH level of $ 4,410. At the same time, this limit is the only obstacle, because we no longer have any resistance to it.
If the breakout succeeds, ETH will regain a free span. When the market is heading south, the first pillar is again the S / R level of 1,965 USD. Then we have levels of $ 1,372 and $ 952. However,concrete“Starts according to the Volume profile up to close to the S / R level of 631 USD. I repeat, that does not mean that we will fall here. But if that happens, we should be prepared.
Indicators
The daily RSI reached a maximum of about 51 points during retracement, which is quite a few. The indicator now has about 42 points. Most importantly, however, the shape of the indicator curve has a distinct concave shape – an inverted U. In short, the RSI curve rotates down, but slowly. MACD reached the bearish cross, so the positive momentum didn’t last long.
Dogecoin mining with Unmineable Step by Step – 2021 guide
Current situation at 1D TF LTC / USD
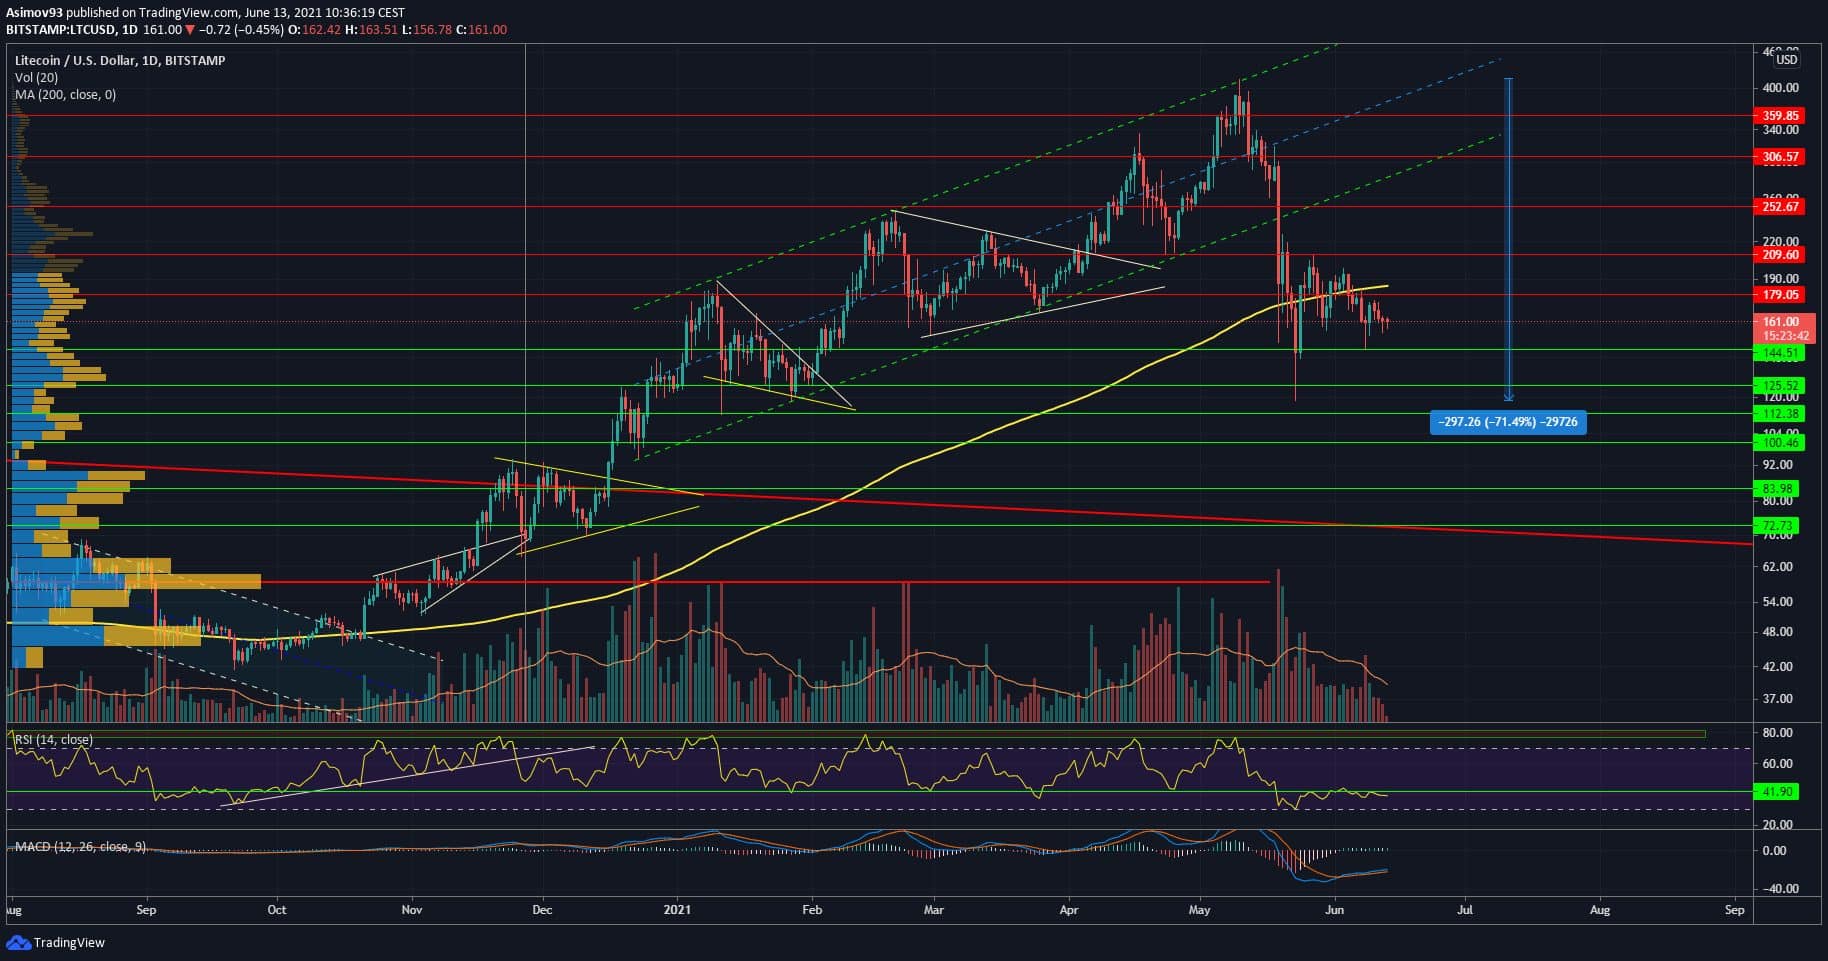
We will also analyze Litecoin on a logarithmic graph with a daily time frame. In general, the development is very similar to that of ETH. Thus, the drop itself was about 10 pp deeper, namely about 71%. The slump stopped at the S / R level of $ 125.52, the retracement up lasted to the S / R level of $ 209.6. From then on, we slowly descend.
Volumes are constantly decreasing, the dynamics are also gone. The latest response with close support dates back to June 8. After a nice rebound, he wanted to continue up the course, but the momentum quickly faded. It is therefore such a futile slap. The exchange rate is simply in the range of 179 – 144.51 USD and so far it does not really look like a breakthrough.
If we see a decisive move up, there are enough of those resistances on the way up – static borders such as $ 209.6, $ 252.67, $ 306.57, $ 359.85 and dynamic level MA 200. The way up is therefore thorny. In the case of moving down, it is still true that the first significant area is 100.46 – 83.98 USD. According to the profile, more decent liquidity starts here.
Indicators
The highest RSI values are at 44 points, which is quite a bit. Currently, the indicator shows about 39 points and even here we can observe the effort to rotate the curve. However, the MACD is without a bearish cross, the momentum still prevails.
In conclusion
ETH and Litecoin are pretty frozen markets. It can be assumed that more movement will come sooner, but everything logically depends on BTC. We probably won’t move without him. However, if the side consolidation takes too long, there is a good chance that the alto will start to rise. Under normal circumstances, this would have already happened thanks to the side movement on BTC, but the markets simply have after the May beating fear.
ATTENTION: No data in the article is an investment board. Before you invest, do your own research and analysis, you always trade only at your own risk. Cryptheory team strongly recommends individual risk considerations!


