16.06.21 Technical analysis of BTC / USD – Current situation at 4H TF
3 min readTable of Contents
Dynamics is returning to the market and Bitcoin (BTC) has had an interesting development since yesterday.
BTC long / short positions
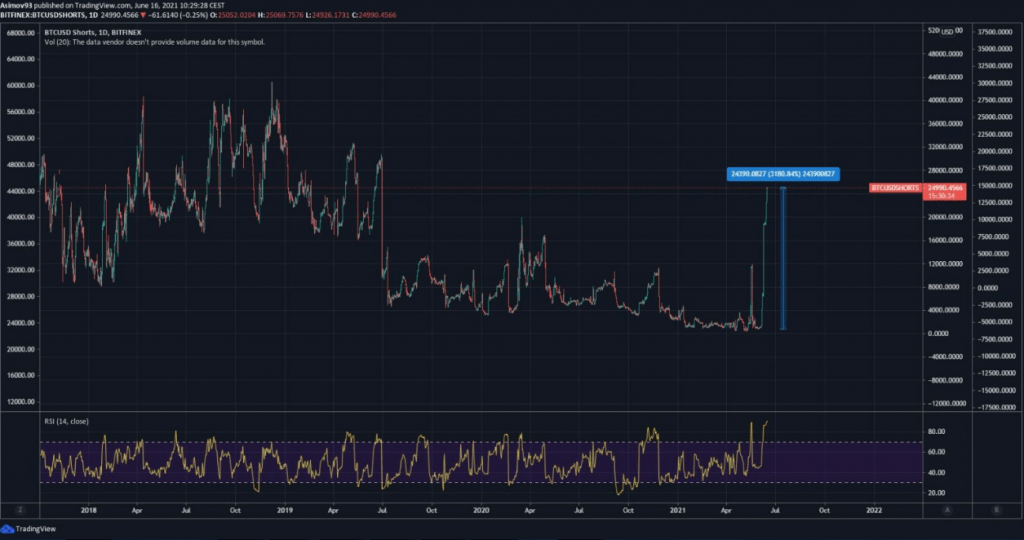
In short, we will analyze the short positions on Bitfinex, which are still rising. The number of Bitcoins in short positions has increased by more than 5,000 units in the last two days. At these moments, I would dare to say that retail is already jumping into short positions. Everyone must have noticed some large capital yes saturates BTC into short positions, so a substantial part of the retail wants to ride as well.
As for long positions, they are still at all time high, but they are not growing too much. Which implies that a substantial part of the market is already in the long run, so there is no one else to buy. I consider the stagnant long positions and, on the contrary, the huge increase in short positions to be a significant problem. Bitfinex is not such a small exchange that we ignore the data.
Current situation at 4H TF BTC / USD
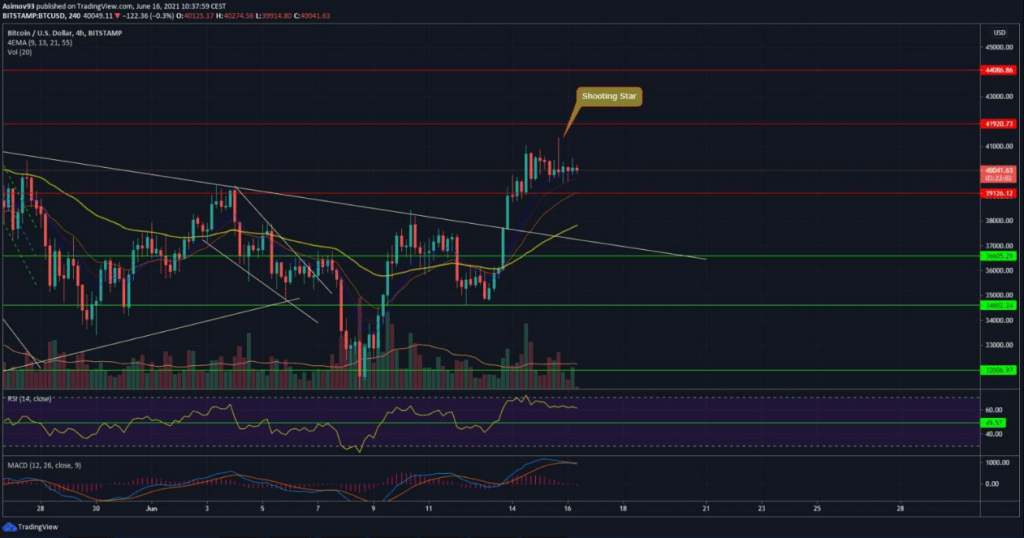
As for the intraday chart, specifically 4H, BTC was clearly preparing for a breakdown of resistance at $ 42,000. The momentum was good before, so from an intraday point of view, the situation looked really promising. After about 24 hours of consolidation came an attempt at a breakthrough, which, however, after about 30 minutes completely failed.
Enough aggressive longboats had to be trapped. Honestly, it was naive enough to think that BTC would make a breakthrough on the first try. In yesterday’s analysis, I emphasized that around the 42,000 USD is significant confluence which cannot be ignored. So if a breakout should work, definitely not on the first try.
Rejection takes the form of a bearish candle, called Shooting Star. Which is a clear negative signal for further pricing. On the positive side, however, the volumes were not large and the decline did not continue after the price fell slightly. Which gives the bulls a chance, they can definitely try again. The question, however, is whether they risk it if the first shot did not come out.
Indicators
After some six weeks, the 4H RSI tested a borderline of 70 points that did not let the market go, as last time. It’s been quite a while since BTC has managed to stay above 70 points – the last time in mid-April. At MACD we have a fresh bearish cross.
In conclusion
It is definitely positive that we have finally tested the key resistance and we have the first negative reaction. The rejection was initially strong, but sellers did not continue their pressure after the price cut. Even the volumes are not anything, rather average. That’s why BTC still has a chance to break the resistance. However, it will not be easy, because the fact that the obstacle is too durable does not change.
ATTENTION: No data in the article is an investment board. Before you invest, do your own research and analysis, you always trade only at your own risk. Cryptheory team strongly recommends individual risk considerations!


