21.11.21 Technical analysis of ETH – the strongest coin on the market?
2 min readETH is perhaps the strongest coin on the crypto market. ETH not only managed to overcome its historical maximum, but it still clings to it. ETH is such a rarity in this respect, because the other top altcoins have not been able to do this. The market is indeed resilient when BTC begins to decline.
Current situation at 1W ETH / USD
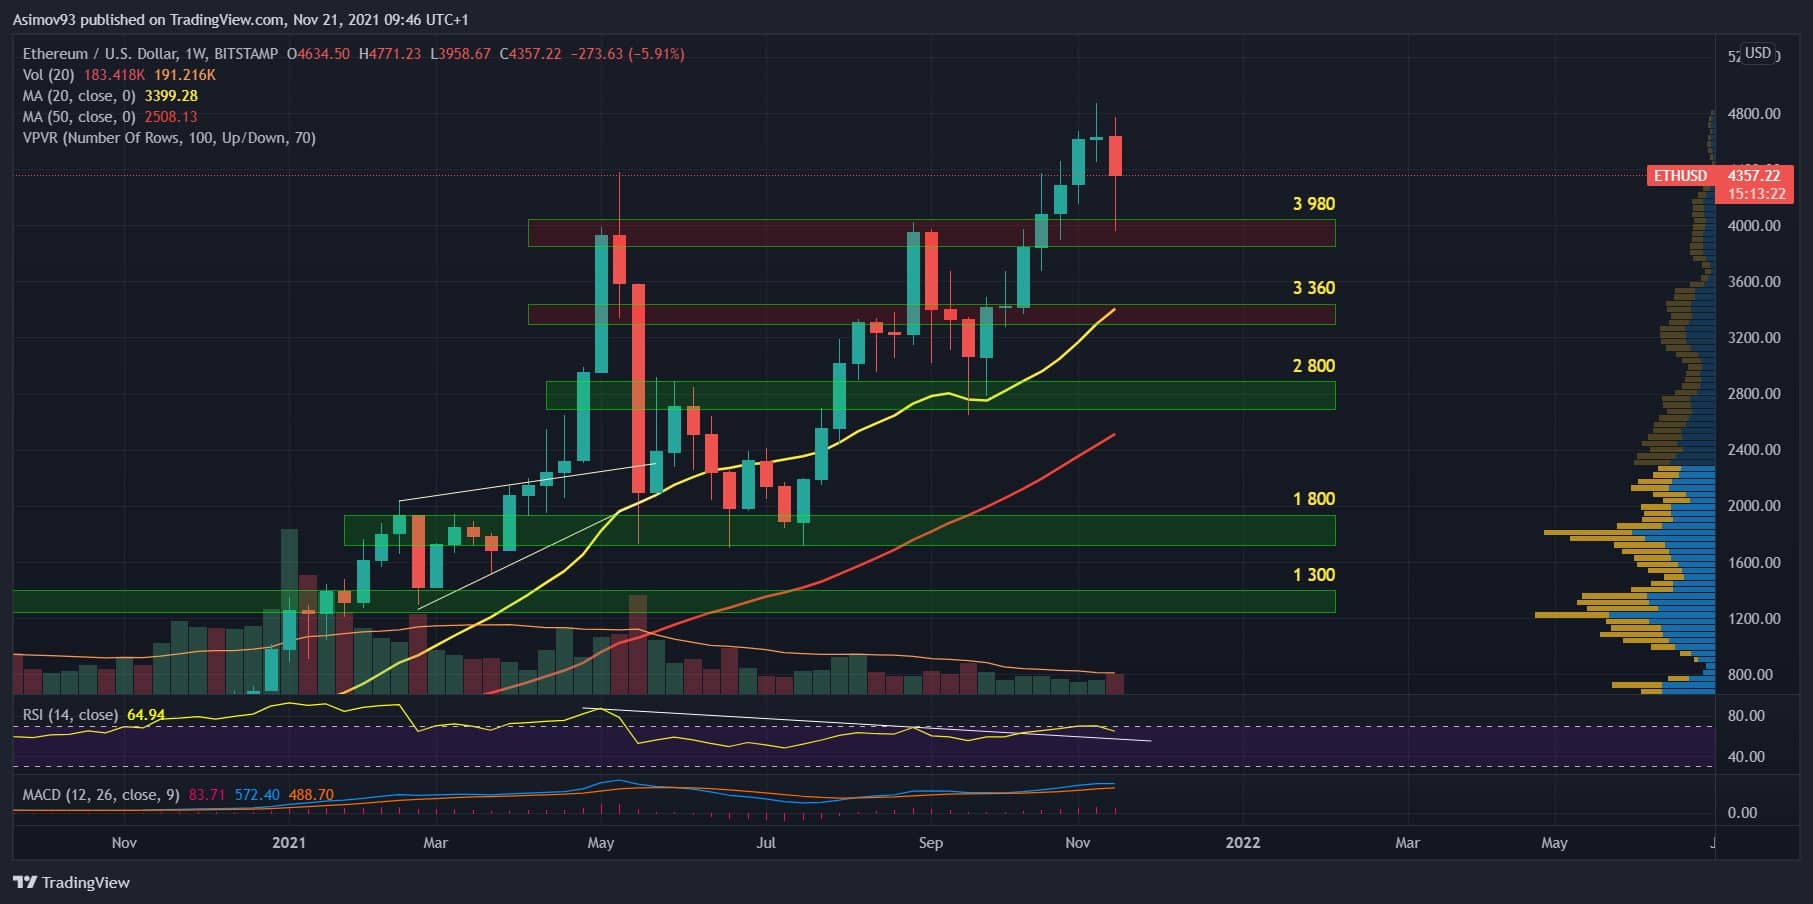
Since we haven’t focused on ETH for quite some time, we’ll do an analysis on the weekly chart. As the chart below shows, ETH has built up a very strong support of $ 1,800. There were about three tests during the summer. Once we return to this level in the future, I expect a strong defense.
In any case, ETH has appreciated by 180% from the stated level. And the price action was very good during that time. A problem occurred at the S/R level of $ 3,980, but the market was able to effectively use the level of $ 2,800. There was also a smaller support confluence in the form price levels a moving average MA 20.
The level was used masterfully. Over the next few weeks, the price broke the S/R level of $ 3,980 and continued to rise modestly over the next few weeks. Thanks to the last drop on BTC, ETH tested this level again. But this time from above. As you can see, so far the reaction on the surface is positive.
Despite the fact that the level has remained defended, for the time being, the weekly candles are rather neutral. Unfortunately, the tallest weekly candle has the form of a Doji. And once it closes this week, we have a weekly chart break within the growth structure. The break is not extreme, but it can lead to a much stronger decline.
So if we go down again, watch the reaction of the exchange rate to 3 980 USD. If the level does not last, the next stop for ETH S/R is the level of 3,360 USD, where the support is due to the close 20-week moving average confluence. Therefore, there should be a denser defense at that level.
Indicators
The weekly RSI peaks at 70 points. There was also a market rebound. Threshold levels such as 70 and 30 points always simply play the role of S / R levels. But the initial reflection may not mean anything. We’ll see what happens next. However, bearish divergence is already appearing on the MACD curves. No bearish cross, but not valid. According to the MACD histogram, the momentum is no longer so strong.


