ALGO’s Bounce Could Be the Beginning of an Upward Trend
2 min readThe Algorand (ALGO) price has given several bullish reversal signs after bouncing at a significant support level. The price may have begun a new bullish impulse.
Bounce From Support
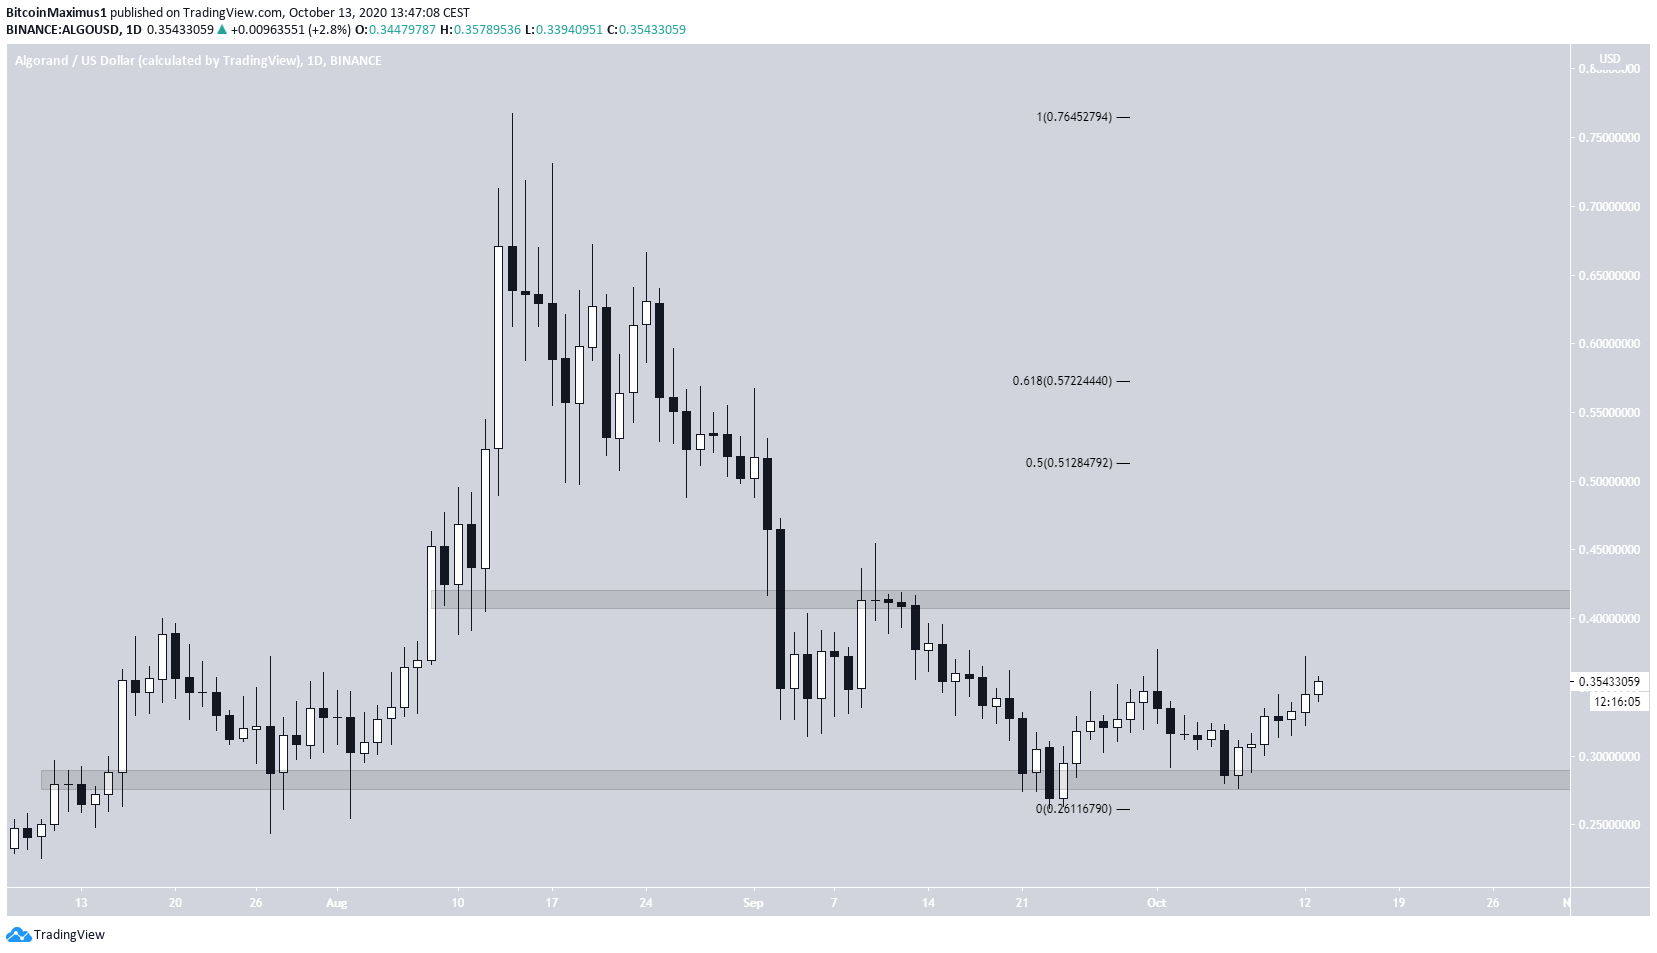
ALGO reached a high of $0.76 on Aug. 14 and has been declining since. The fall continued until Sept 23, when the price reached a low of $0.261. The price has been rising since.
The previous low caused a deviation below the $2.70 support area, but the price reclaimed it shortly afterward, confirming it as support.
The closest resistance area is found at $0.42, most recently having rejected the price on Sept 10. If the price manages to break out above, the next resistance area would be between $0.51 – $0.57, the 0.5 – 0.618 Fib levels of the entire downward move.
Technical indicators on the daily time-frame are bullish:
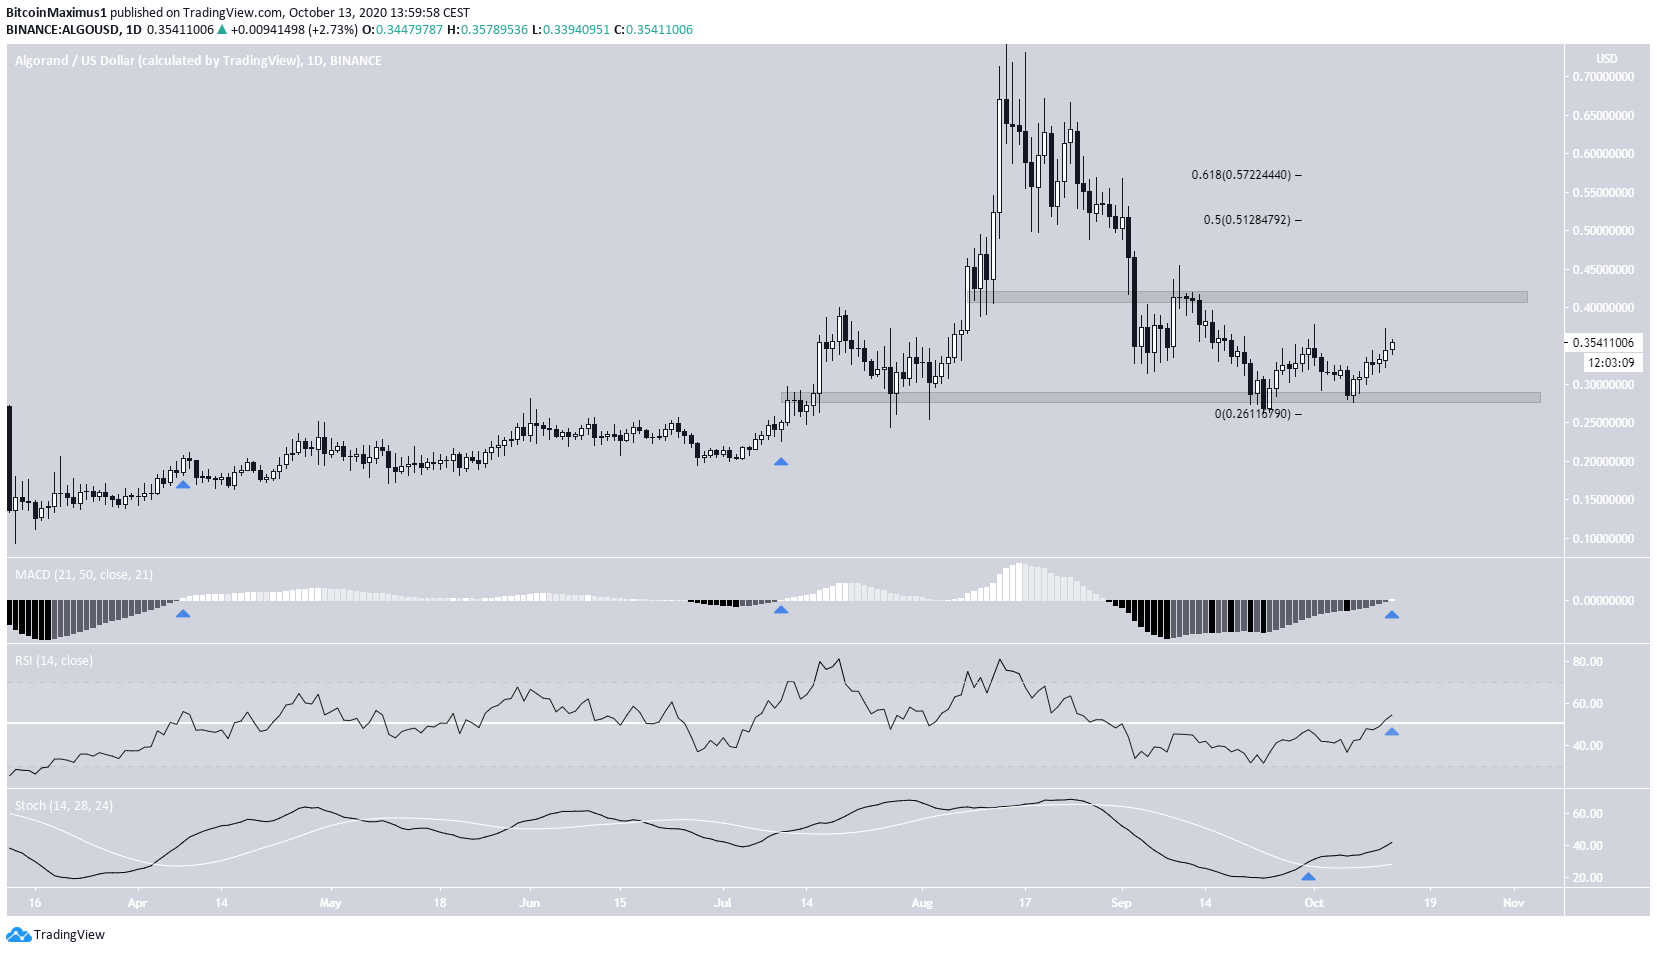
- The MACD has just crossed into positive territory. The previous two times this occurred (shown with blue arrows), significant price increases followed.
- The RSI has just crossed above 50.
- The Stochastic Oscillator has just made a bullish cross and is moving upwards.
Therefore, the price should reach the $0.42 area and possibly break out.
Wave Count
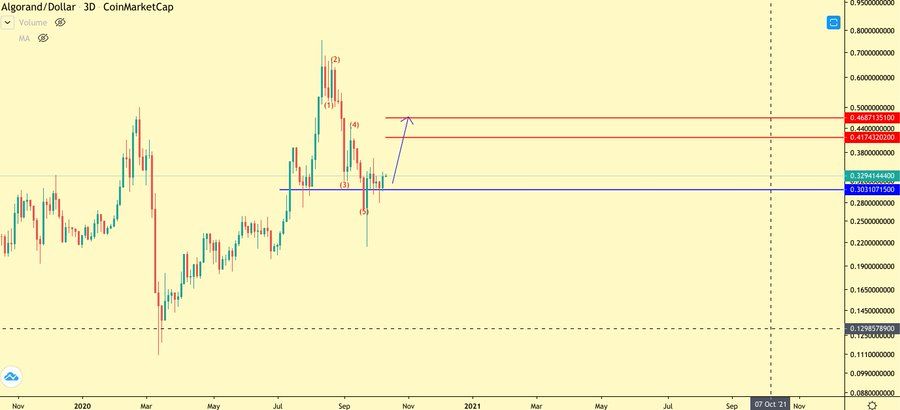
Cryptocurrency trader @TheEWguy outlined an ALGO chart, in which the price increases all the way to $0.46.
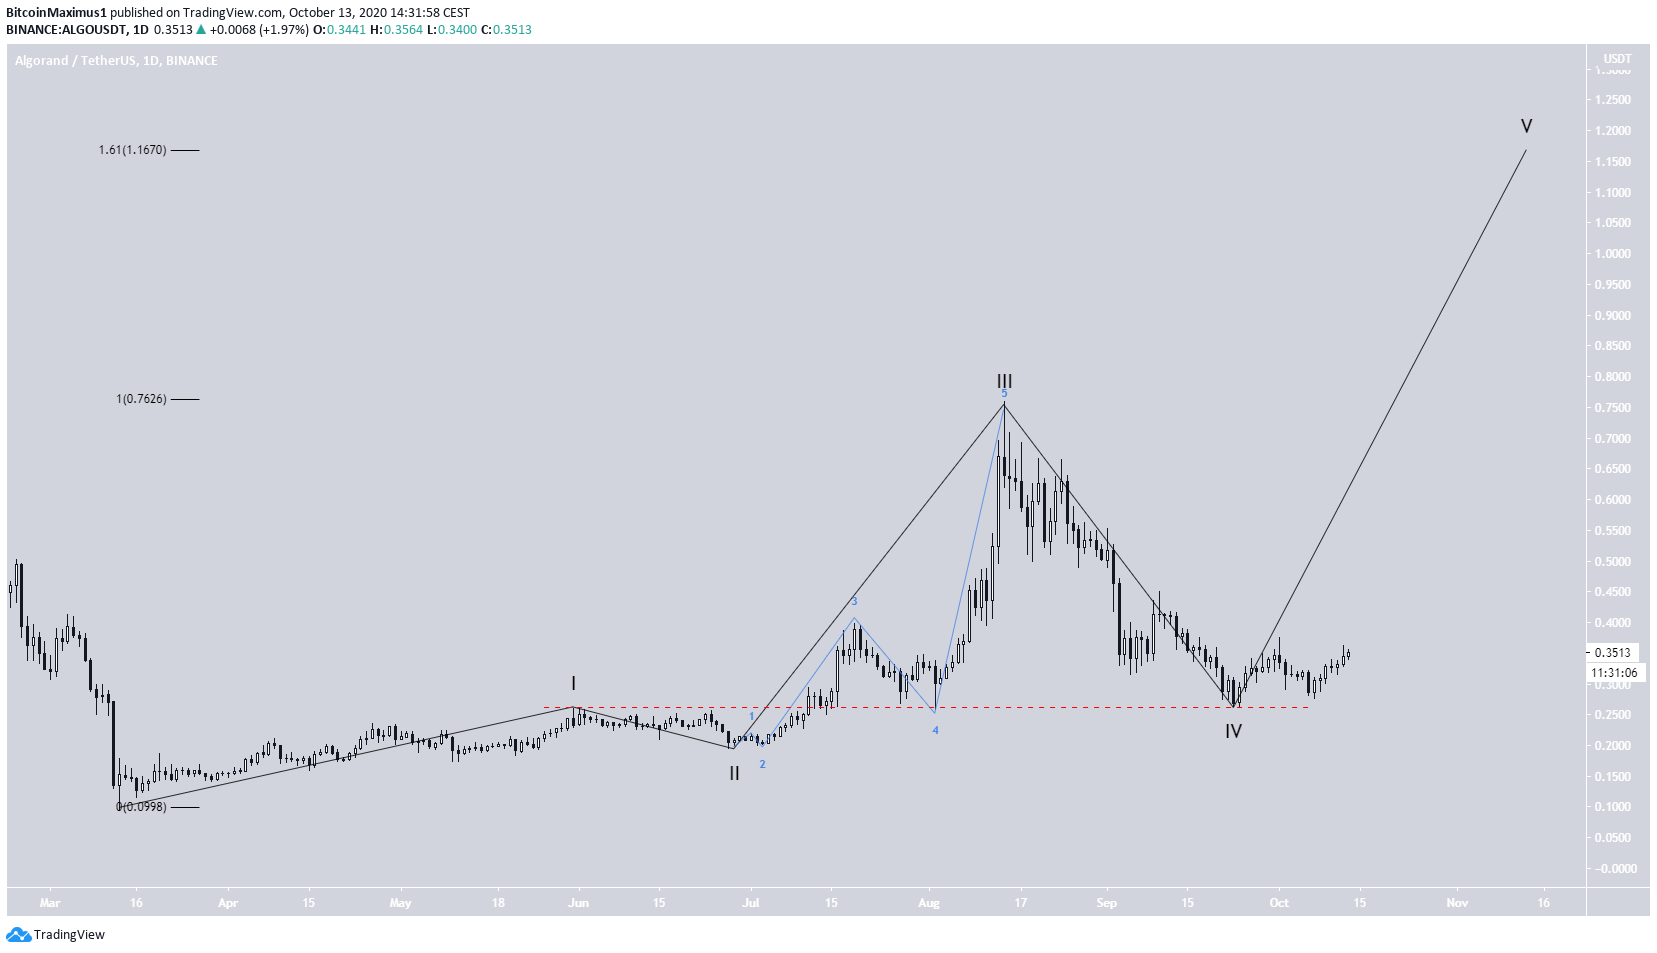
The most likely wave count seems to be that the price has completed waves 1 – 4 of a five-wave bullish impulse (shown in black below).
The fact that the bottom of wave 4 barely missed the top of wave 1 makes the formation even more likely. If correct, the first target for the top of wave 5 would be at $1.16, the 1.61 Fib level of waves 1 – 3.
In BeInCrypto’s Sept 12 analysis, it was stated that:
“Based on the length of the A wave, a possible low could be reached at $0.256, in which case the C and A waves would have a ratio of 1.61:1.”
On Sept 23, the price reached a low of $0.261, validating the prediction and the ratio between waves A:C.
If correct, the price has begun a new bullish impulse (shown in red below) and is currently in wave 3, which could end between $0.51 and $0.55.
A fall below the wave 2 low at $0.2767 would invalidate this particular wave count.
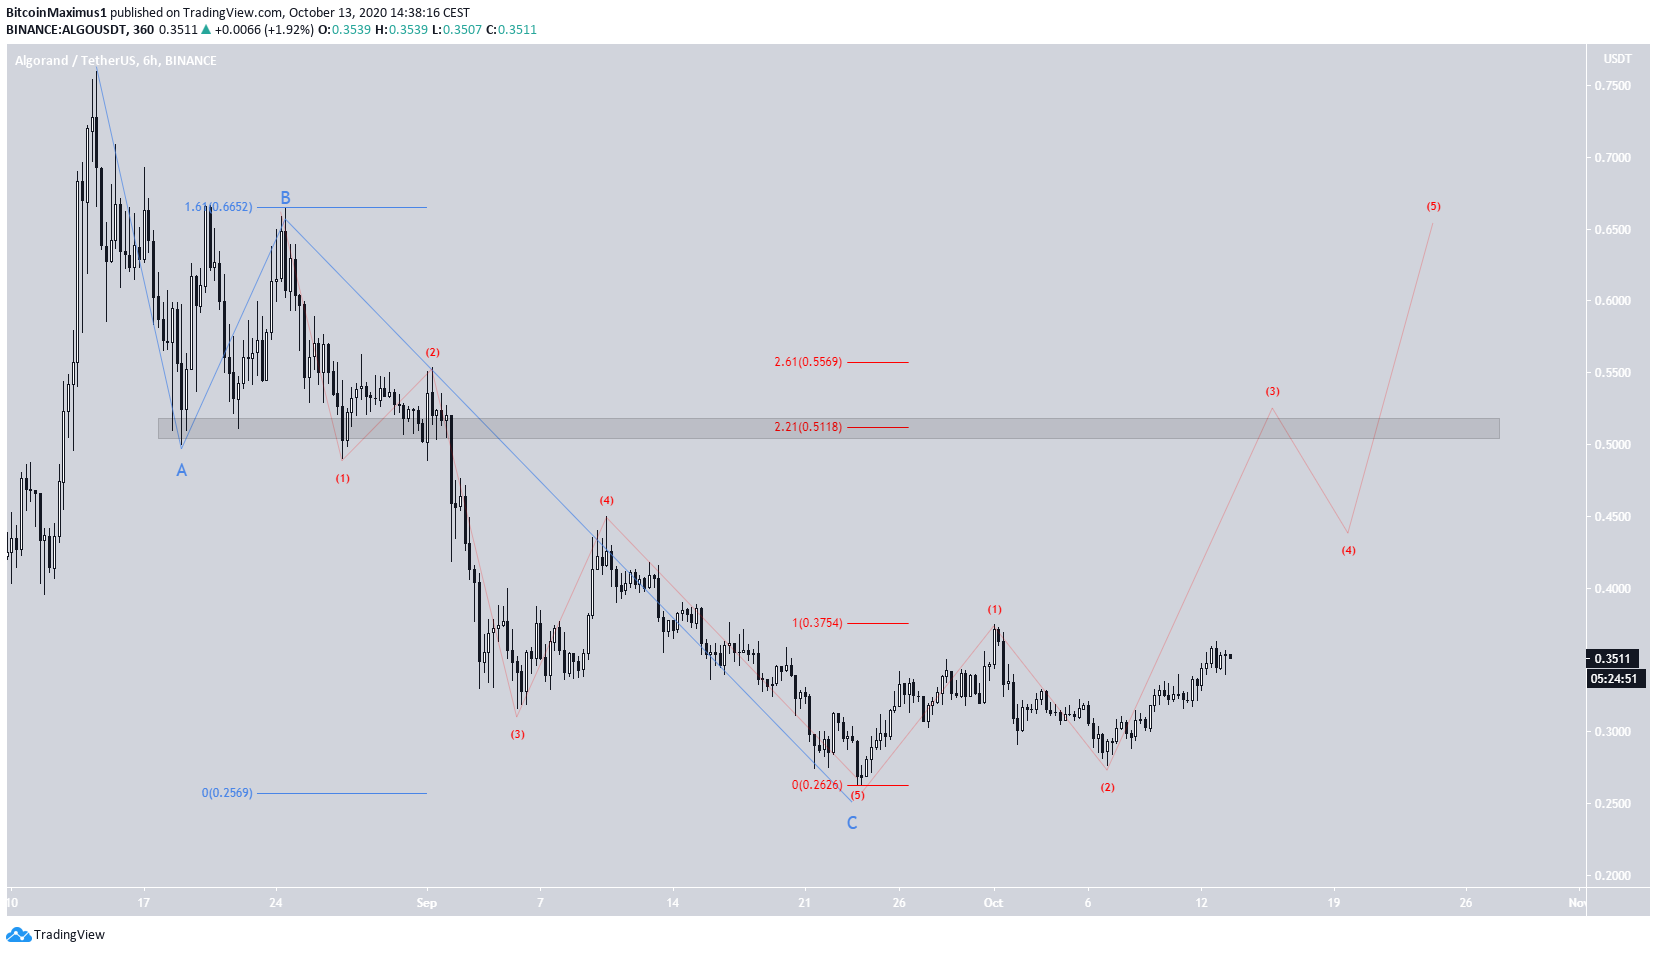
To conclude, the ALGO price should continue rallying towards the resistance areas outlined above and possibly target $1.16.
For BeInCrypto’s Bitcoin analysis, click here!
Disclaimer: Cryptocurrency trading carries a high level of risk and may not be suitable for all investors. The views expressed in this article do not reflect those of BeInCrypto.
The post ALGO’s Bounce Could Be the Beginning of an Upward Trend appeared first on BeInCrypto.


![Decentraland: Review & Beginner's Guide [current_date format=Y] 32 Decentraland: Review & Beginner's Guide](https://cryptheory.org/wp-content/uploads/2020/11/decentraland-02-gID_7-300x150.jpg)