Analyst points out where the price of BTC, ETH and XRP is going this week
2 min read
The price of BTC had a momentary rise after its initial drop on November 18th. However, this rapid rally failed to gain traction and prompted market analysts to revise their short-term positions for the BTC.
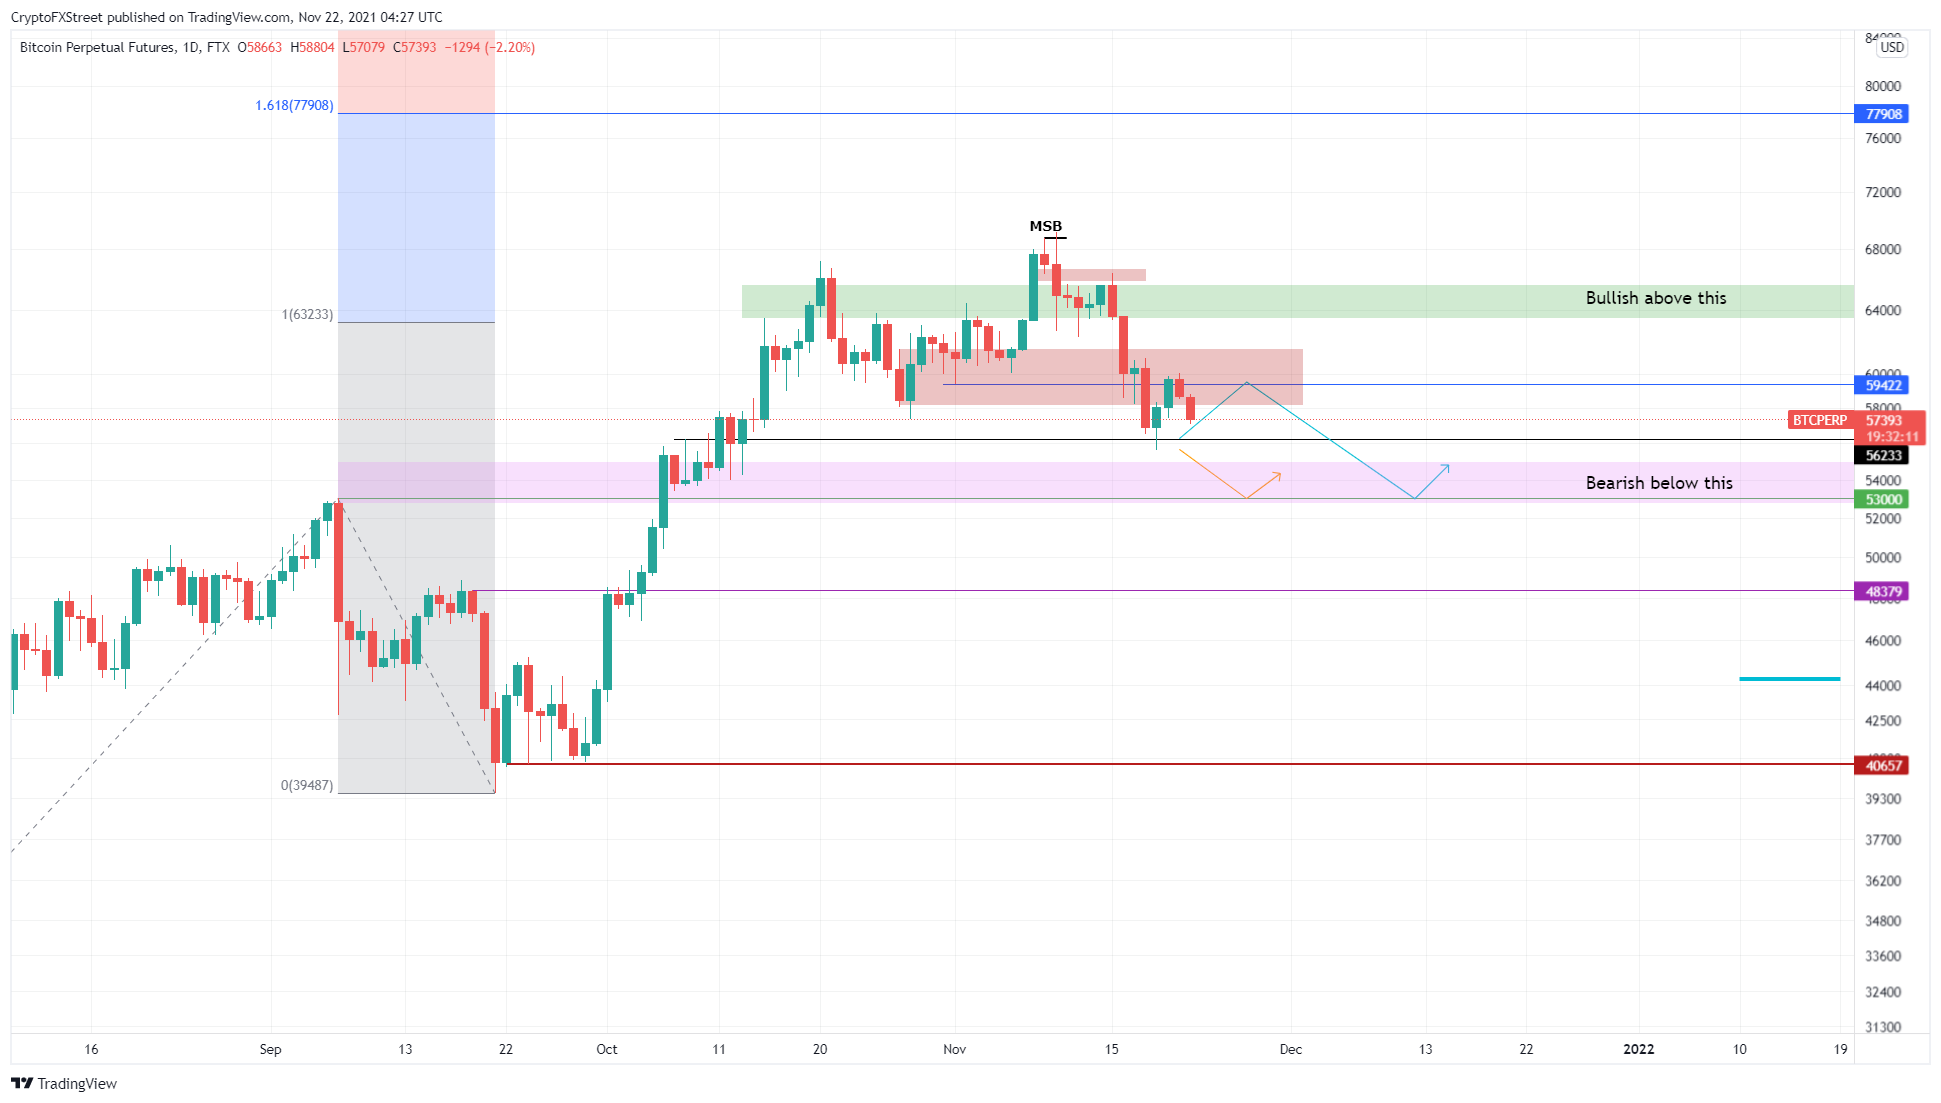
According to Akash Girimath, from FXStreet, BTC rose 7.4% in 2 days. However, it failed to restate the $60,000 psychological support level.
As a result, he says, the BTC is undergoing a reversal to the $56.233 support floor.
“Breaking this barrier will result in a shift to the demand area from $52,746 to $54,972,” he said.
As the analyst pointed out, this downward movement is crucial to collecting liquidity below $53,000. For him, this is something that will likely happen this week.
“If big buyers intervene, the slowdown will cease and a reversal can be expected. In the worst-case scenario, however, a breach of the $53,000 barrier could lead to an 8.7% drop to $48,379,” he says.
ETH
Second, talked about ETH. More precisely, the analyst highlights that the setback in BTC had a ripple effect, causing a strong correction in ETH.
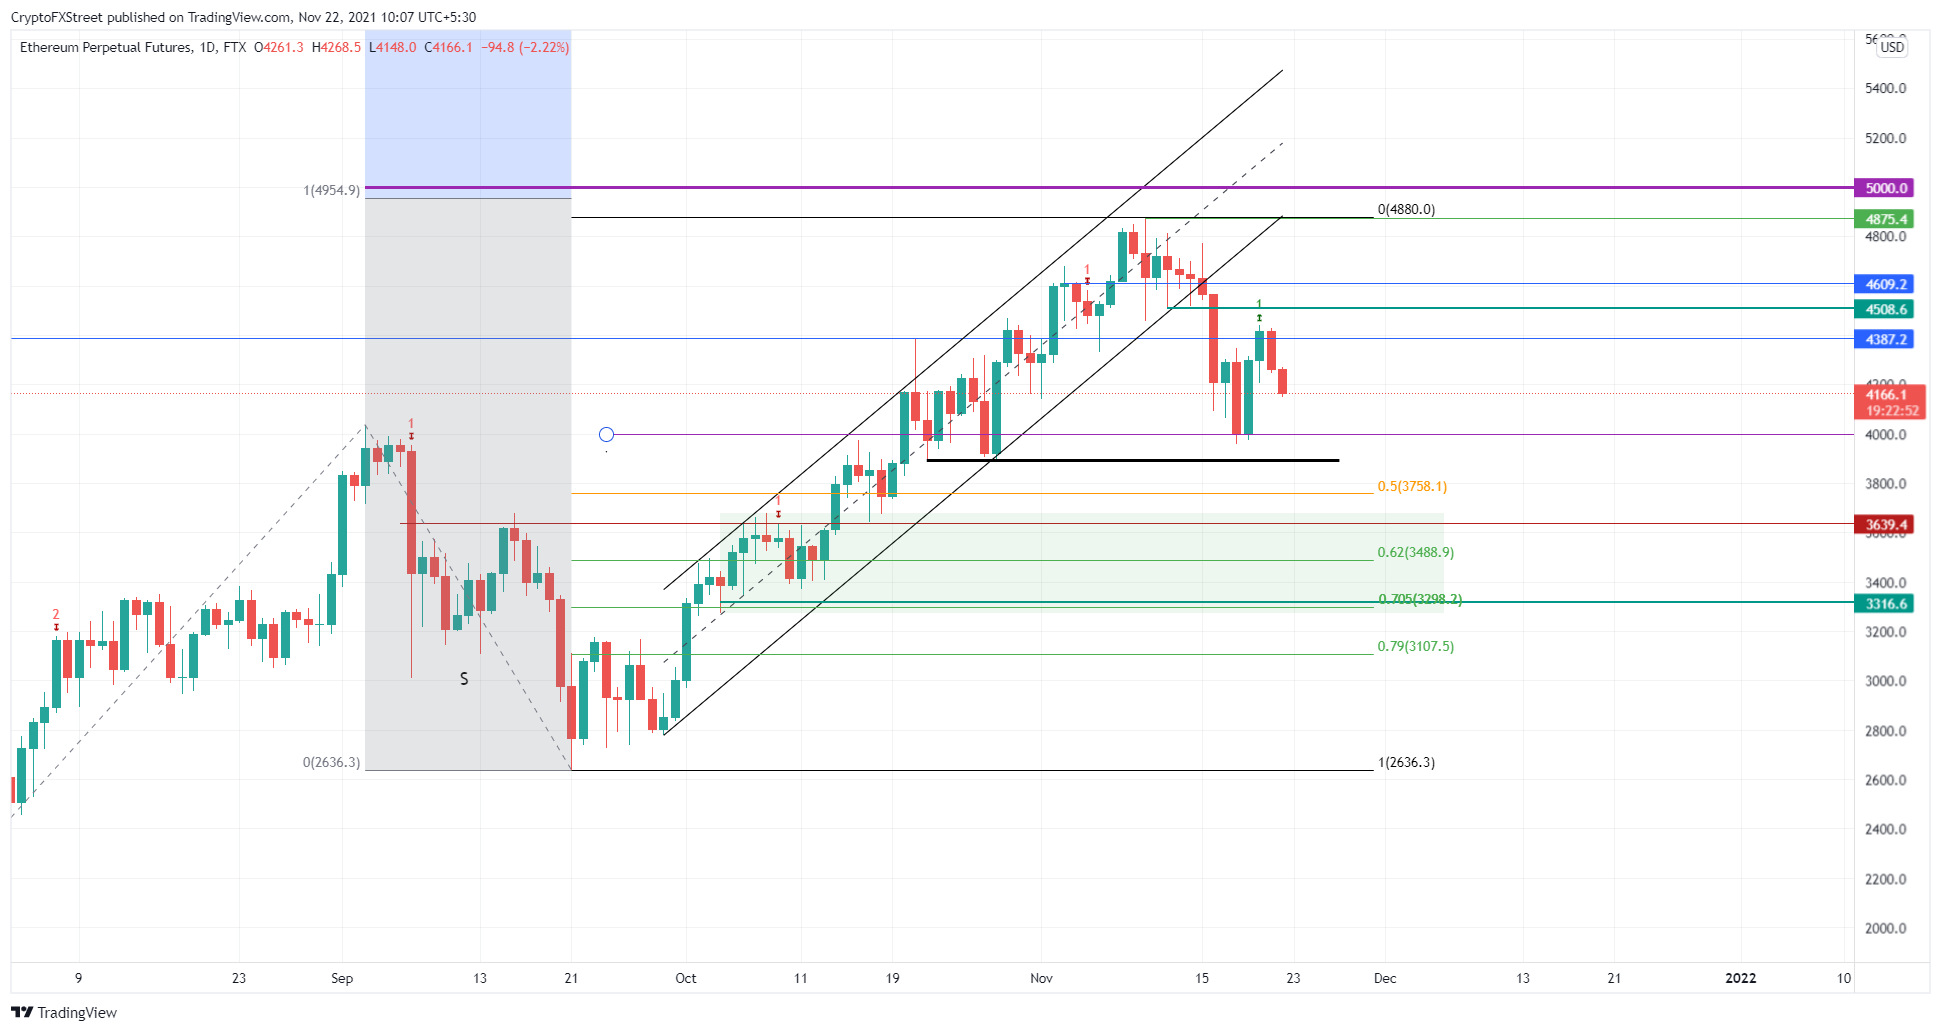
Girimath explained that as the price of ETH is trading around $4,179, investors can expect Ether to retest the psychological level of $4,000.
“This break will take the smart contract token to the retraction level of Fibonacci of 50% at US$3,756. However, if BTC drops to $53,000 or even $50,000, ETH could easily be reduced to $3,500 or $3,200,” he said.
Furthermore, Girimath highlighted that the price correlation of ETH with BTC is something that investors need to be aware of.
“A drop in BTC can invalidate a perfectly optimistic setting at ETH. If the BTC manages to produce a daily close above $63,000, however, the price of ETH has a chance to rise,” he said.
XRP
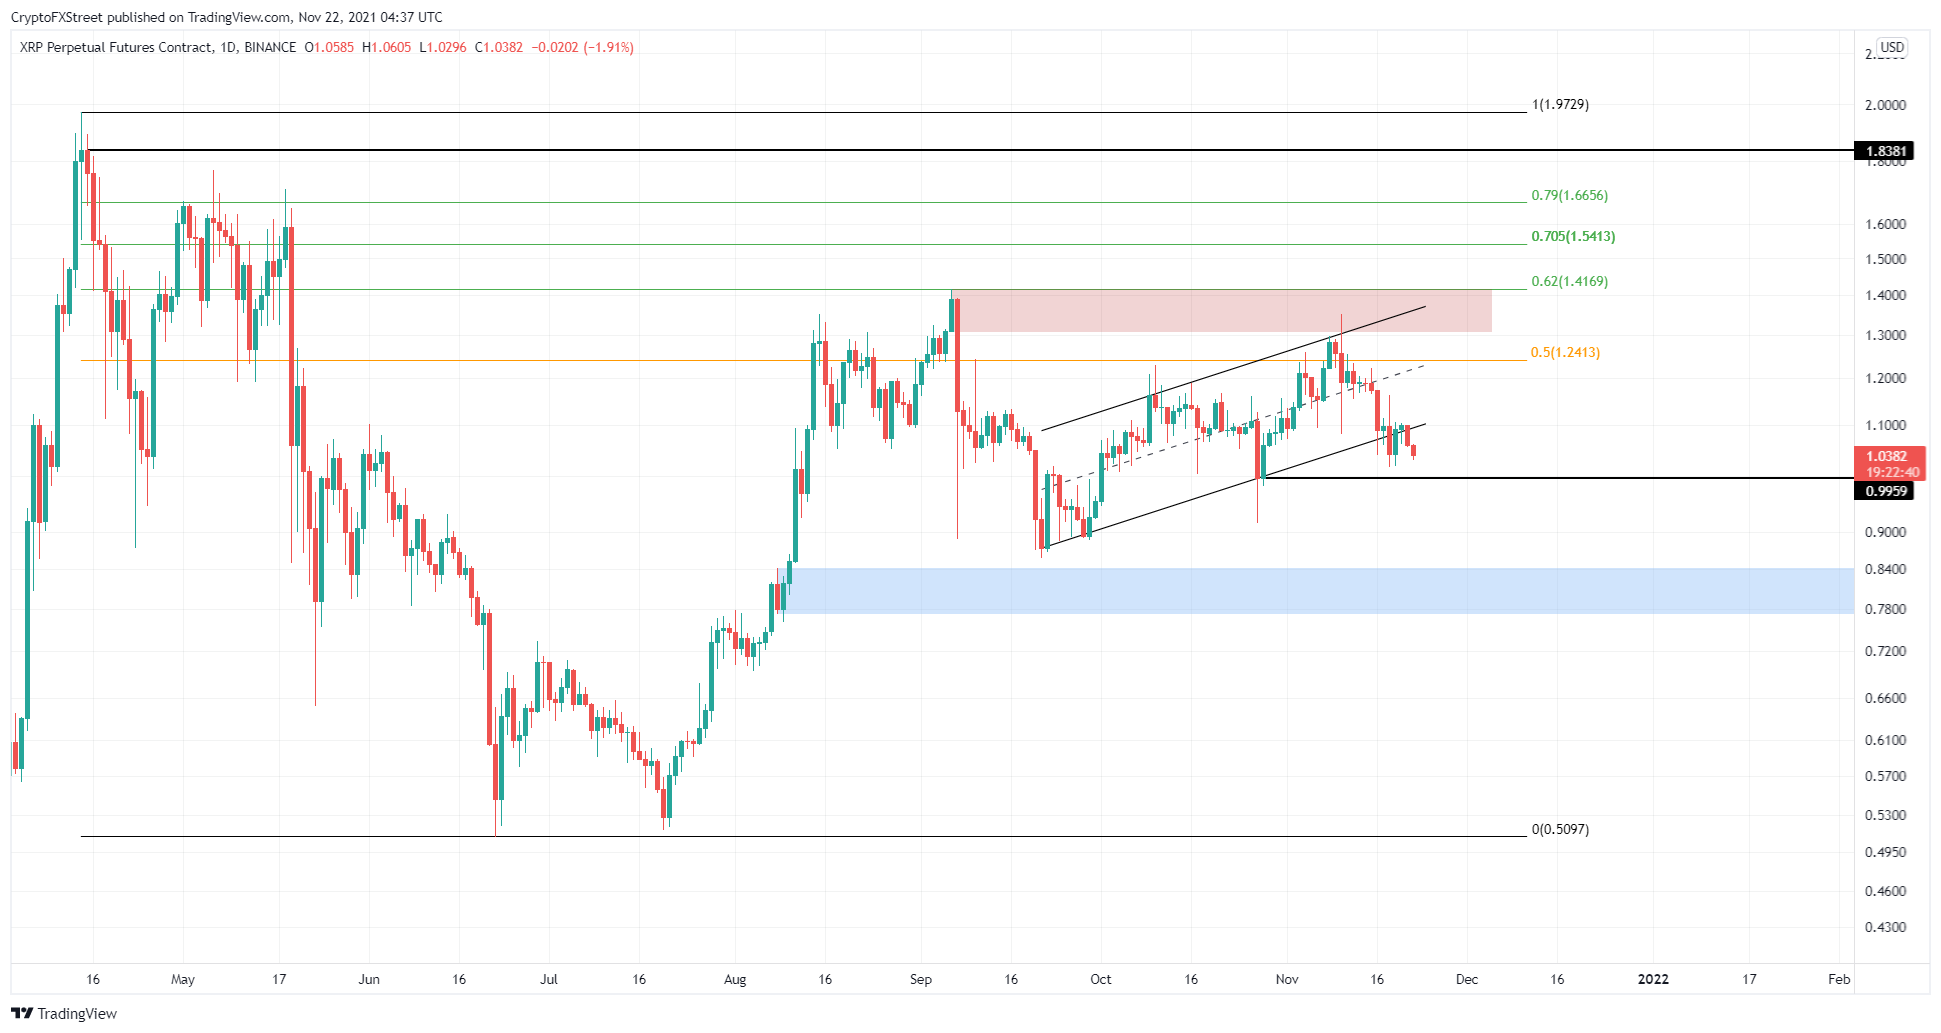
Finally, in the case of XRP, he noted that crypto asset has set three highest highs and four highest lows since September 18th.
“Connecting these swing points using trendlines reveals an upward parallel channel. This setup predicts a bearish outlook after the break of the downtrend line at $1.09.”
According to the analyst, on November 18th the XRP price violated the basis of the technical formation, indicating a break. Since then, the small increase has confirmed the decline, again testing the breaking point.
“Going forward, the XRP price will move towards the psychological level of $1. A daily close below this hurdle will trigger a 15% reduction into the demand zone, ranging from $0.77 to $0 .84”, he finished.
Analyst describes two foolproof rules for making money with BTC


