AXS Reaches New All-Time High – Will Other NFT Tokens Follow?
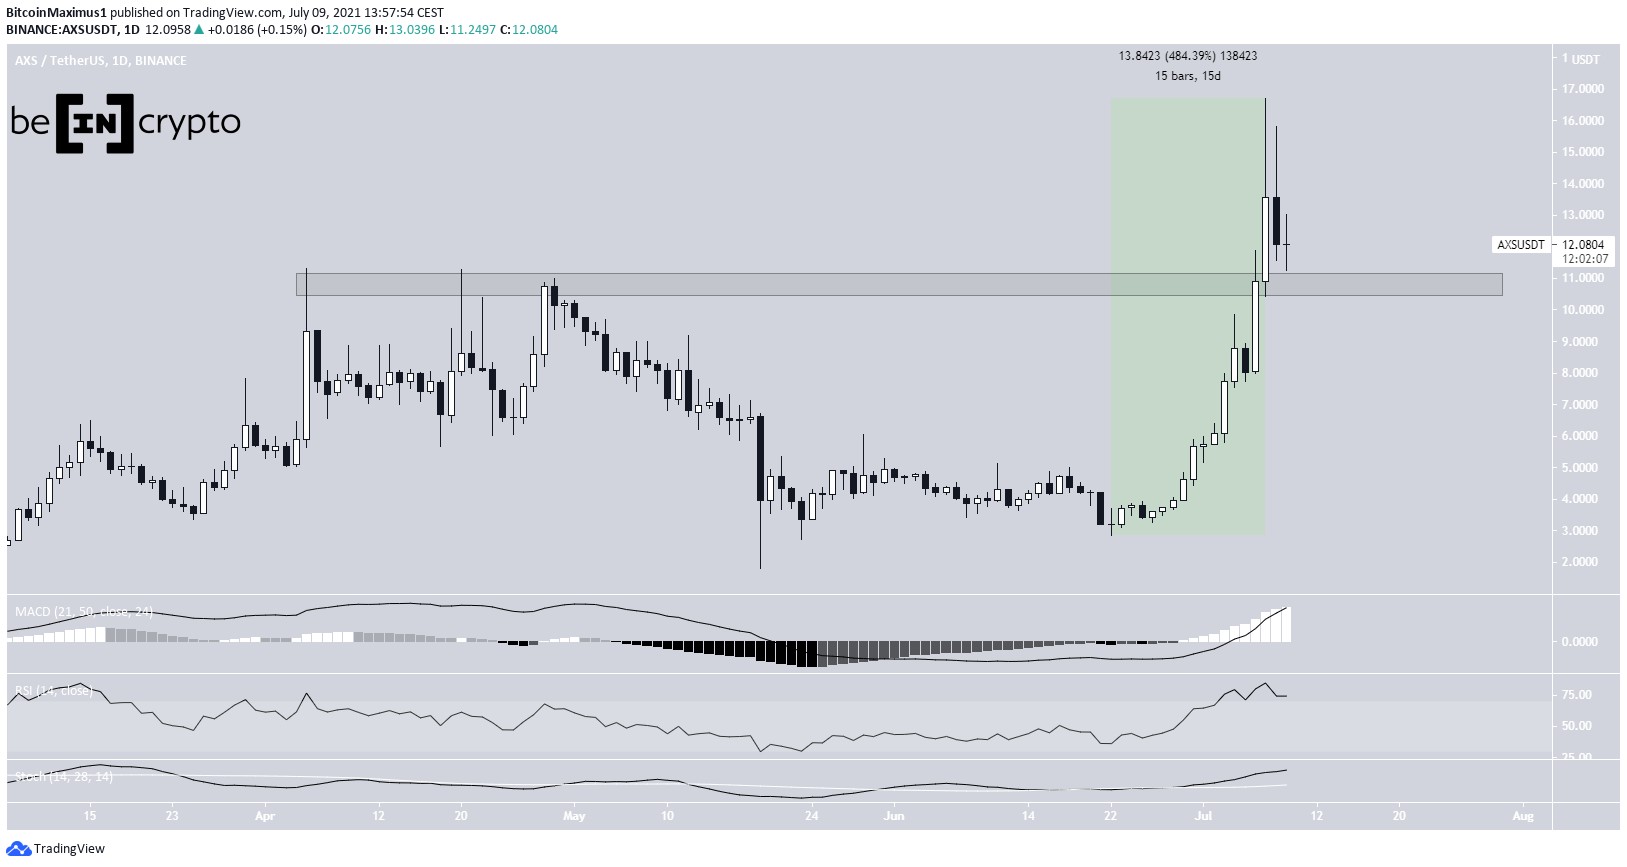
3 min readAxie Infinity (AXS) has broken out from the $10.80 horizontal resistance area and reached a new all-time high on July 7.
The Sandbox (SAND) has broken out from a descending resistance line.
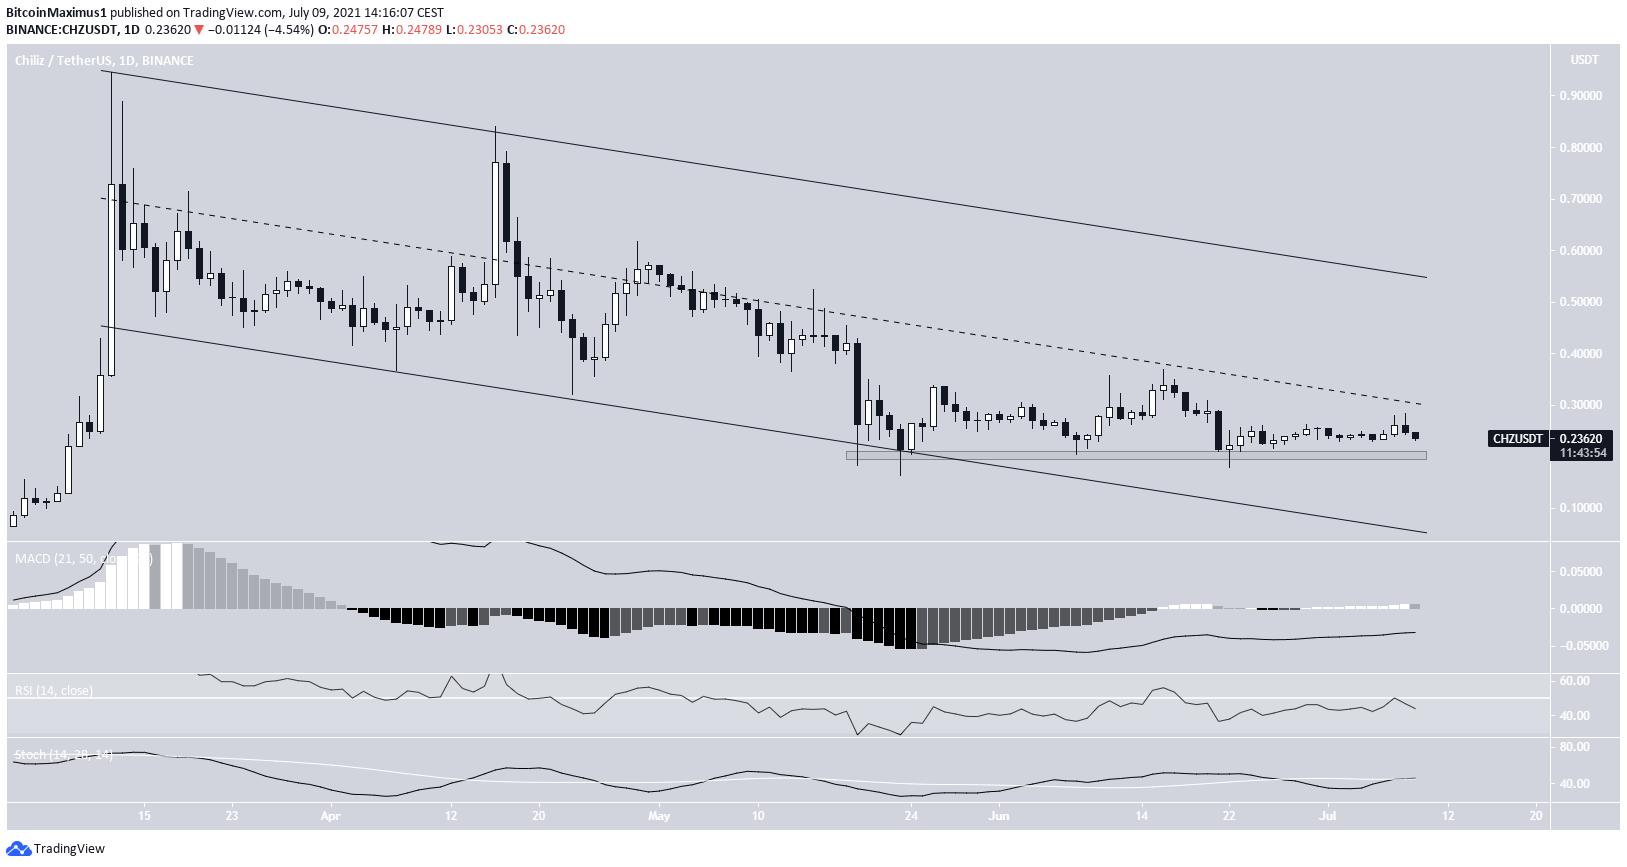
Chiliz (CHZ) has been trading inside a descending parallel channel since March 12.
AXS
AXS has been increasing since it reached a low of $1.80 on May 19. After creating a higher low on June 22, it greatly accelerated its rate of increase.
This led to a new all-time high of $16.70 being reached on July 7. In only fifteen days, AXS increased by 484%. However, the token has been moving downwards since.
Nevertheless, it is still trading above the $10.80 horizontal area. The area previously acted as resistance in April, and is now expected to act as support.
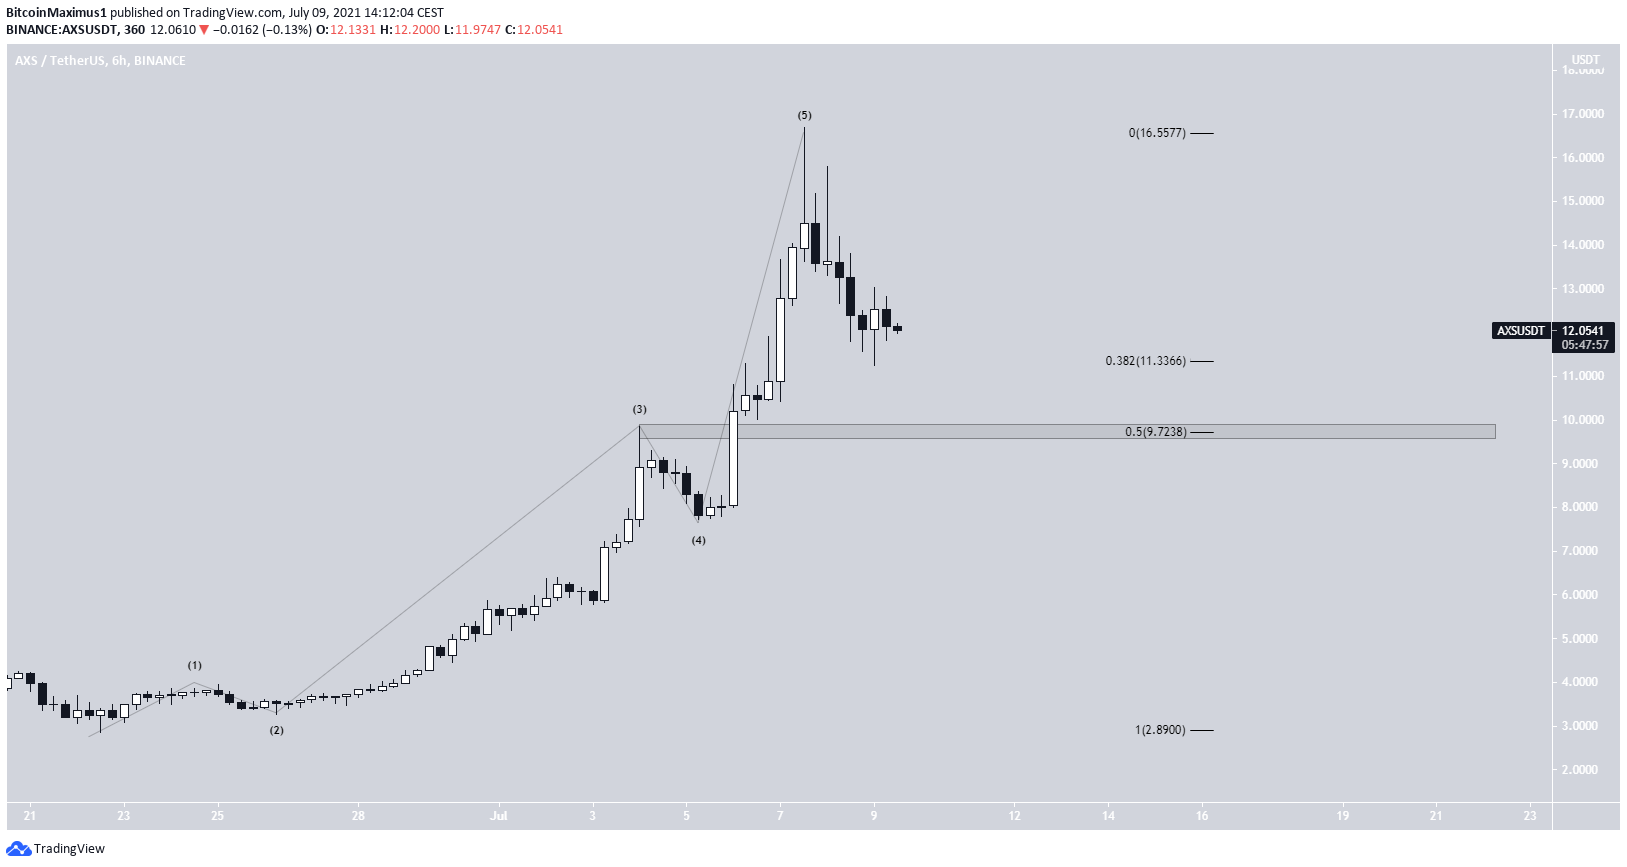
A closer look shows that the movement since June 22 resembles a completed five wave bullish formation.
In addition, it shows that AXS is trading right at the 0.382 Fib retracement support level at $11.30. The 0.5 Fib retracement support level is at $9.70, also being a horizontal support area.
While it could reach this area in the short-term, it would still be more likely to close above the previously outlined $10.80 horizontal support area in the long-term.
Highlights
- AXS reached an all-time high on July 7
- There is support at $11.30 and $9.70.
SAND
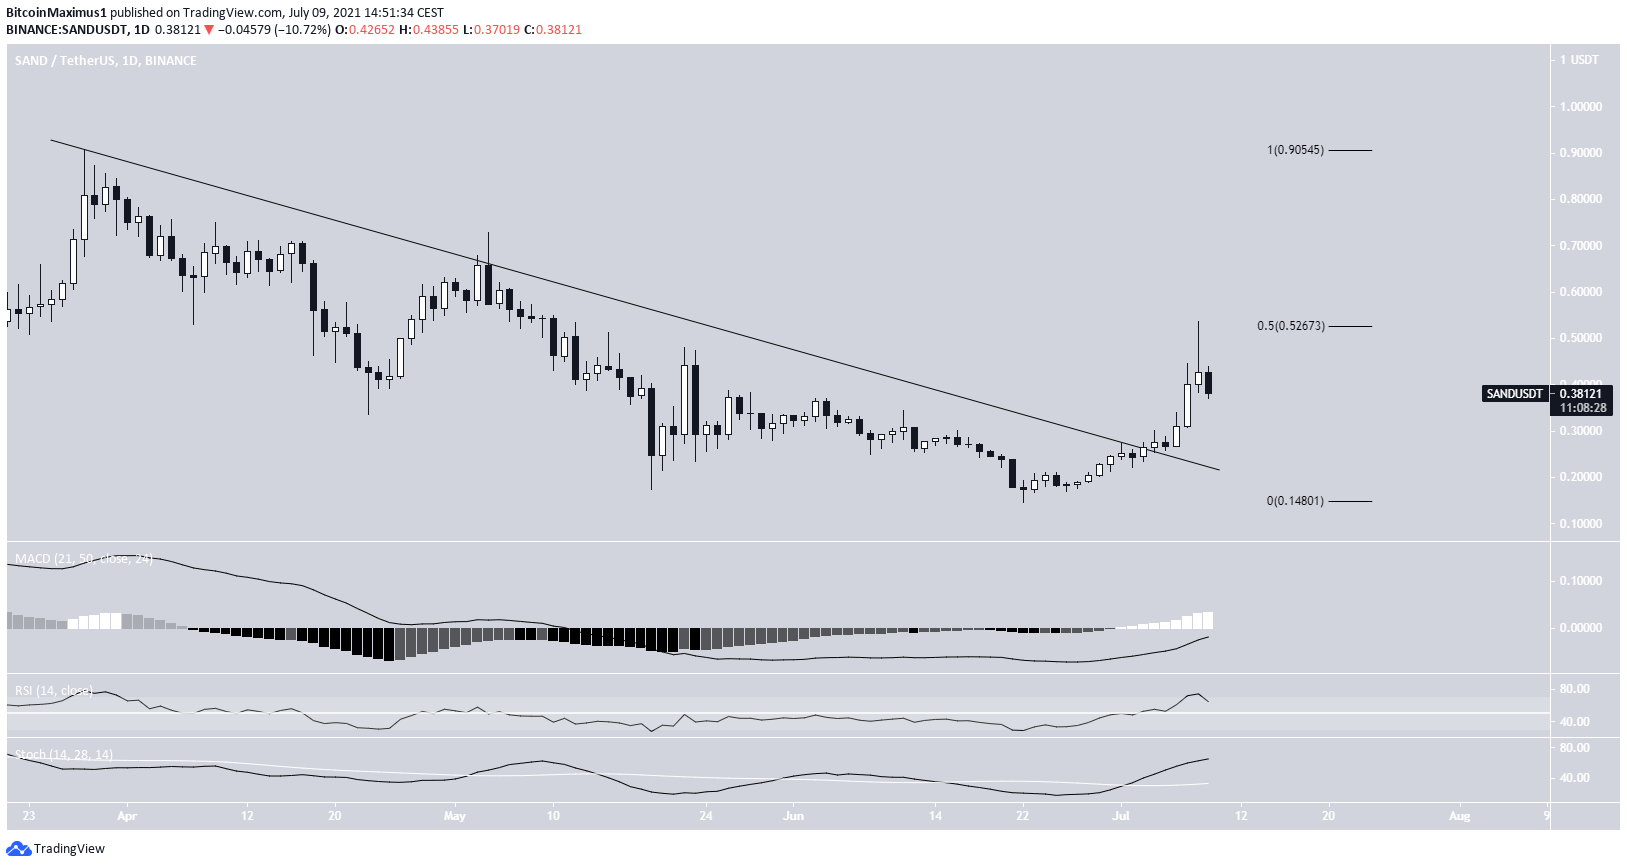
SAND has been following a descending resistance line since March 28, when it reached a high of $0.90. On June 22, it reached a low of $0.146. It has been moving upwards since.
On July 3, it broke out from a descending resistance line. This led to a high of $0.533 being reached on July 8. However, the token was rejected by the 0.5 Fib retracement resistance area at $0.526 and has been moving downwards since.
Nevertheless, technical indicators are still bullish. The MACD, RSI & Stochastic oscillator are all increasing. The RSI is above 50 and the Stochastic oscillator has made a bullish cross.
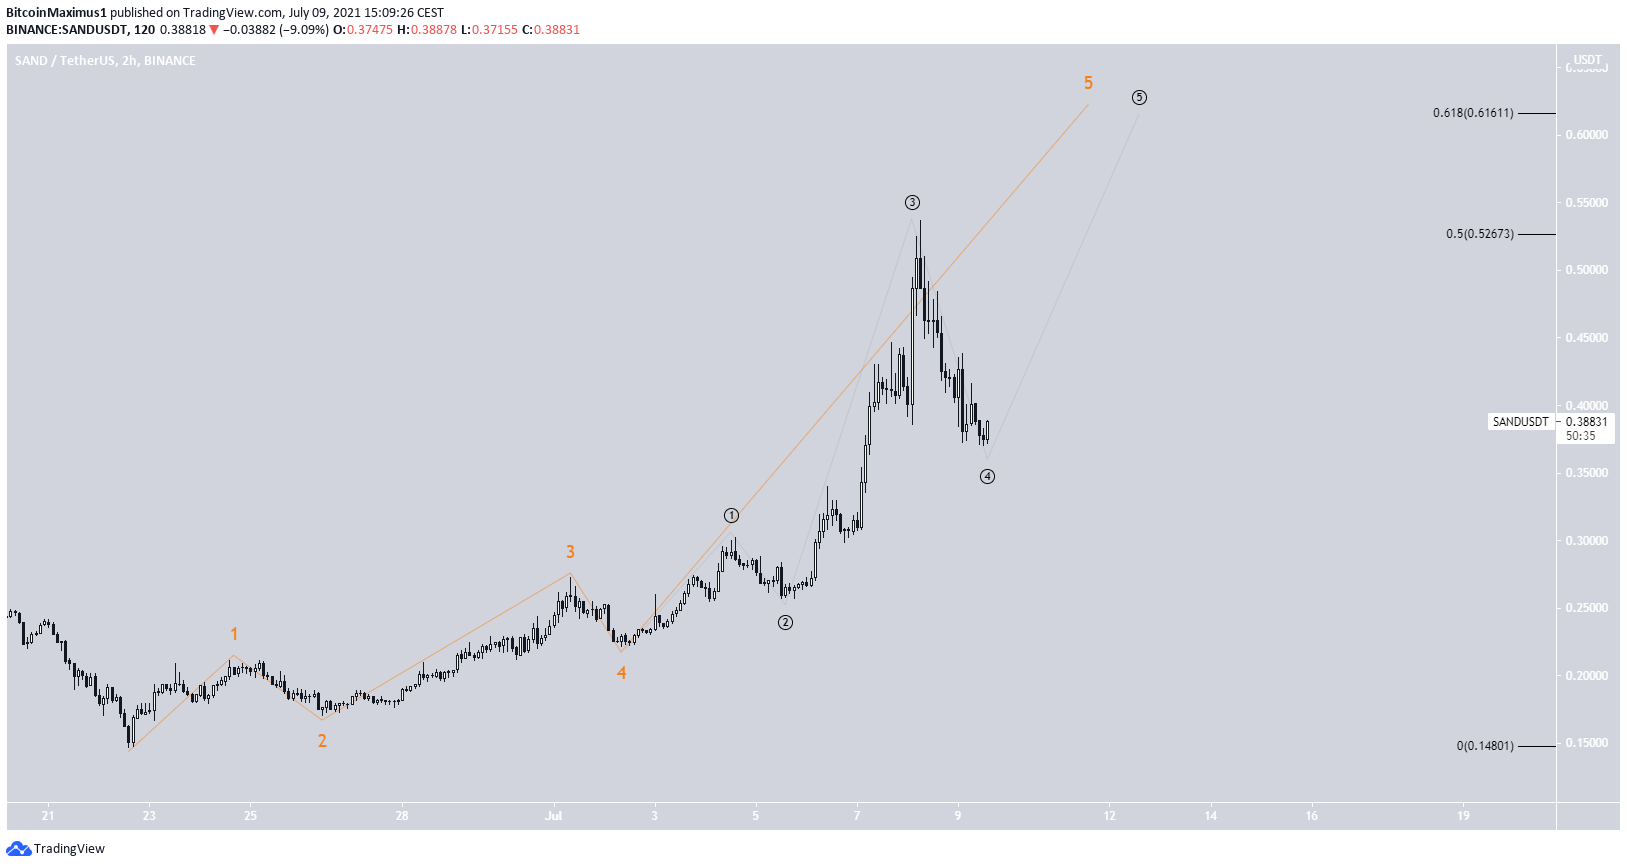
A closer look shows that the upward movement resembles a five wave formation with an extremely extended fifth wave (orange). The sub-wave count is given in black.
If correct, SAND is in sub-wave four of wave five.
If correct, the token could increase towards the 0.618 Fib retracement resistance level at $0.61 before correcting.
Highlights
- SAND has broken out from a descending resistance line.
- It is in wave five of a bullish impulse.
CHZ
CHZ has been trading inside a descending parallel channel since March 12, when it reached a new all-time high of $0.94. Such channels often contain corrective movements. On May 23, it bounced at the support line of the channel.
While it has been increasing since, it has failed to reclaim the middle of the channel. The token is currently trading just above the $0.20 horizontal support area.
Technical indicators are relatively neutral. The RSI is right at the 50 line, the Stochastic oscillator has just made a bullish cross, and the MACD is nearly positive.
Despite the fact that CHZ is trading inside a descending channel, the trend cannot be considered bullish until the middle of the channel is reclaimed.
Highlights
- CHZ is trading inside a descending parallel channel.
- There is support at $0.20.
For BeInCrypto’s latest BTC (BTC) analysis, click here.
The post AXS Reaches New All-Time High – Will Other NFT Tokens Follow? appeared first on BeInCrypto.


![Decentraland: Review & Beginner's Guide [current_date format=Y] 32 Decentraland: Review & Beginner's Guide](https://cryptheory.org/wp-content/uploads/2020/11/decentraland-02-gID_7-300x150.jpg)