BCH, XVG & DNT: Technical Analysis For March 25
3 min readBTC Cash (BCH) has broken out from a long-term resistance area and line. However, it has failed to initiate a considerable upward movement. Even Verge (XVG) has broken down from an ascending support line.
Verge (XVG) has broken down from an ascending support line and is attempting to find support.
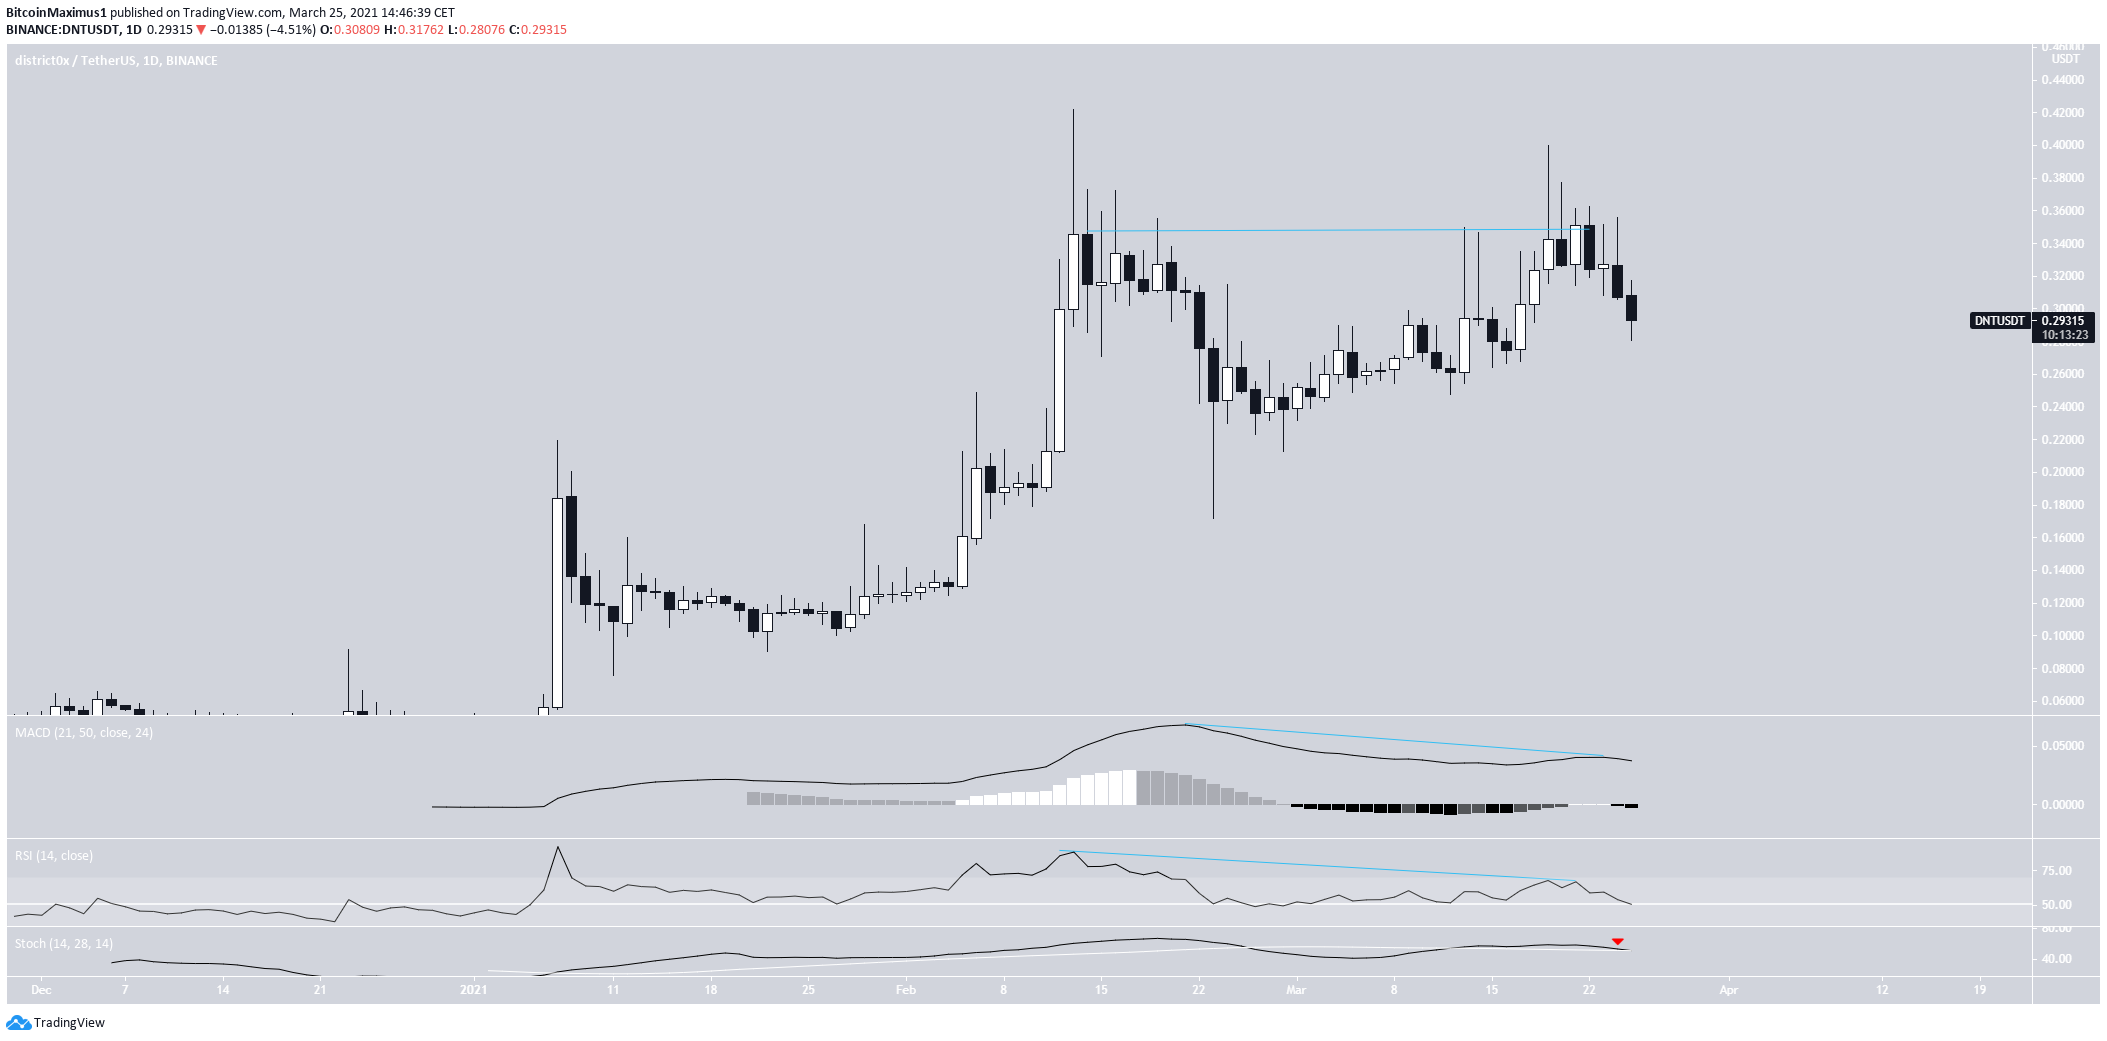
District0x (DNT) has been decreasing since creating a double top pattern on March 20.
BTC Cash (BCH)
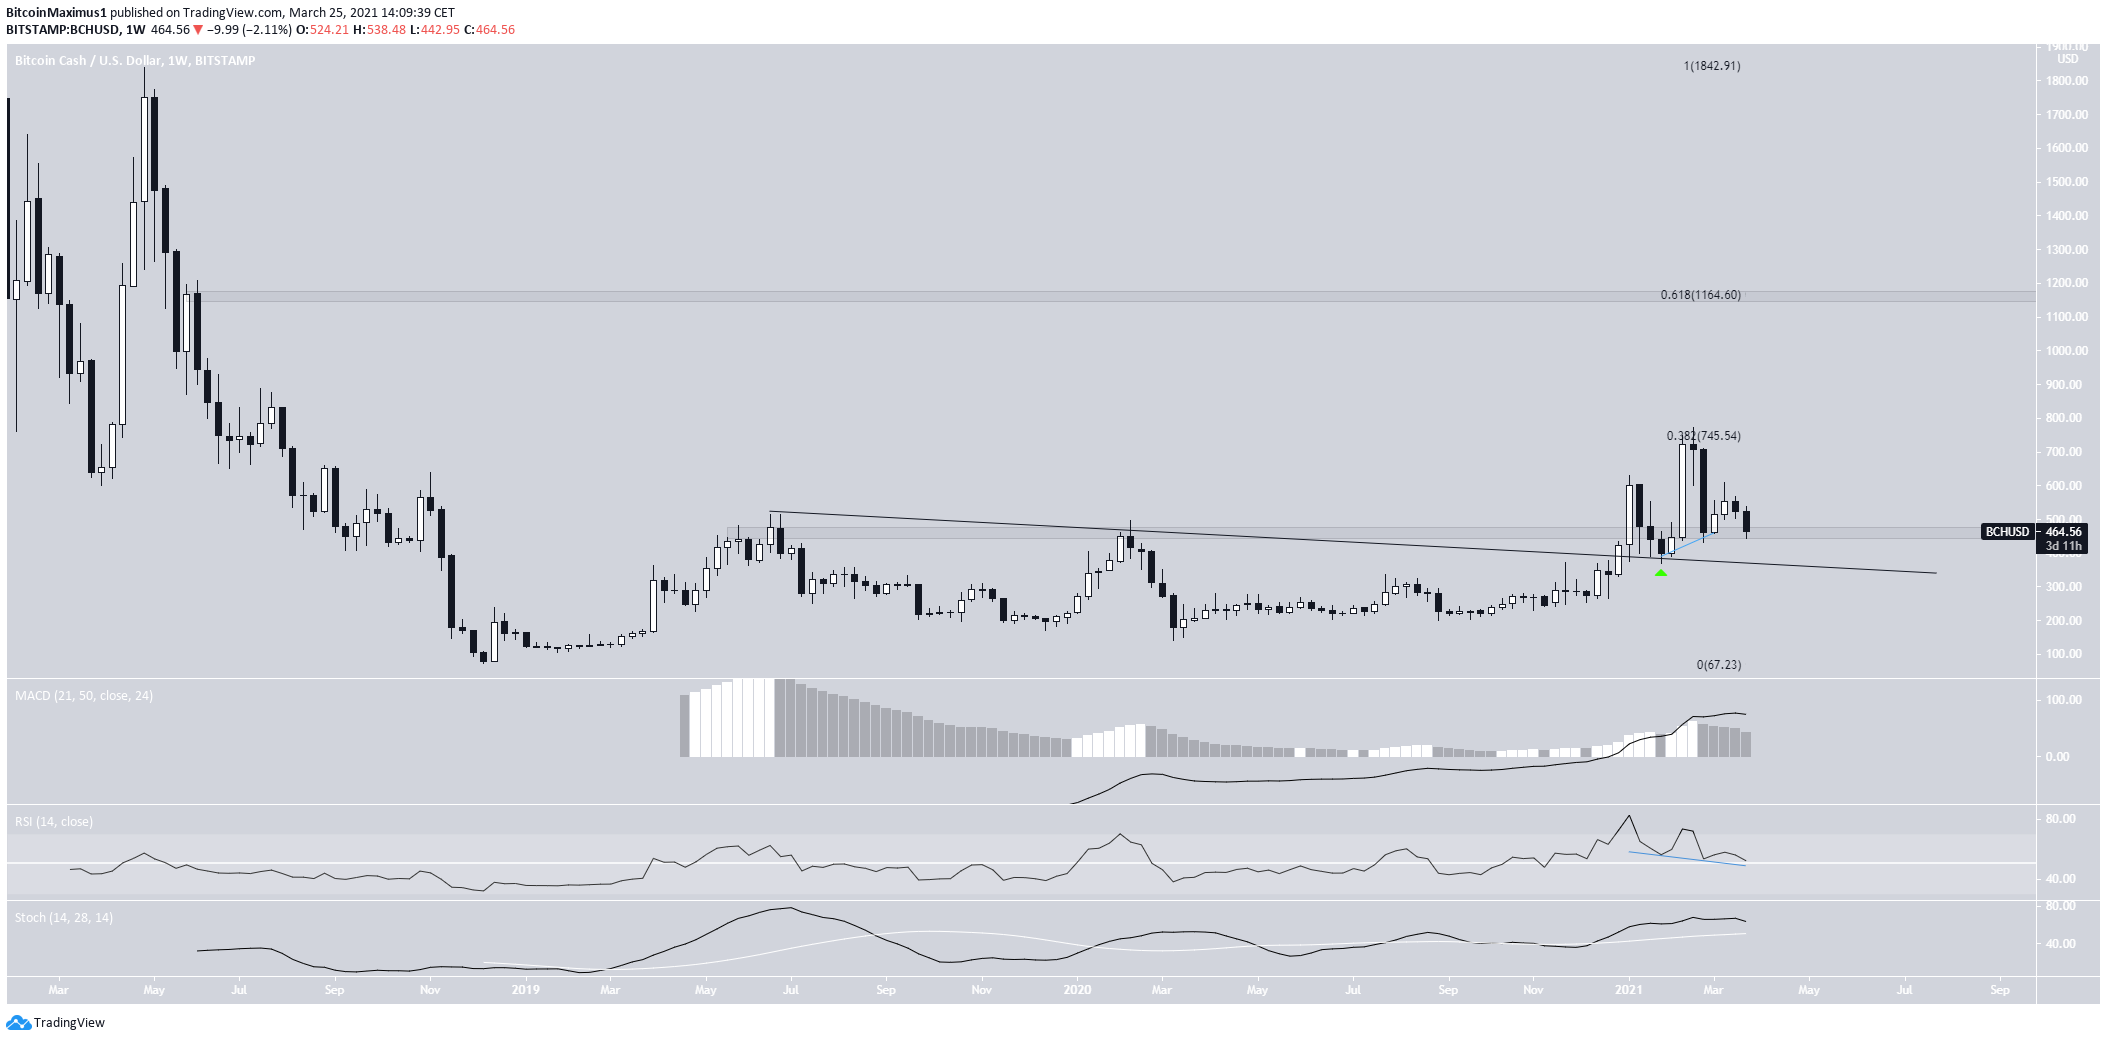
At the beginning of January, BCH broke out from a long-term descending resistance line.
After validating the line as support, BCH moved upwards, reaching a high of $773.
While BCH dropped afterward, it is still trading above the $465 level, which is now supposed to act as support.
Also, the RSI has generated hidden bearish divergence. While both the MACD & Stochastic oscillator are decreasing, they are both positive. These are signs that the trend is likely still bullish.
If BCH manages to move upwards, the next long-term resistance levels are $745 and $1165.
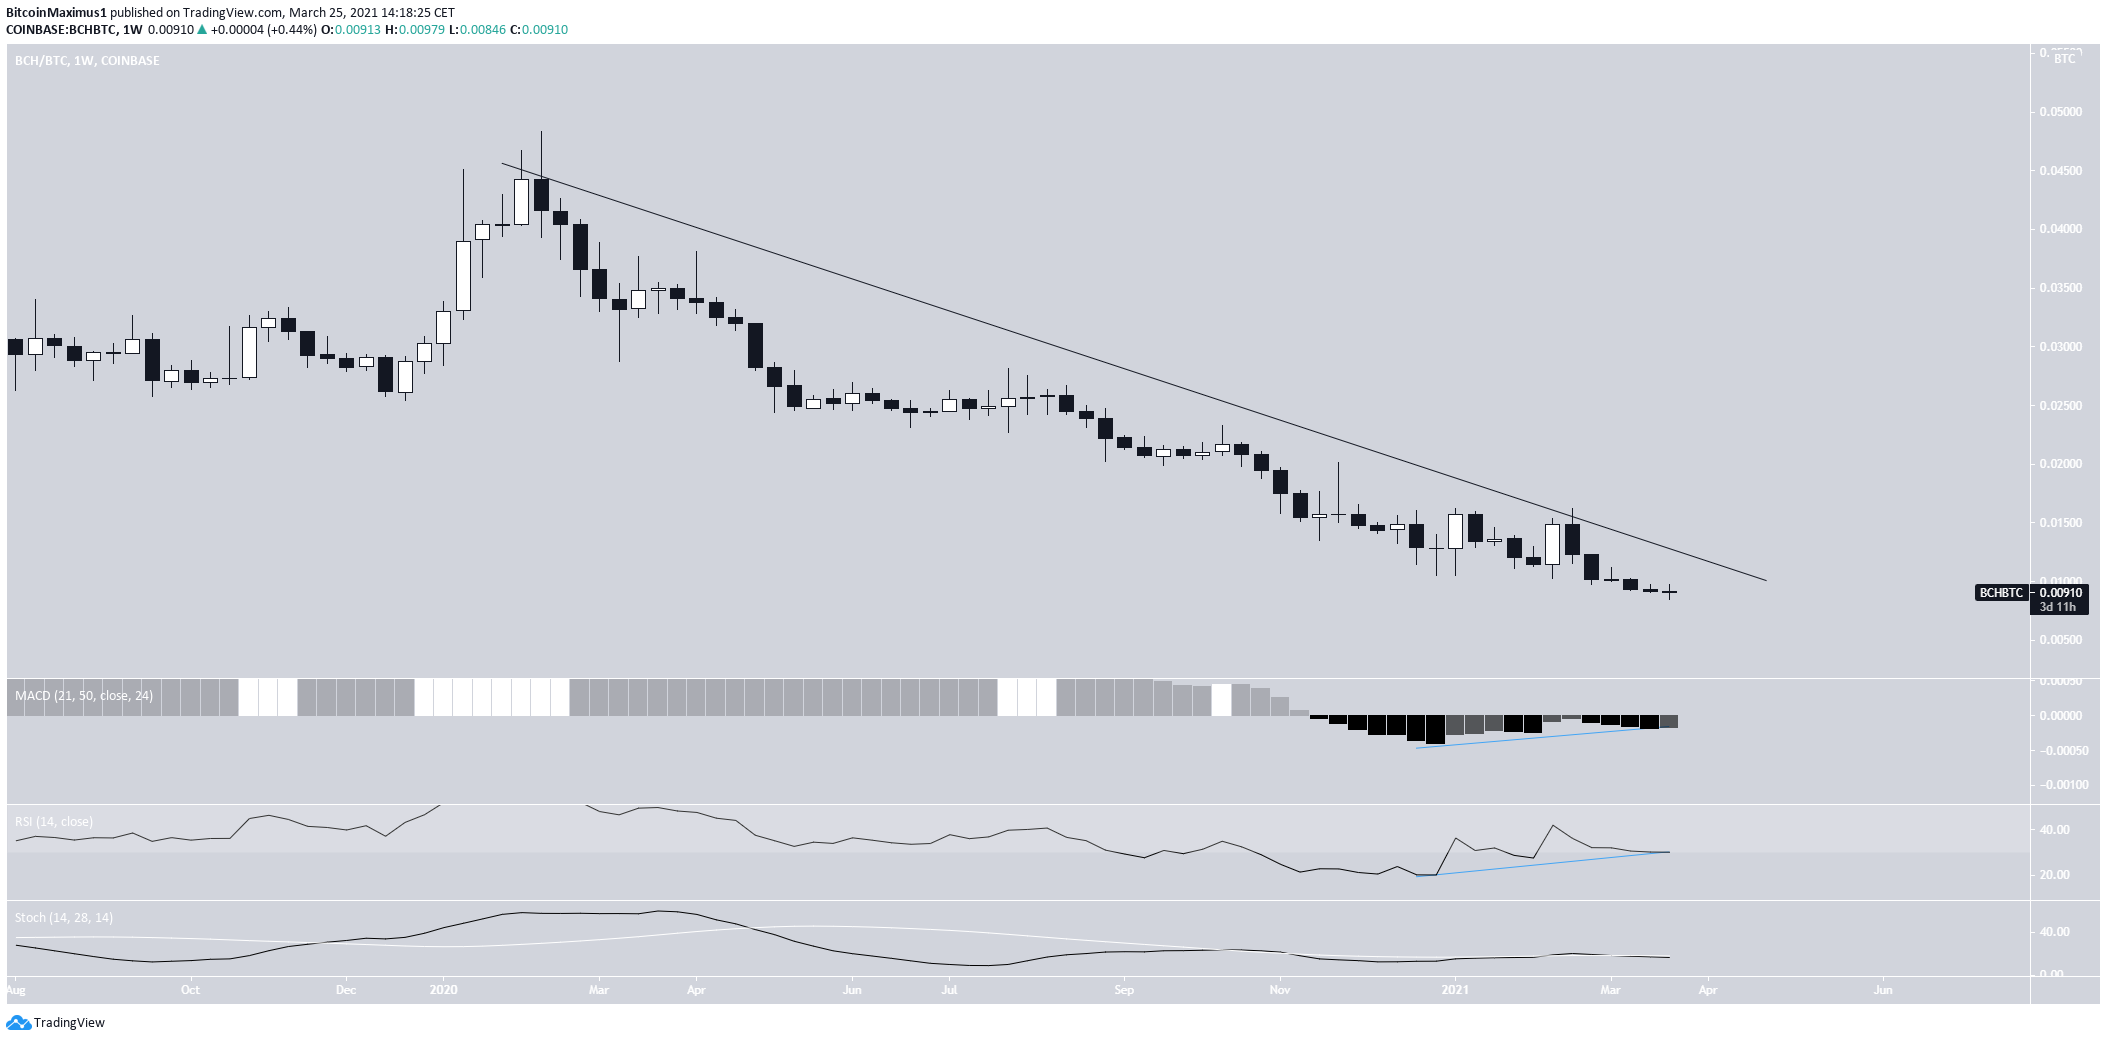
BCH/BTC has been decreasing since February 2020. On March 24, 2021, it reached an all-time low price of ₿0.00846.
Both the weekly RSI & MACD have generated considerable bullish divergences, a strong sign of a trend reversal.
However, until BCH manages to break out above the current descending resistance line, the trend cannot be considered bullish.
Highlights
- BCH is trading above long-term support at $465.
- Long-term indicators are bullish for both BCH/BTC and BCH/USD.
Verge (XVG)
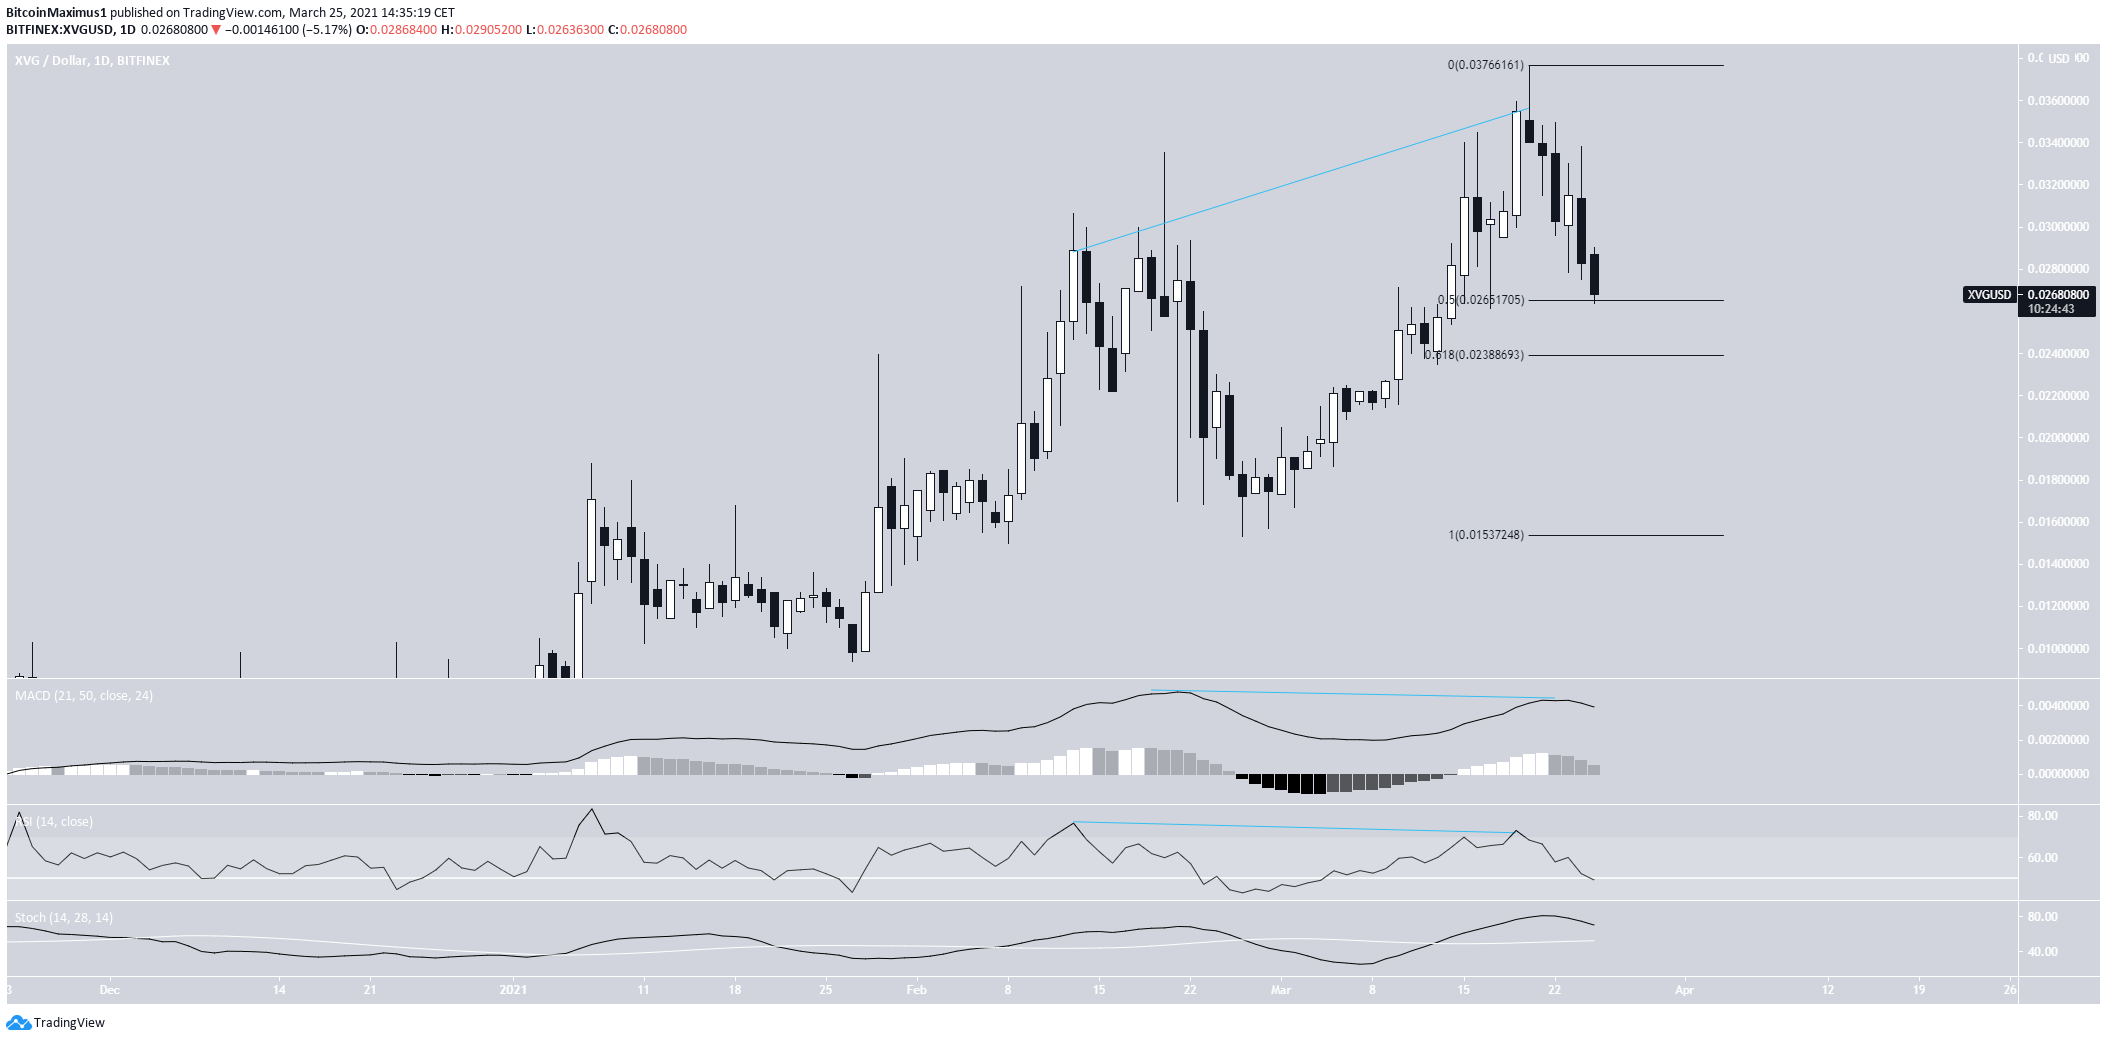
XVG has been decreasing since March 20, when it reached a high of $0.0376. The drop was preceded by bearish divergence in both the RSI & MACD. However, the former is still positive while the latter is above 50.
Also, XVG is trading right at the 0.5 Fib retracement support at $0.026. The next support area is found at $0.0242, the 0.618 Fib retracement of the same movement.
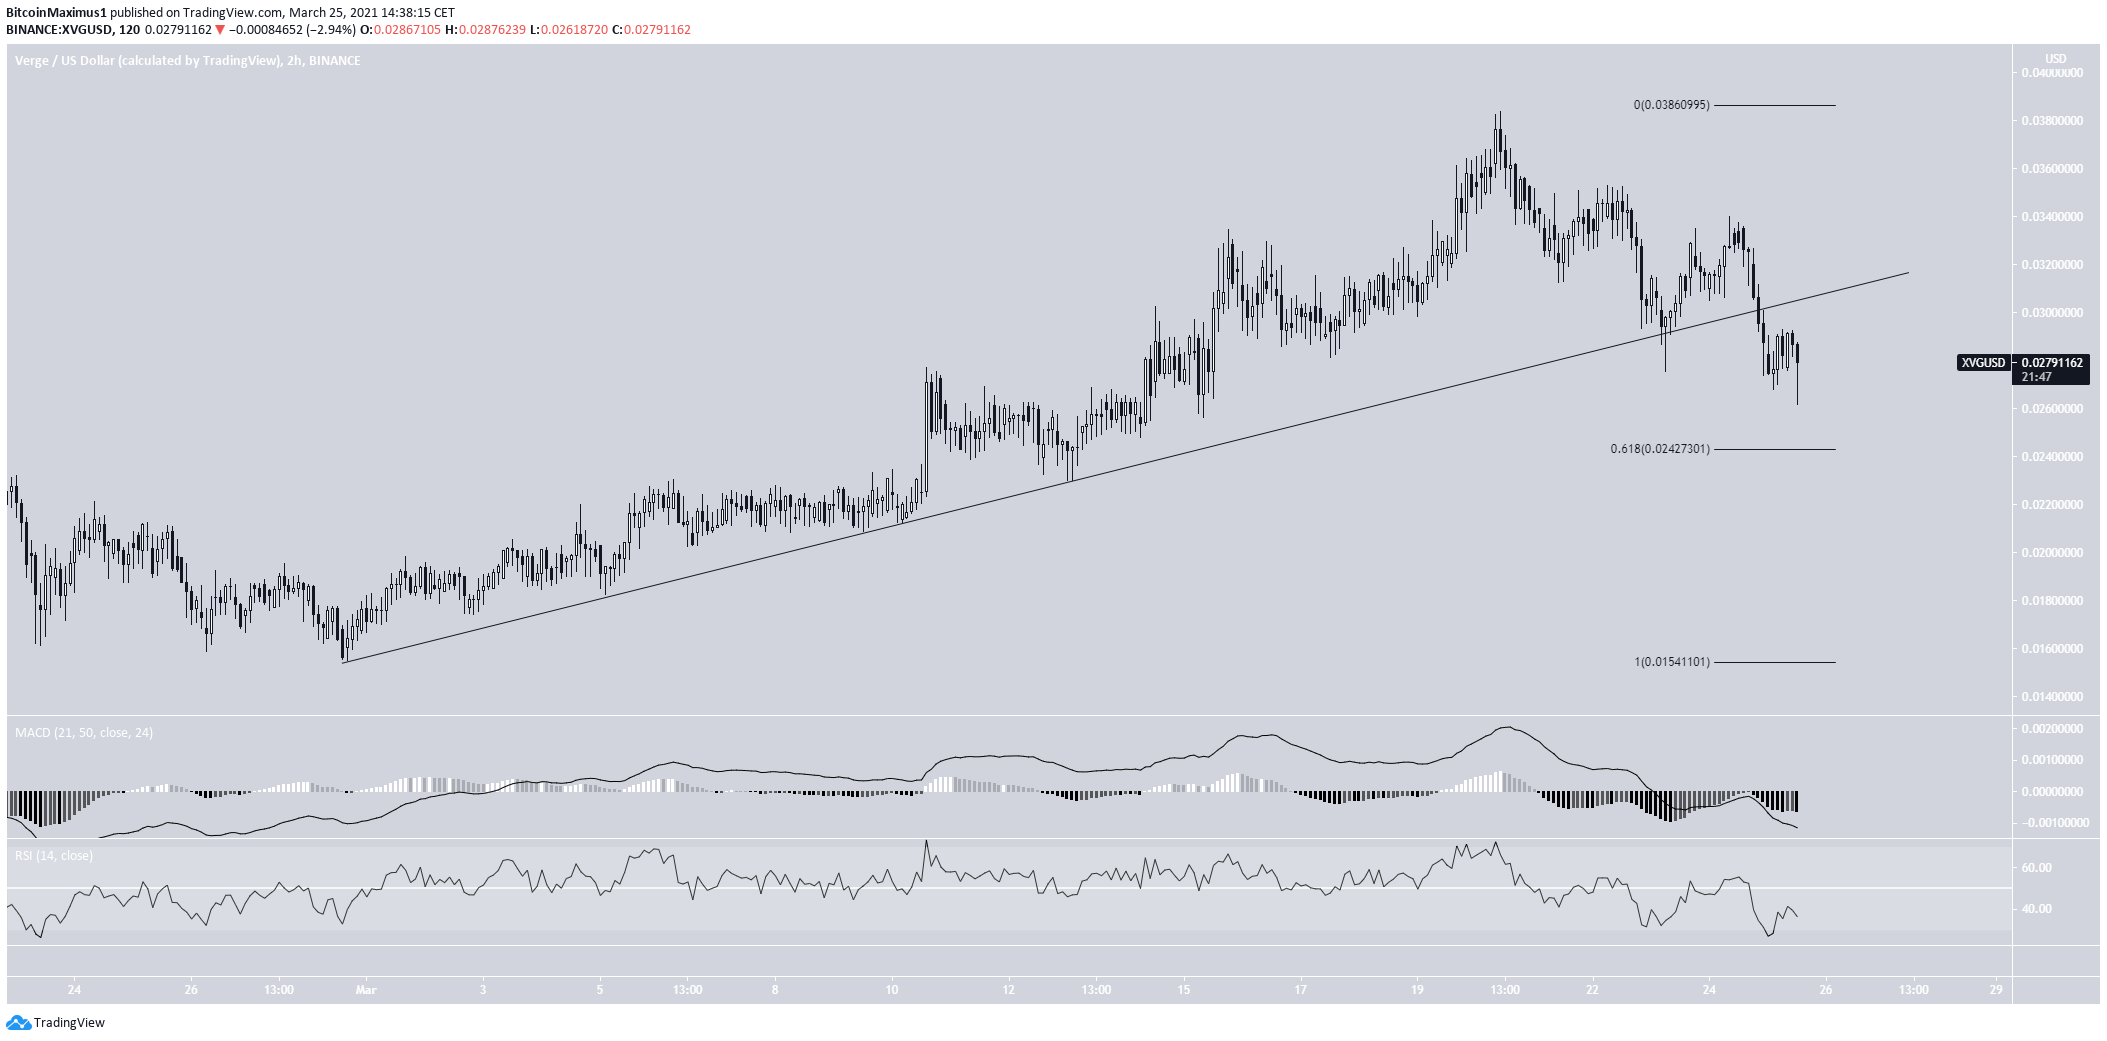
The shorter-term two-hour chart shows that XVG has broken down from an ascending support line.
There are no bullish reversal signs yet. Therefore, it is likely that XVG continues dropping until it reached the 0.618 Fib retracement support at $0.0242.
Highlights
- XVG has broken down from an ascending support line.
- Technical indicators are bearish in the daily and short-term time-frames.
District0x (DNT)
On February 13, DNT reached a high of $0.422. After a considerable drop, it reached similar levels on March 20.
However, the trend created a double top pattern, combined with a bearish divergence in both the RSI & the MACD.
Since then, DNT has been moving downwards.
Technical indicators are bearish since the MACD is negative and the Stochastic oscillator has made a bearish cross.
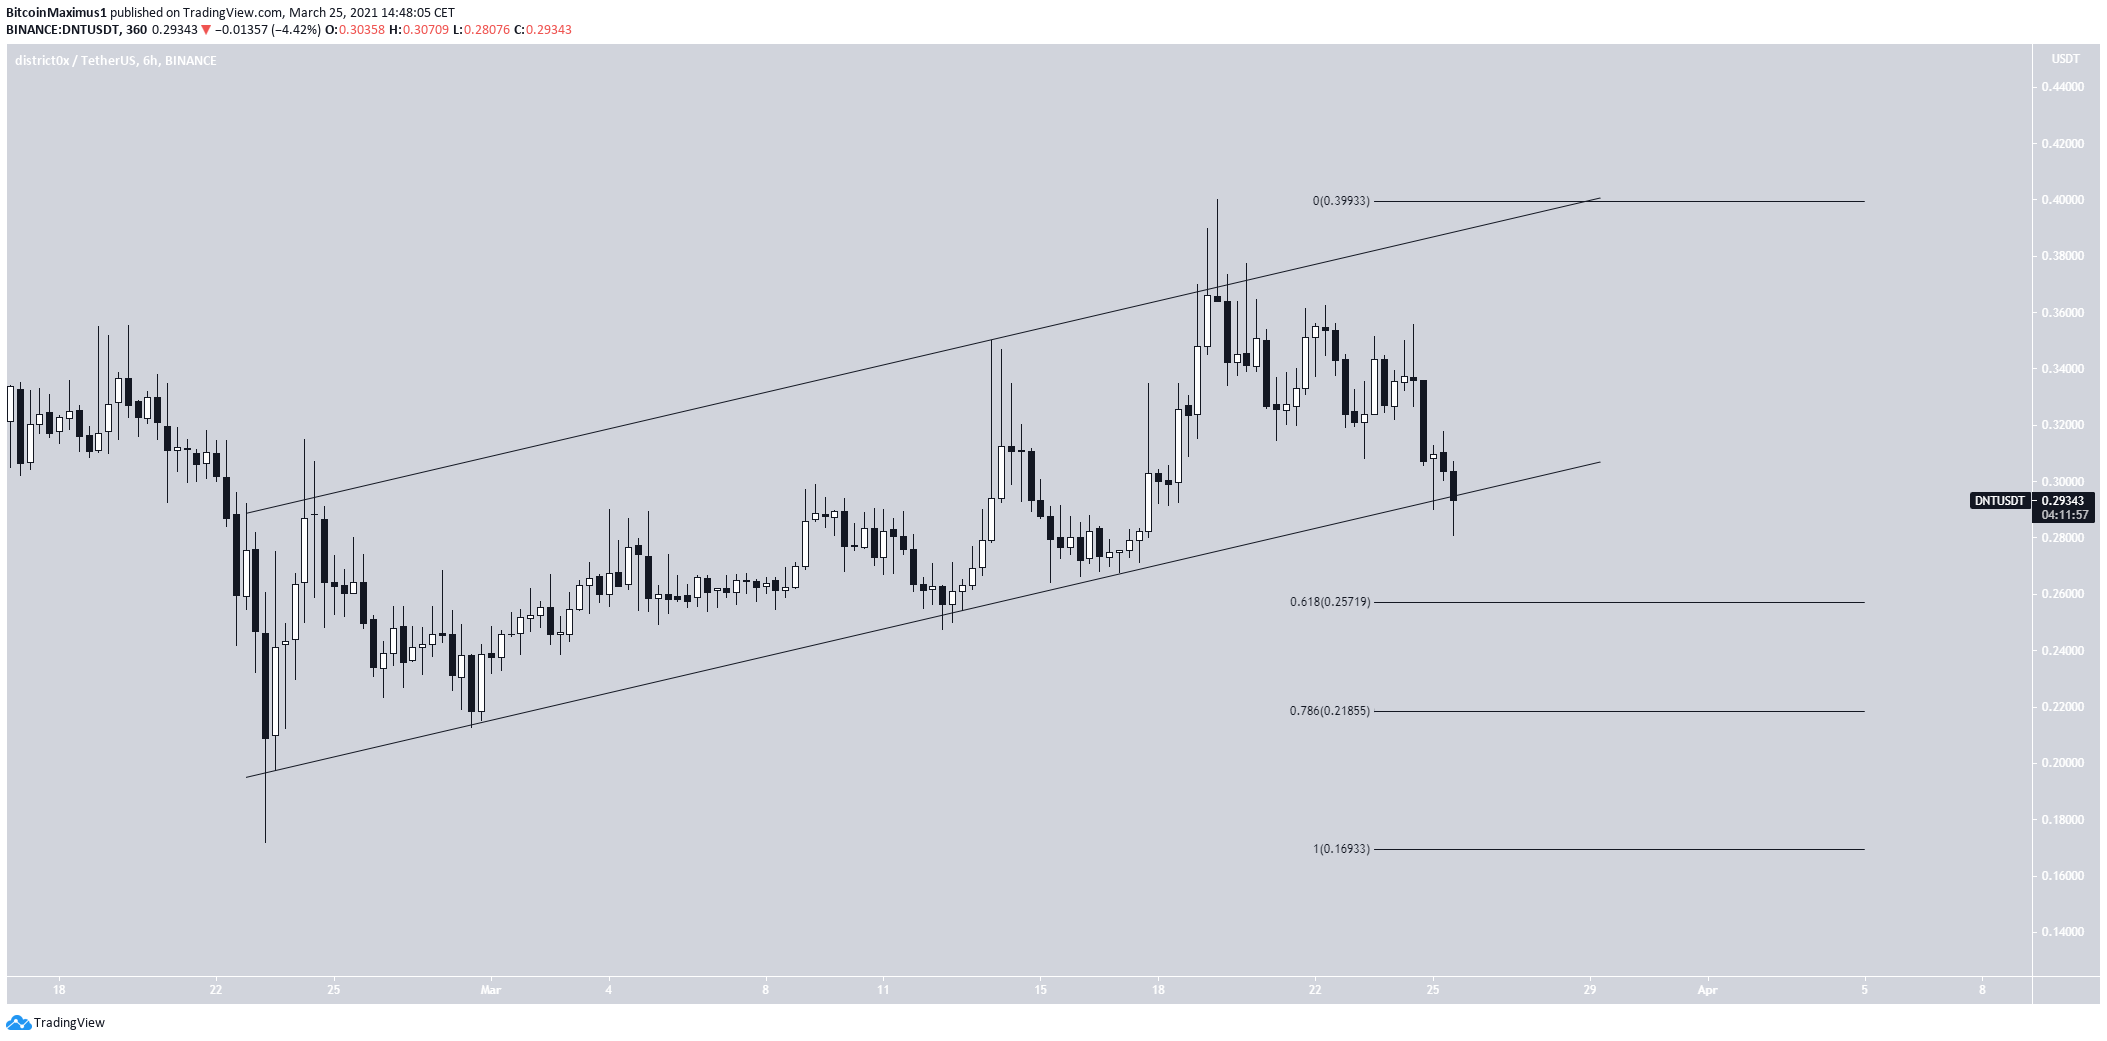
The shorter-term chart shows that DNT is trading inside an ascending parallel channel. This is often a corrective movement.
If DNT breaks down, the next support levels would be found at $0.257 and $0.2185.
Highlights
- DNT has created a double top pattern.
- It is trading inside a parallel ascending channel.
For BeInCrypto’s latest BTC (BTC) analysis, click here.
The post BCH, XVG & DNT: Technical Analysis For March 25 appeared first on BeInCrypto.



![Decentraland: Review & Beginner's Guide [current_date format=Y] 34 Decentraland: Review & Beginner's Guide](https://cryptheory.org/wp-content/uploads/2020/11/decentraland-02-gID_7-300x150.jpg)