Bitcoin Adds 10% In a Day, Reaches Long-Term Resistance
2 min readTable of Contents
The Bitcoin (BTC) price created a bullish engulfing candlestick on Nov 5, reaching a high of $15,570 to mark a 10% gain for the day.
While the price has reached an important resistance area that could act as the top, there are no signs of weakness yet in the trend.
Bitcoin Long-Term Resistance
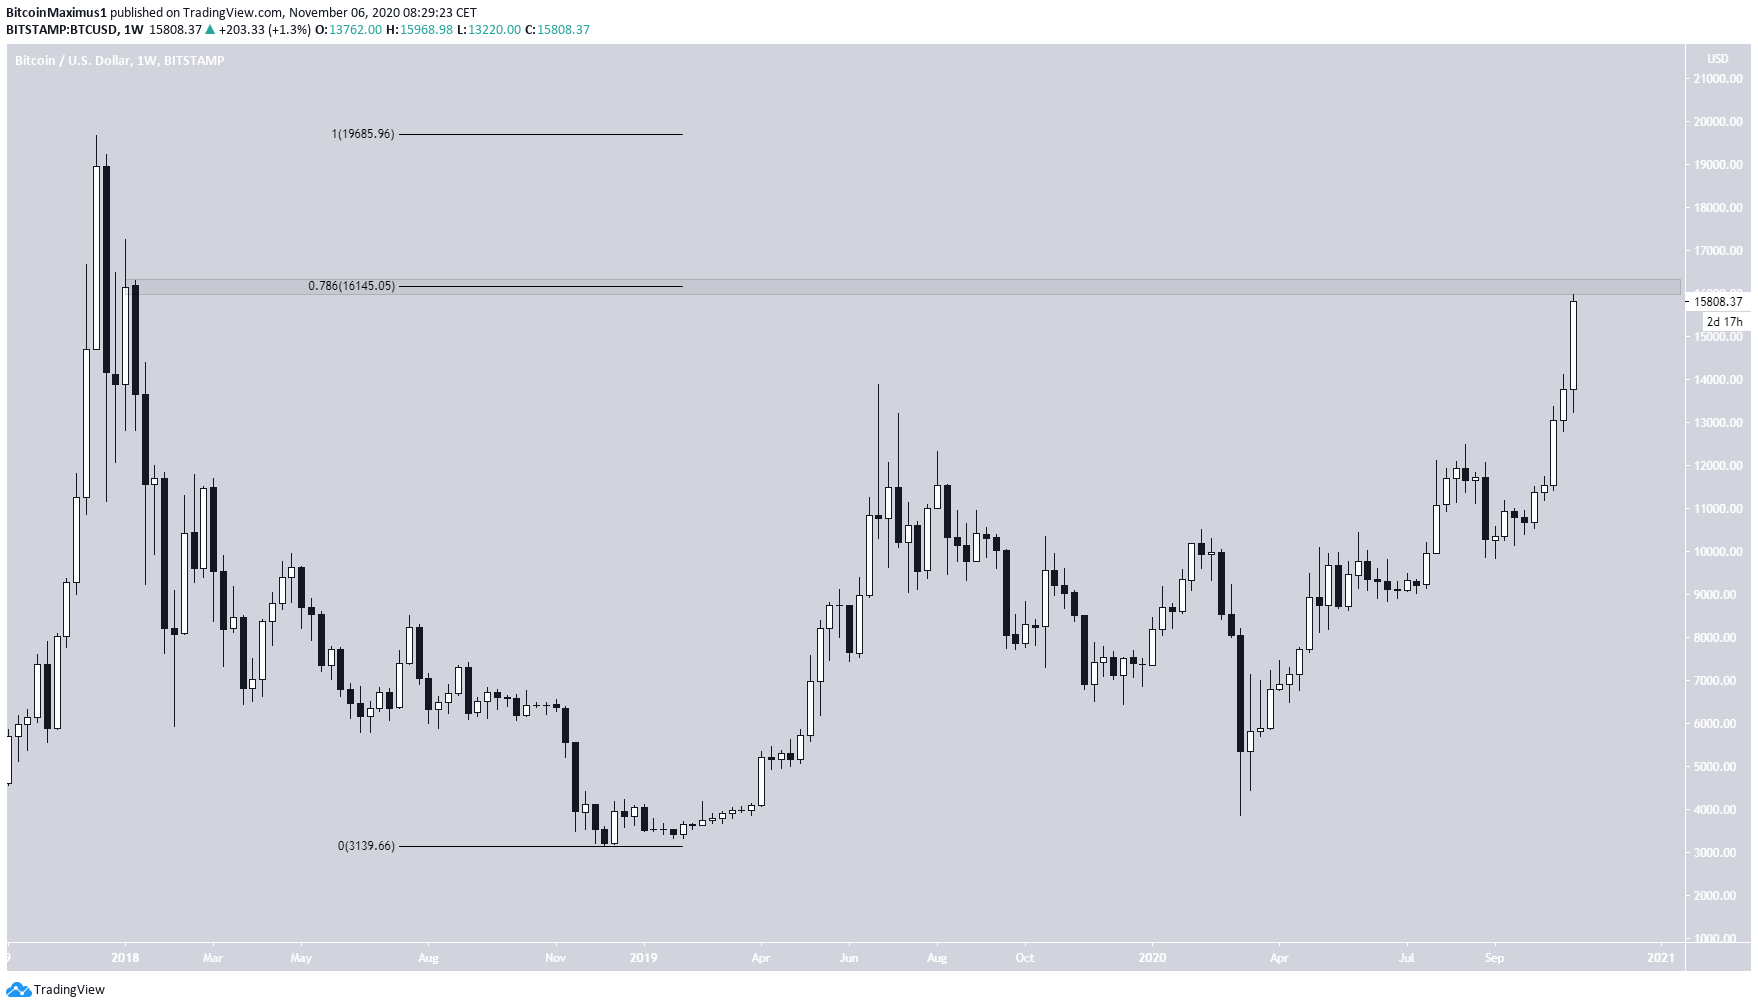
The Bitcoin price is approaching a significant resistance area at $16,145. The area is the 0.786 Fib level of the entire previous decrease and a previous resistance area.
The price has yet to show any long-term weakness and is currently in the process of creating a bullish candlestick with a negligible upper wick.

Current Increase
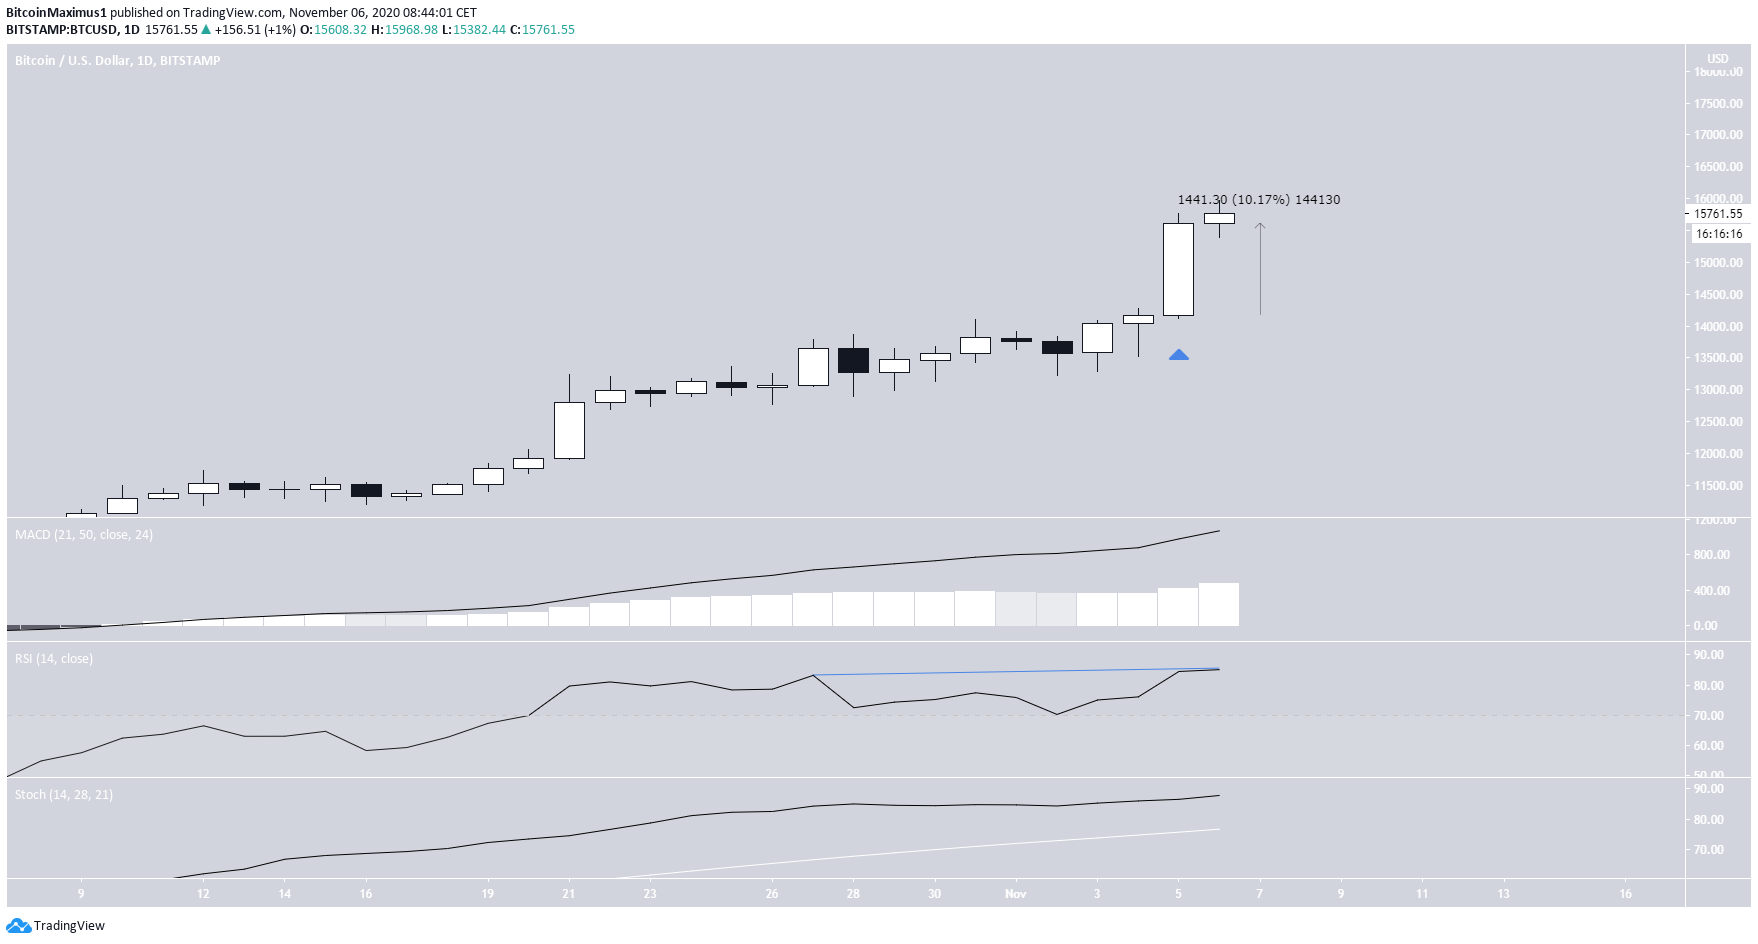
The daily chart shows the bullish engulfing candlestick created yesterday, which measured an increase of 10%. Today, the price reached a high of $15,968 before pulling back a bit.
Technical indicators do not yet show any weakness. There is no bearish divergence and the RSI, Stochastic oscillator, and MACD are all increasing.

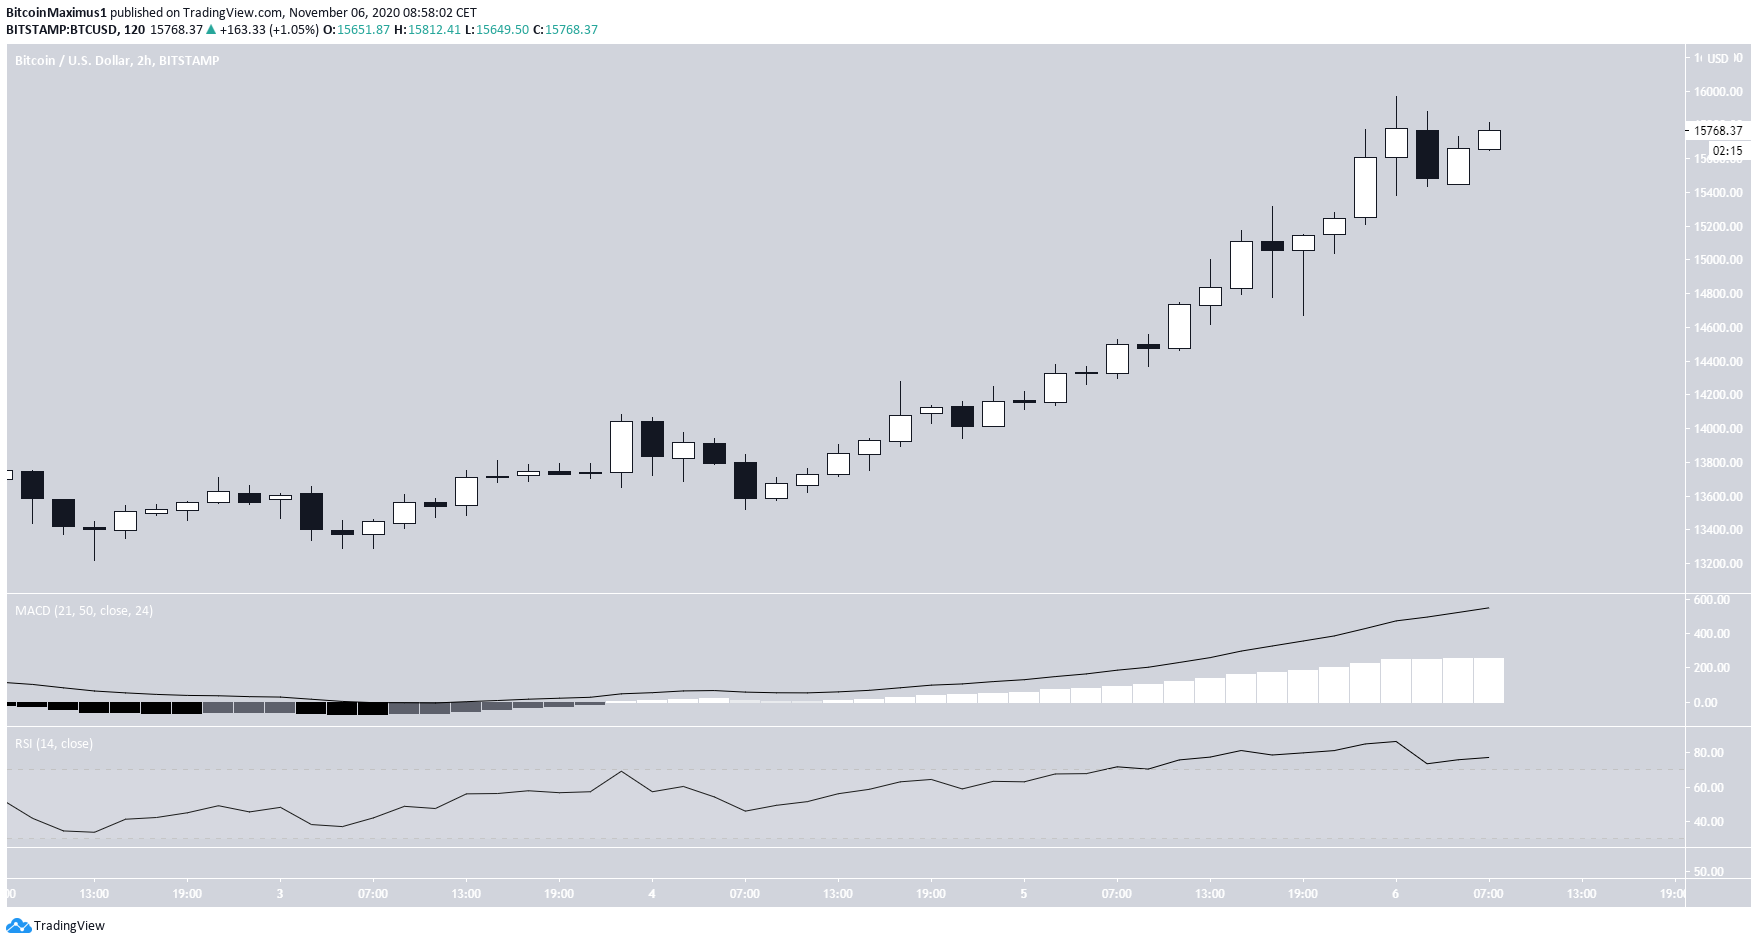
Similarly, the shorter-term two-hour chart does not show clear weakness, even if the rally has become parabolic.
While the RSI and MACD are oversold, neither has generated a bearish divergence, allowing for the possibility that the upward movement will continue.

Wave Count
As for the wave count, it is likely that BTC began a bullish impulse on Sept 7, and is currently in the fifth-and-final wave of this formation (shown in orange below).
BTC has already reached two important Fib resistances, the 4.61 Fib of wave 1 and the 0.618 Fib of waves 1-3, which means that a top could be near. These resistances also coincide with the long-term $16,100 resistance outlined in the first section.
Despite this, there is no weakness found in technical indicators.

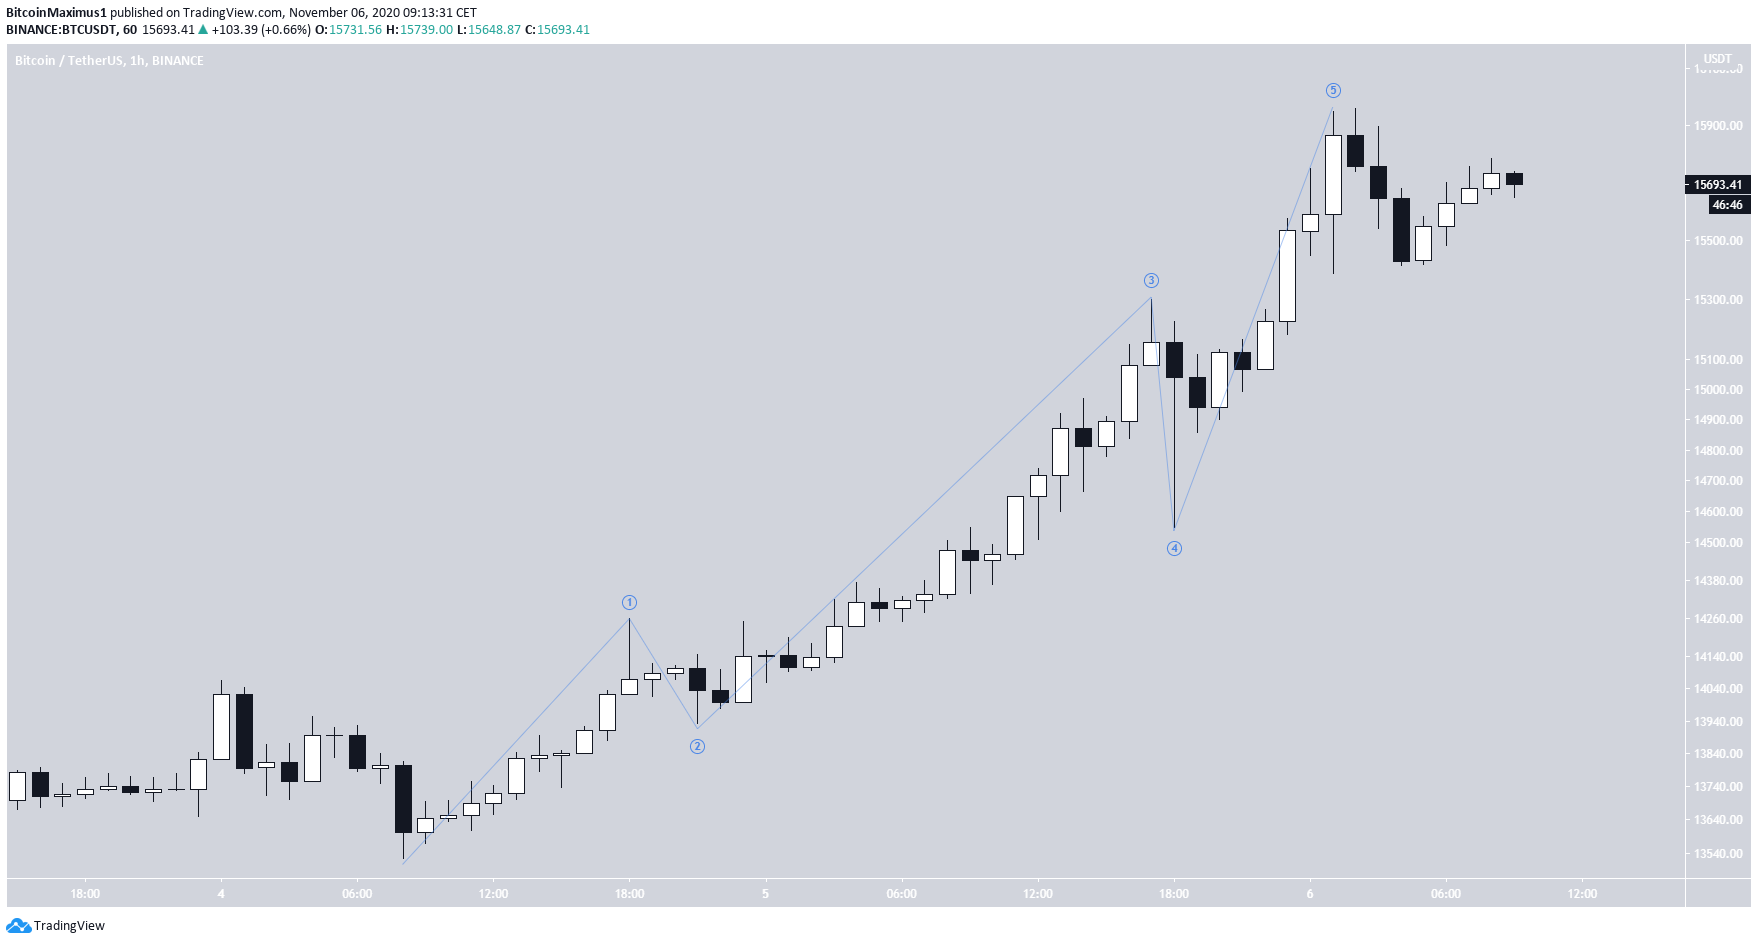
A closer view also reveals a possible completed five sub-wave formation (blue), which if correct, would complete the aforementioned wave 5.

Conclusion
To conclude, while the BTC price has reached an important Fib and horizontal resistance level which would be expected to act as the top, there is no weakness yet to suggest that the trend will reverse.
For BeInCrypto’s previous Bitcoin analysis, click here!
Disclaimer: Cryptocurrency trading carries a high level of risk and may not be suitable for all investors. The views expressed in this article do not reflect those of BeInCrypto.
The post Bitcoin Adds 10% In a Day, Reaches Long-Term Resistance appeared first on BeInCrypto.


![Decentraland: Review & Beginner's Guide [current_date format=Y] 32 Decentraland: Review & Beginner's Guide](https://cryptheory.org/wp-content/uploads/2020/11/decentraland-02-gID_7-300x150.jpg)