Bitcoin (BTC) Drops 15% — Is the Bull-Run Over?
2 min readTable of Contents
Bitcoin (BTC) decreased considerably on Jan. 10, at one point falling by more than $6,000.
Technical indicators are slowly turning bearish, and the loss of the $32,700 support area would confirm that the Bitcoin trend is bearish.
Weekly Bitcoin Outlook
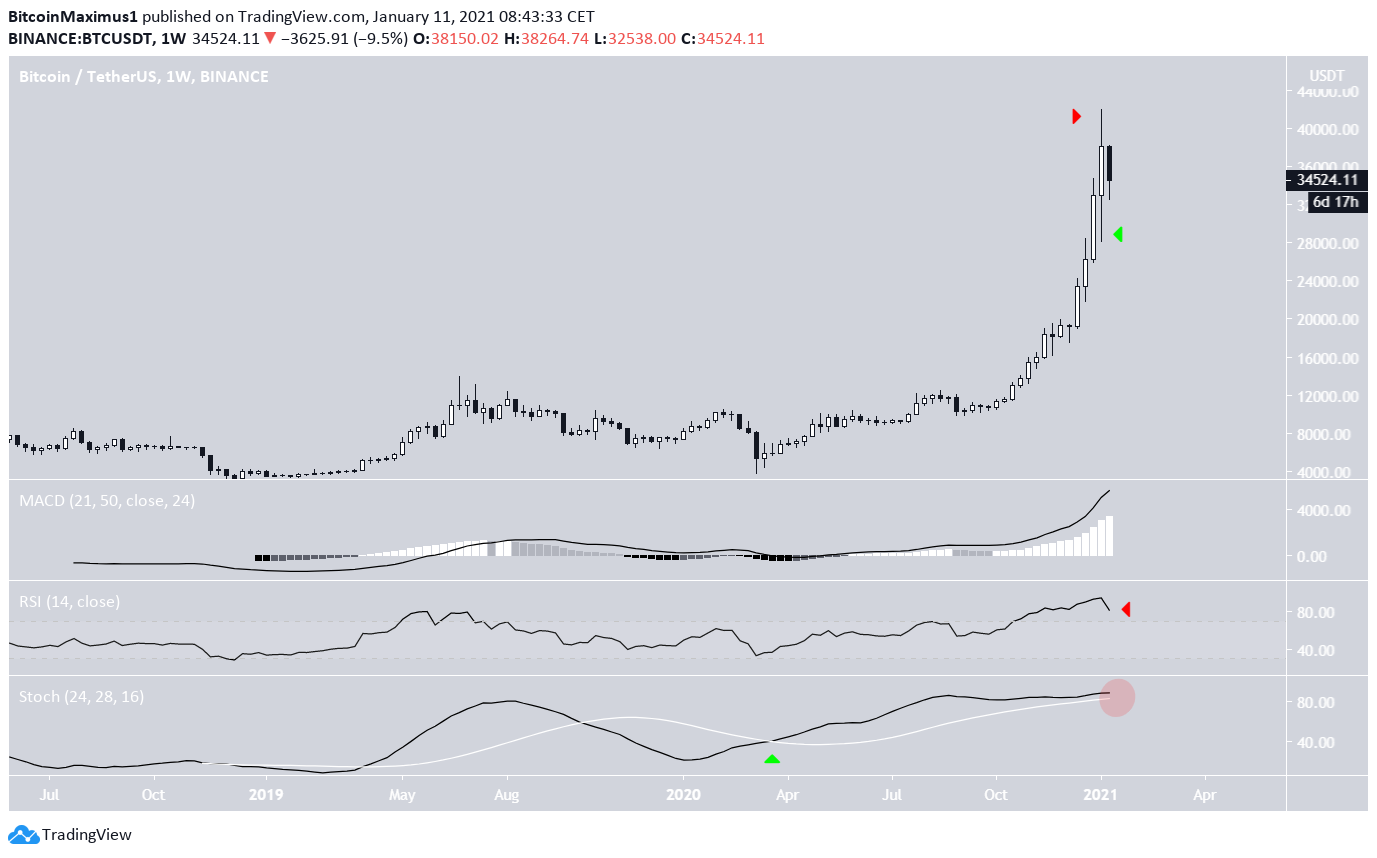
Bitcoin increased considerably during the week of Jan. 4-11, reaching an all-time high of $41,950 in the process. However, the weekly candlestick had both long upper and lower wicks, a sign of indecision between sellers and buyers. BTC has begun the current week with a bearish candlestick.
While the MACD is still increasing, the RSI has started to fall and the Stochastic oscillator is very close to making a bearish cross (highlighted in red below).
If a cross were to occur, it would be a very strong bearish sign, especially considering a bullish weekly Stoch was present for the entire bull-run that began in March.

Current Support
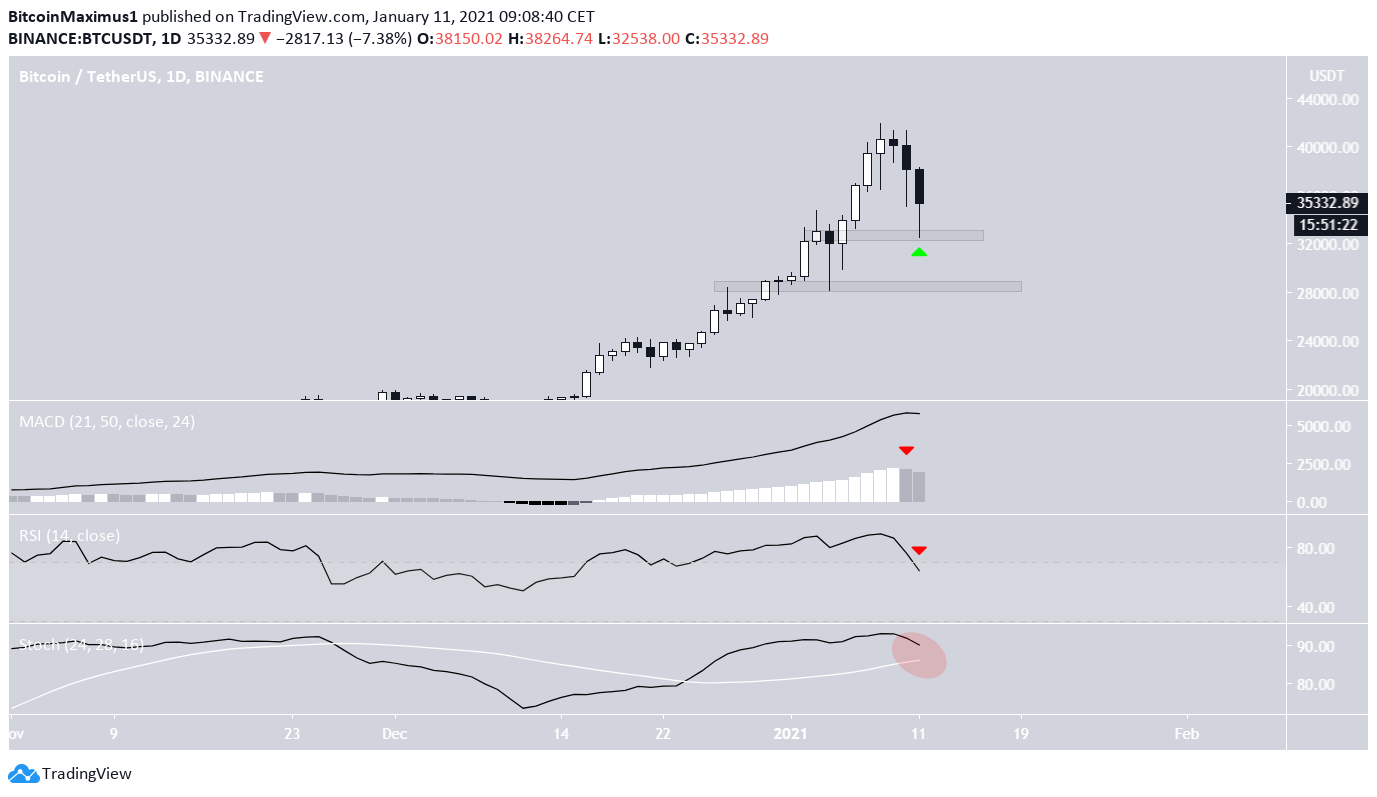
The daily chart gives us two support levels, found at $32,700 and $28,400. BTC has already reached the first support and bounced, possibly creating a long lower wick in the process, since the daily candlestick has yet to close.
Despite the bounce, technical indicators are gradually turning bearish. The MACD has generated the first lower momentum bar in more than two weeks, and the RSI has crossed below 70. Furthermore, the Stochastic oscillator is very close to making a bearish cross.

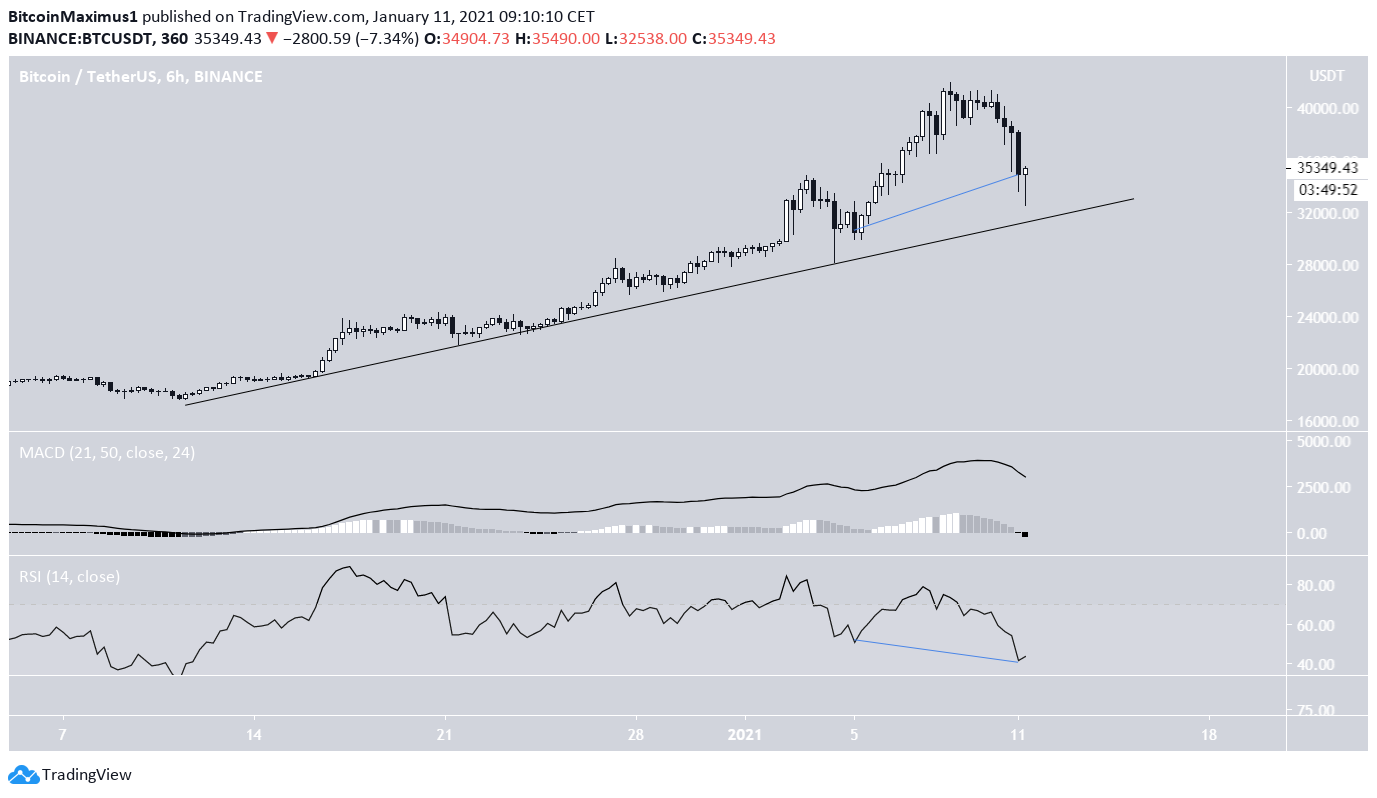
The six-hour chart is more bullish as it shows both an ascending support line and a hidden bullish divergence in the RSI.
Since the support line coincides with the previously mentioned $32,700 support area, a breakdown below it would be a strong bearish sign that could cause a drop towards $28,400.
However, as long as BTC is trading above both these support levels, the possibility of a reversal remains.

Future Movement
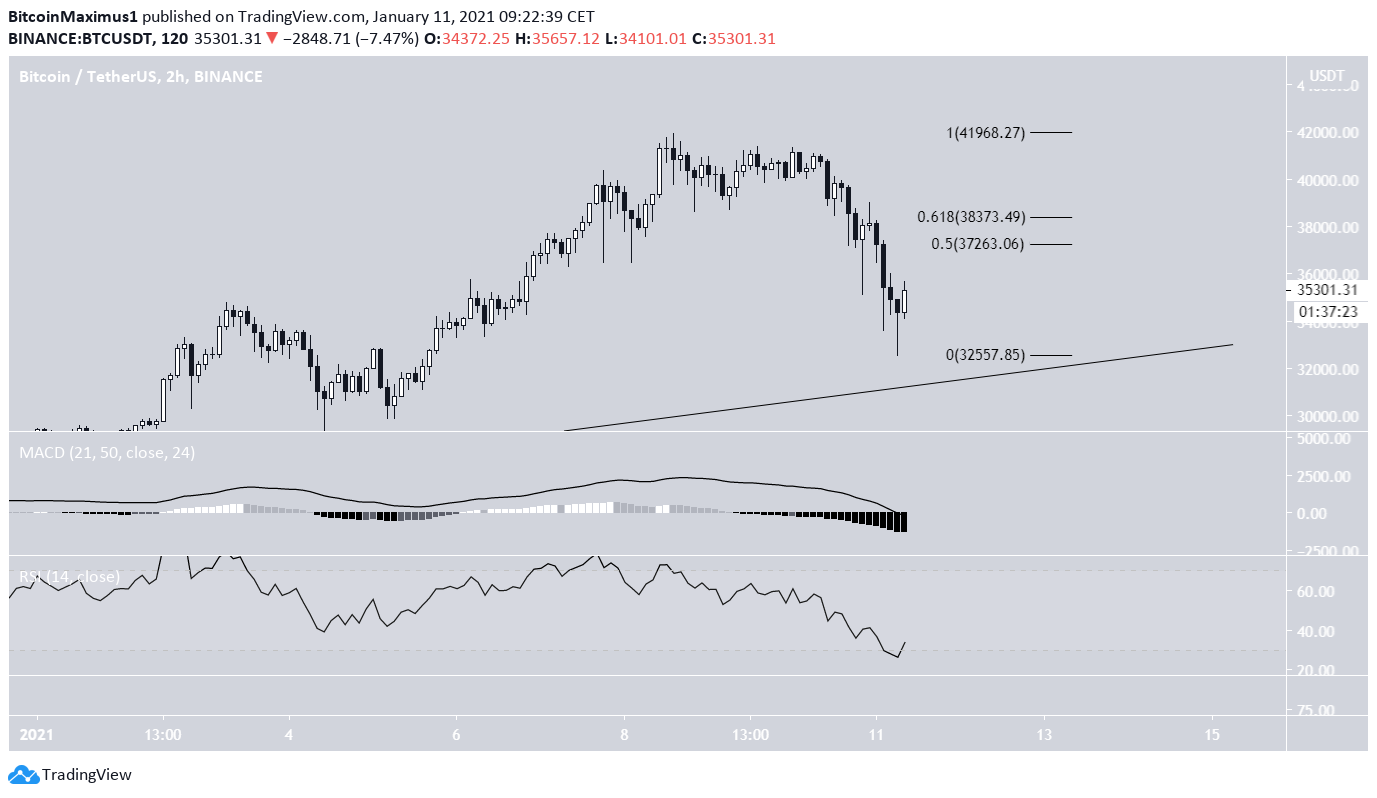
The two-hour chart shows that there are no signs of reversal yet, despite the two-hour RSI being oversold.
Until BTC manages to flip the 0.5 and 0.618 Fib retracement levels ($37,623 and $38,373 respectively), the trend cannot be considered bullish.

Conclusion
It’s possible that Bitcoin has begun a bearish trend that will take it back to $28,400.
The loss of the current ascending support line and the $33,400 area would likely confirm this while reclaiming the 0.618 Fib retracement level at $38,373 would invalidate this scenario.
For BeInCrypto’s previous Bitcoin (BTC) analysis, click here!
Disclaimer: Cryptocurrency trading carries a high level of risk and may not be suitable for all investors. The views expressed in this article do not reflect those of BeInCrypto.
The post Bitcoin (BTC) Drops 15% — Is the Bull-Run Over? appeared first on BeInCrypto.


![Decentraland: Review & Beginner's Guide [current_date format=Y] 28 Decentraland: Review & Beginner's Guide](https://cryptheory.org/wp-content/uploads/2020/11/decentraland-02-gID_7-300x150.jpg)