Bitcoin (BTC) Drops Back After Breaking Past $40,000
3 min readTable of Contents
The Bitcoin (BTC) price reached another all-time high on Jan. 7 but dropped sharply immediately after.
While it is possible that Bitcoin has reached its top, the correction will not be confirmed until BTC falls below $34,175.
Another Bitcoin All-Time High
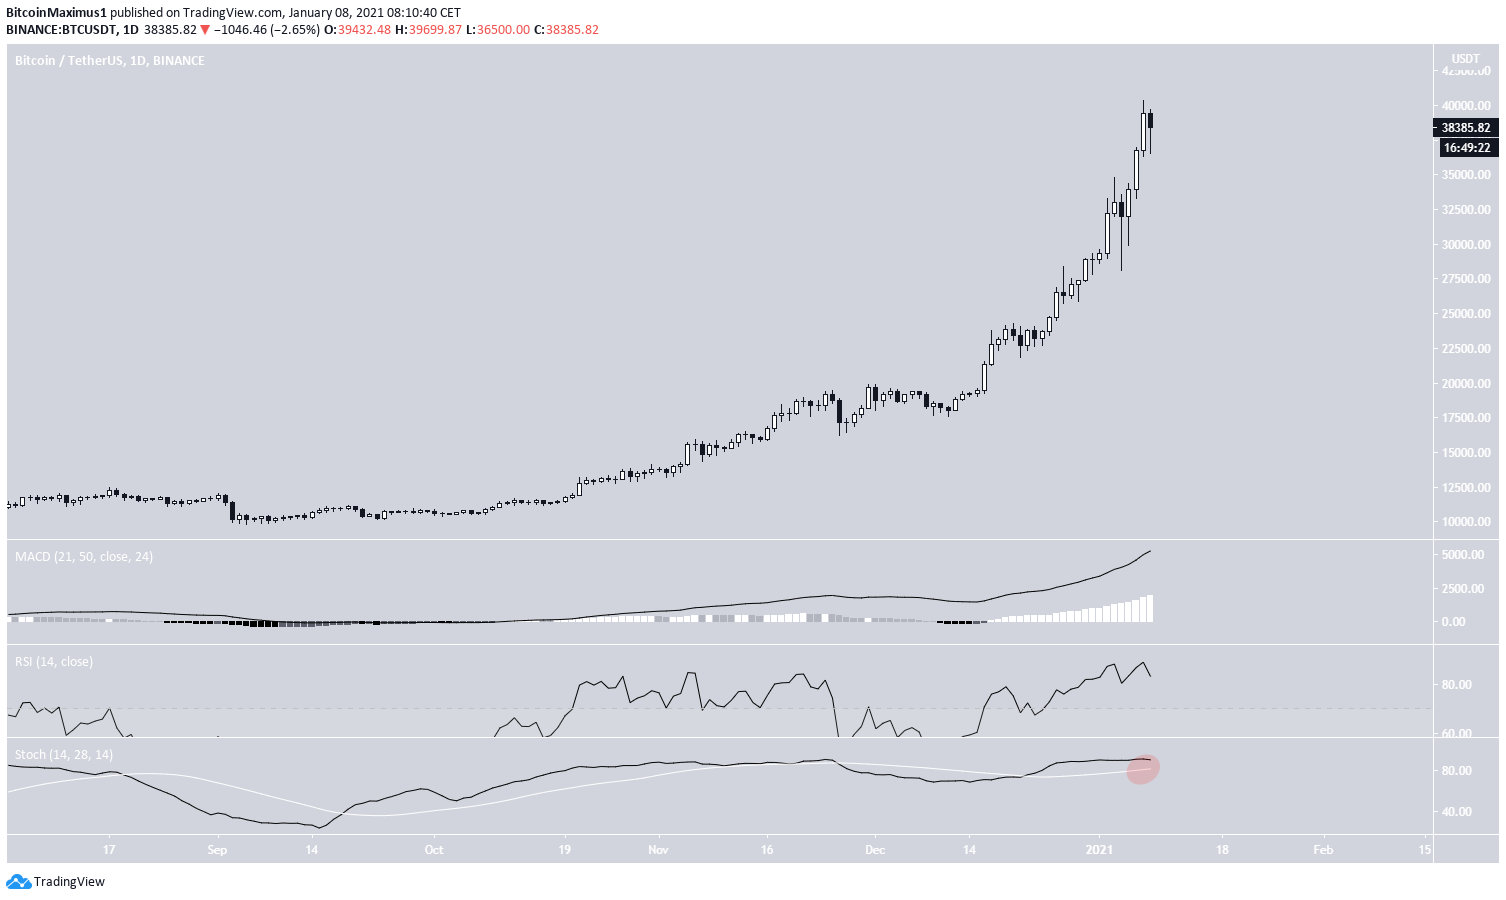
Bitcoin continued its ascent on Jan. 7, reaching a new all-time high of $40,365. However, a sharp drop followed almost immediately after, taking BTC to a low of $36,616 the next day. BTC has since recouped some of its losses.
Despite the drop, technical indicators do not yet show any significant weakness, except for the decreasing Stochastic oscillator (highlighted in red below).
Possible Weakness
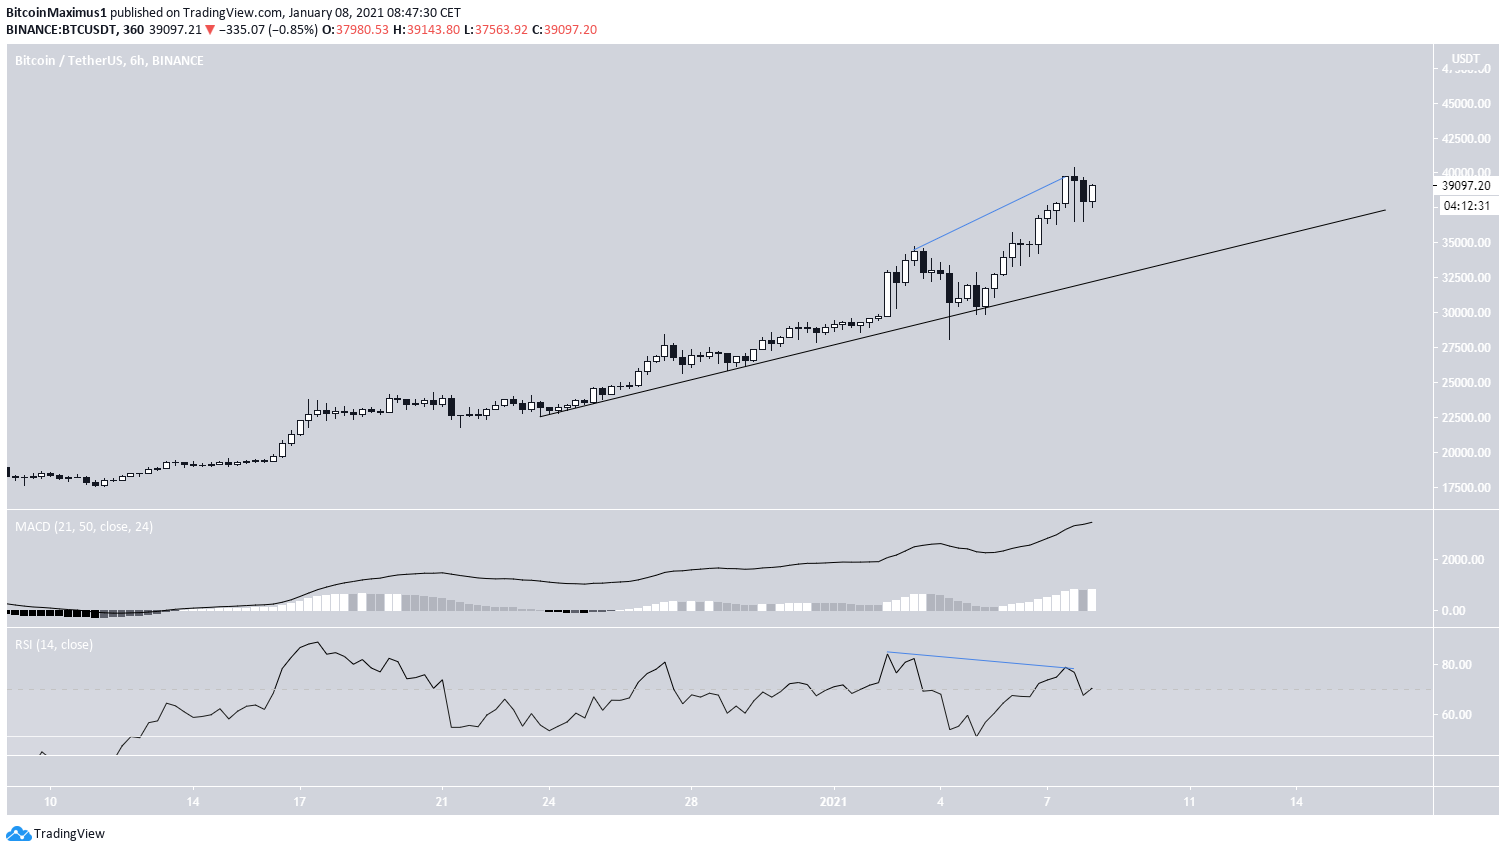
The six-hour time-frame shows the first signs of weakness in the form of a bearish divergence in the RSI. However, the MACD has not yet lost its strength.
Furthermore, BTC is following an ascending support line, which is currently near $34,000, so even a drop towards it would not break the current bullish structure.
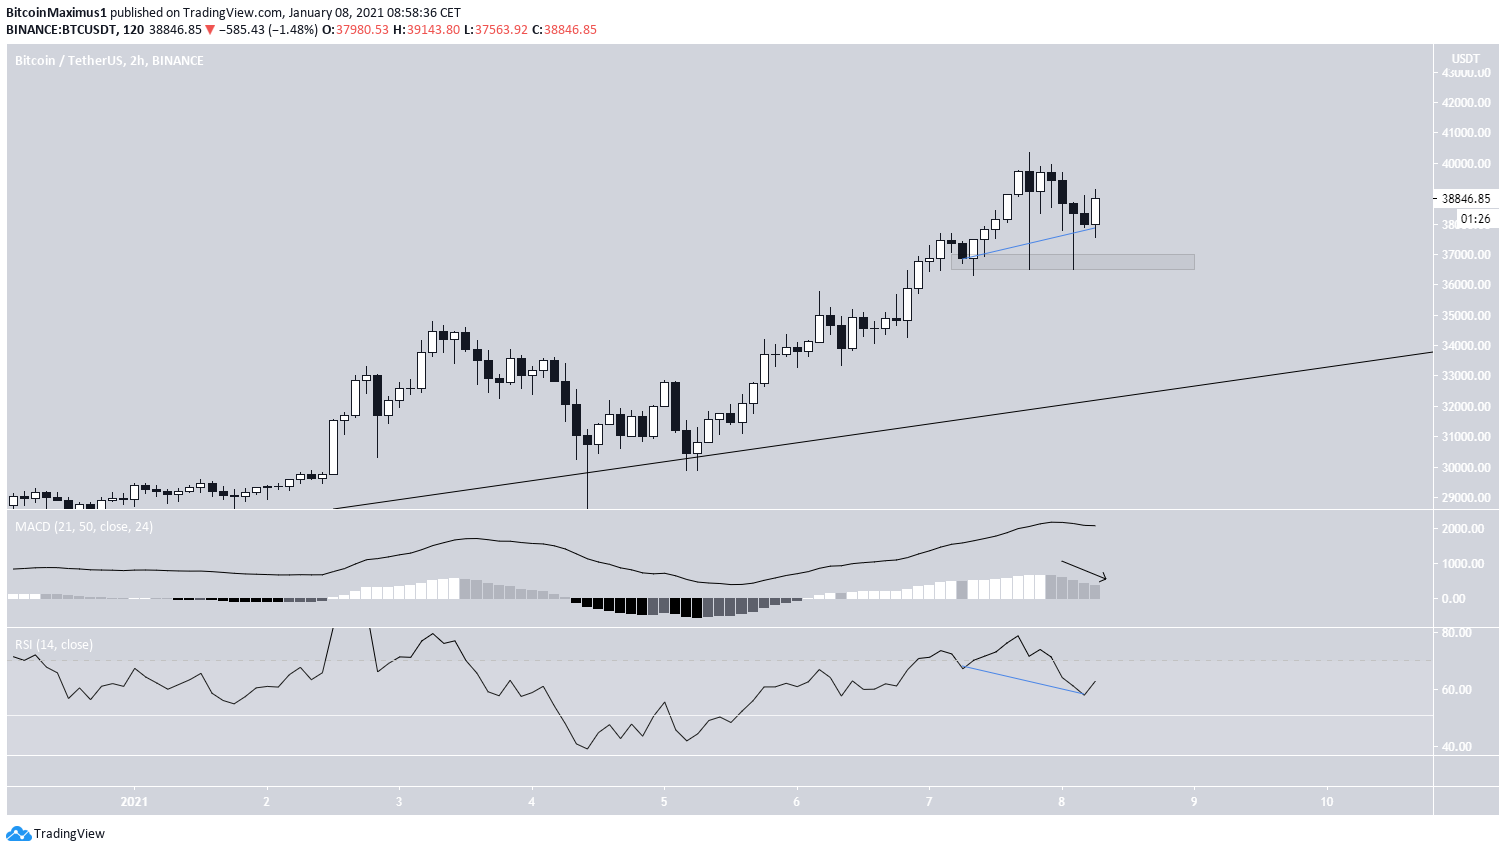
The two-hour chart shows conflicting signs.
BTC bounced at the minor $36,800 support area, creating several long lower wicks. In addition, it has generated some hidden bullish divergence.
However, the MACD has lost its strength, a sign of a weakening trend.
Nevertheless, the hidden divergences have been a strong sign of trend continuation throughout the upward move. There isn’t sufficient data to predict a bearish reversal, so we can assume that BTC will continue its upward move as long as it does not break down below the $36,800 support area.
BTC Wave Count
In yesterday’s BeInCrypto Bitcoin analysis, it was stated that:
“A likely target for the top of sub-wave 5 is located between $39,130-$39,170.”
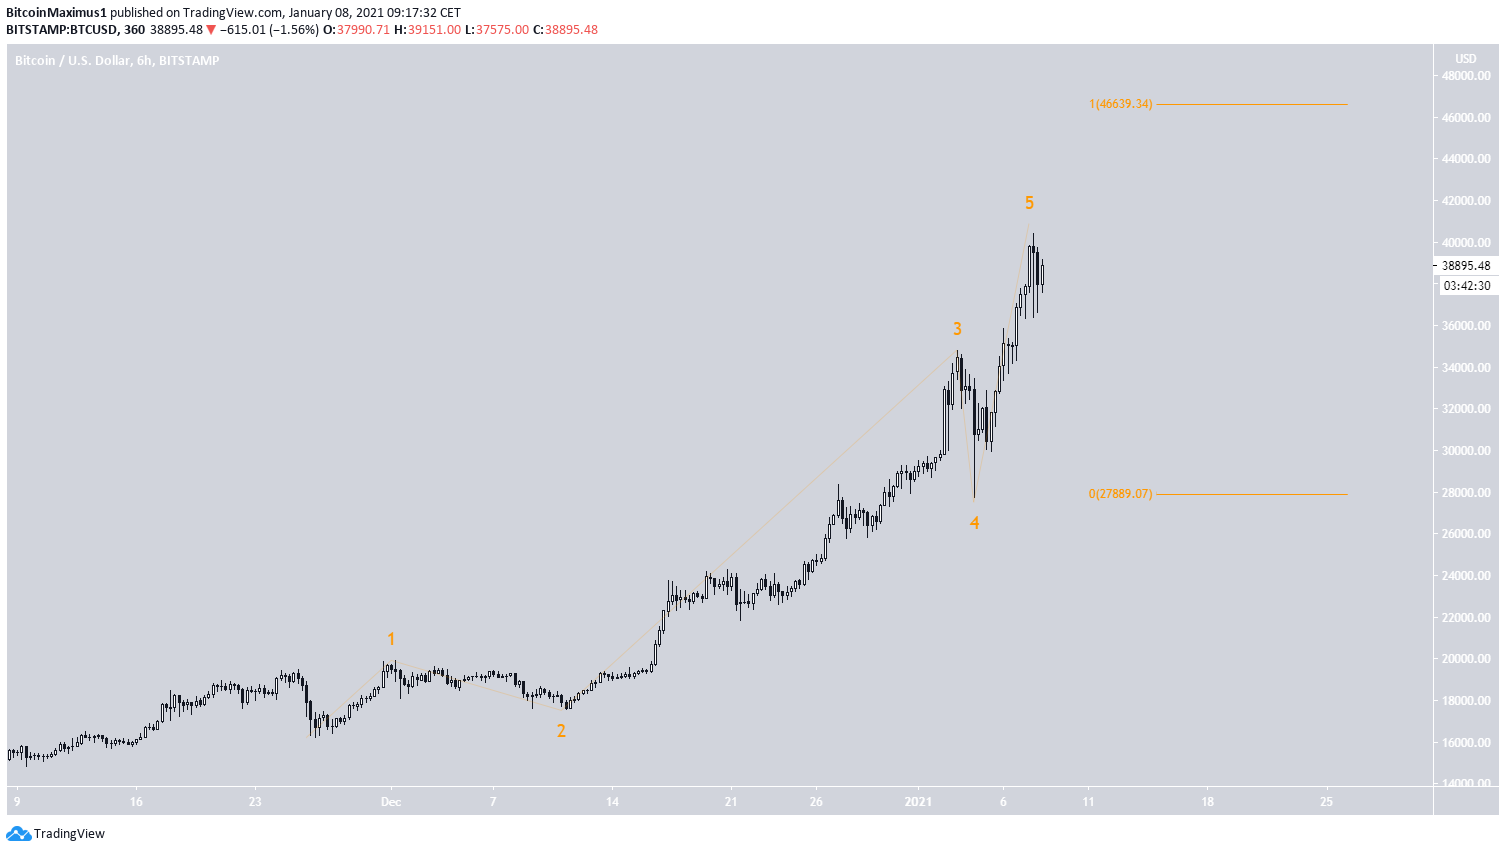
BTC reached the target yesterday, increasing just above it before the significant drop. Therefore, unless sub-wave 5 extends, BTC has already reached its top.
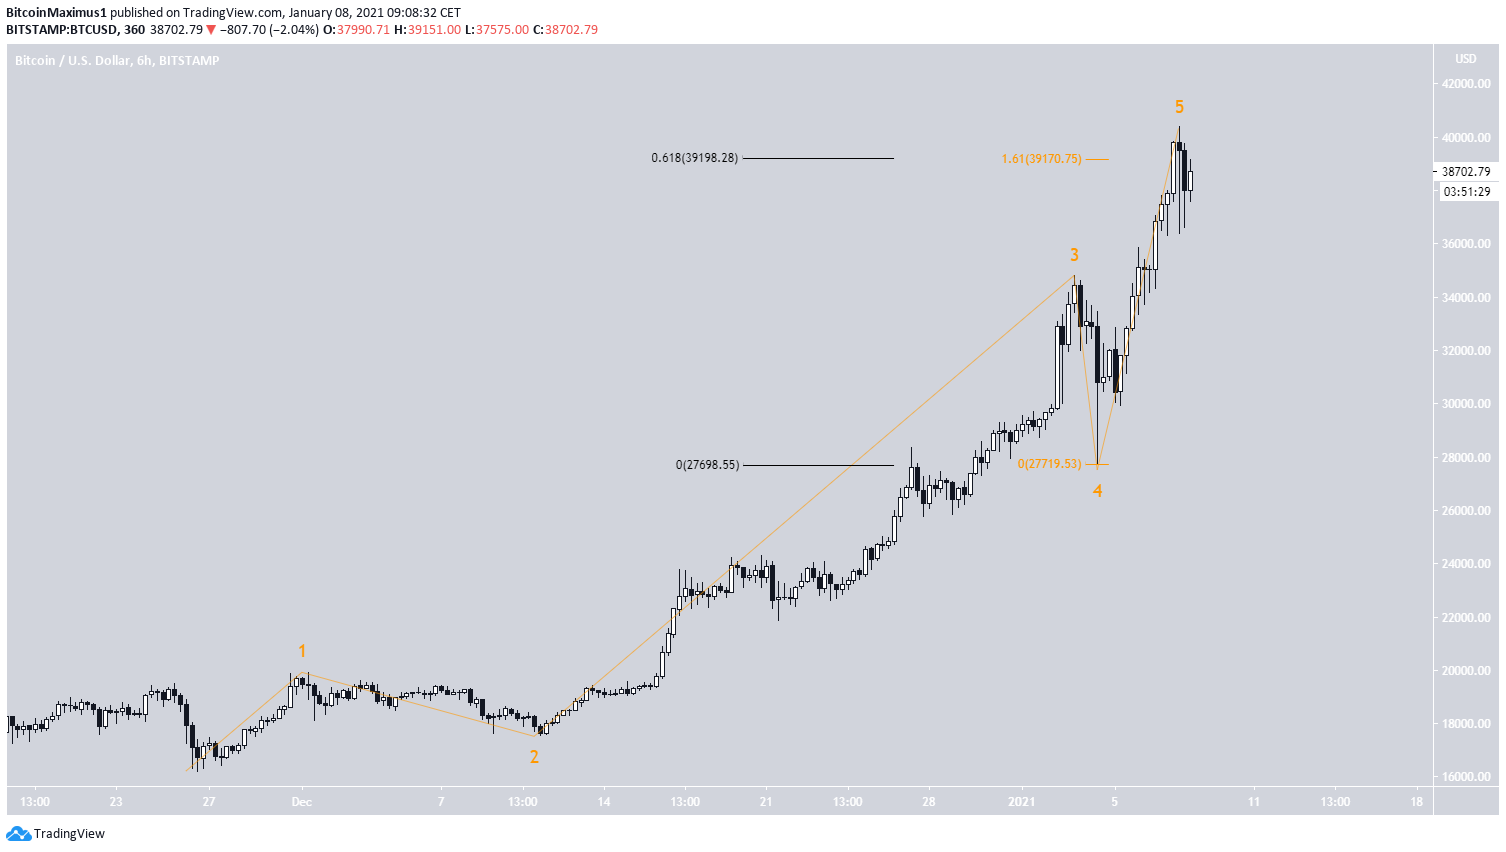
The minor sub-wave count for the move is given in black.
Yesterday’s drop caused a break in the 2-4 trendline, which is often a sign that the upward movement has ended.
However, in order for that to be confirmed, minor sub-wave 5 must completely retrace in less time than it took to form. Therefore, in order for the correction to be confirmed, BTC has to break down below $34,175 (red line) by midnight on Jan. 8.
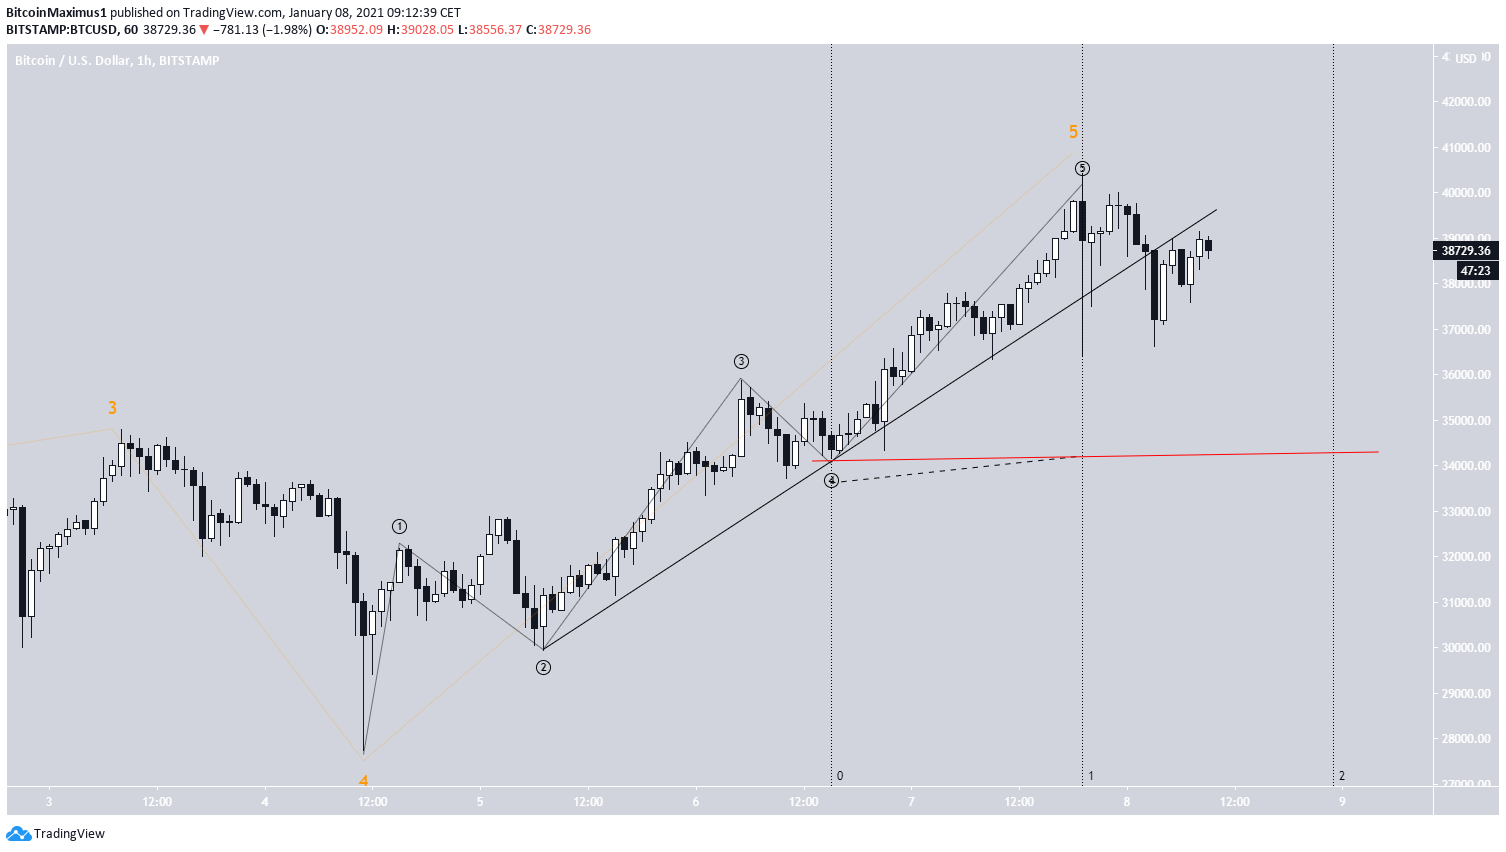
If BTC does not drop but continues to increase, it would mean that sub-wave 5 (orange) has extended, with the the next most likely target for the top being at $46,639.
Conclusion
While it is possible that Bitcoin has reached a top, the correction is not confirmed until BTC breaks down below $34,175.
For BeInCrypto’s previous Bitcoin (BTC) analysis, click here!
Disclaimer: Cryptocurrency trading carries a high level of risk and may not be suitable for all investors. The views expressed in this article do not reflect those of BeInCrypto.
The post Bitcoin (BTC) Drops Back After Breaking Past $40,000 appeared first on BeInCrypto.


![Decentraland: Review & Beginner's Guide [current_date format=Y] 34 Decentraland: Review & Beginner's Guide](https://cryptheory.org/wp-content/uploads/2020/11/decentraland-02-gID_7-300x150.jpg)