Bitcoin Continues Sideways Movement Inside Trading Range
2 min readThe Bitcoin (BTC) price is trading slightly above the support area of a trading range. As long as it can hold on above the level, the trend is considered bullish.
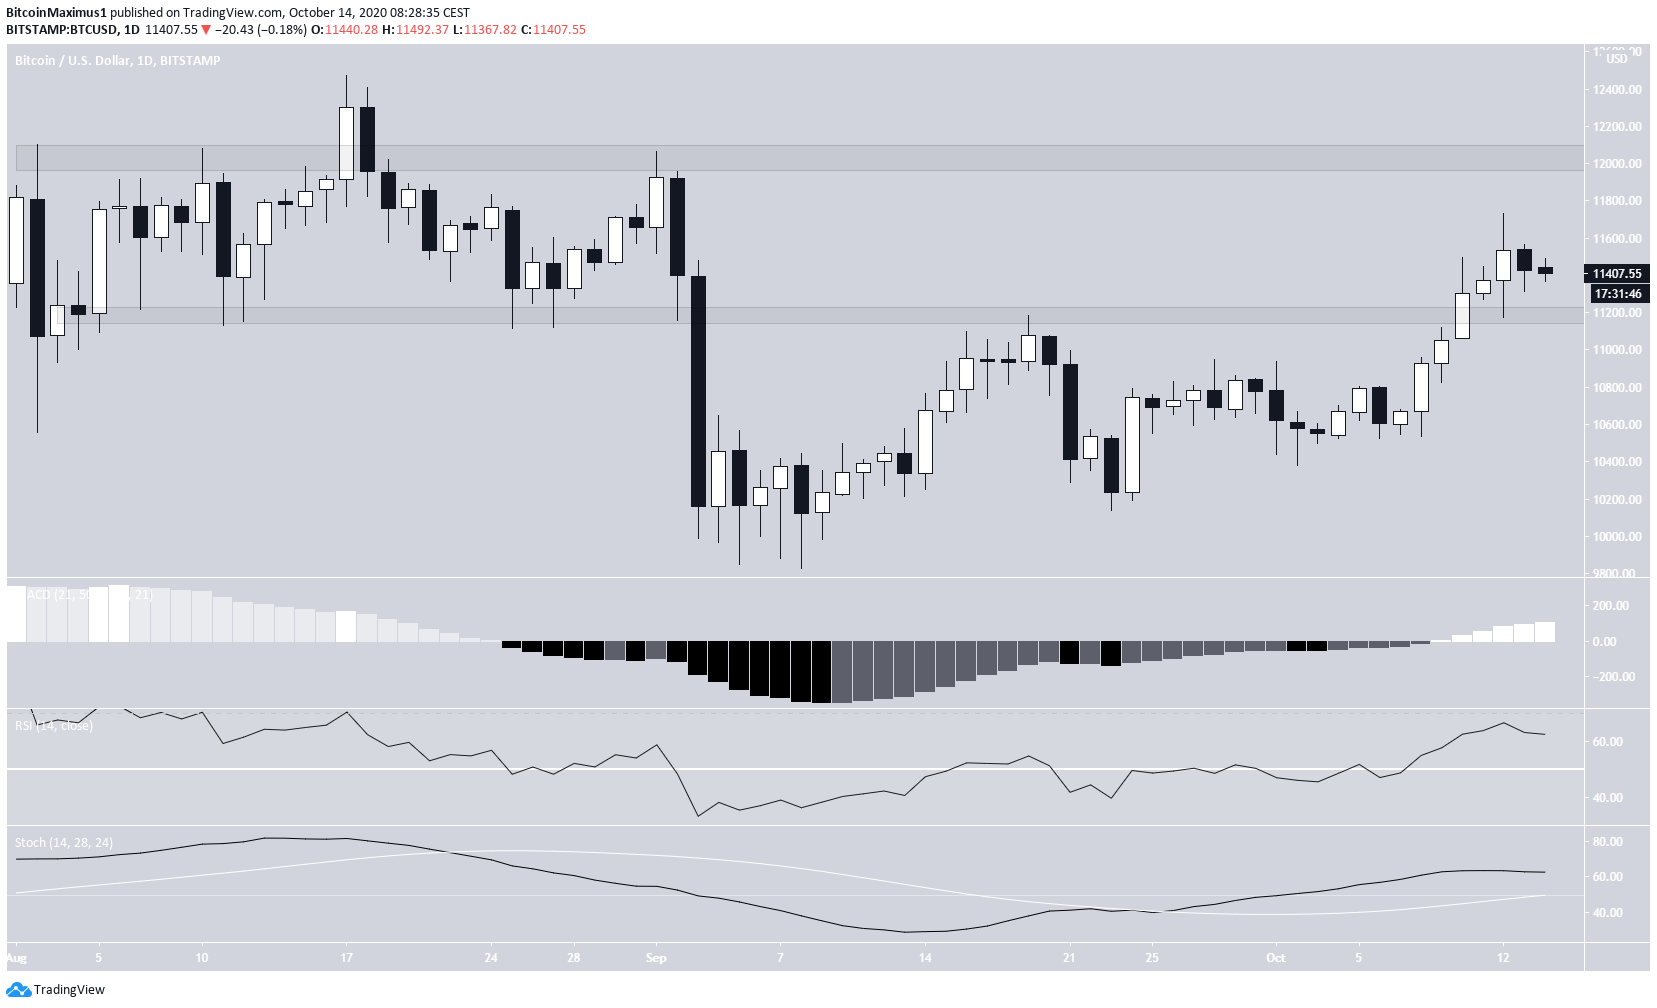
Bitcoin is trading in a range between $11,200 and $12,050. On Oct 12, BTC created a candlestick with long wicks on each side, with the lower wick serving to validate the $11,200 area as support.
BullishBitcoin Trading Range
While the price decreased slightly yesterday, it failed to reach a close below the prior day’s opening and is still trading considerably above the $11,200 area.
Technical indicators in the daily time-frame are bullish. The MACD, RSI, and Stochastic Oscillator are all increasing. The RSI and Stochastic Oscillator are above 50 and the MACD is positive.

Short-Term Decrease
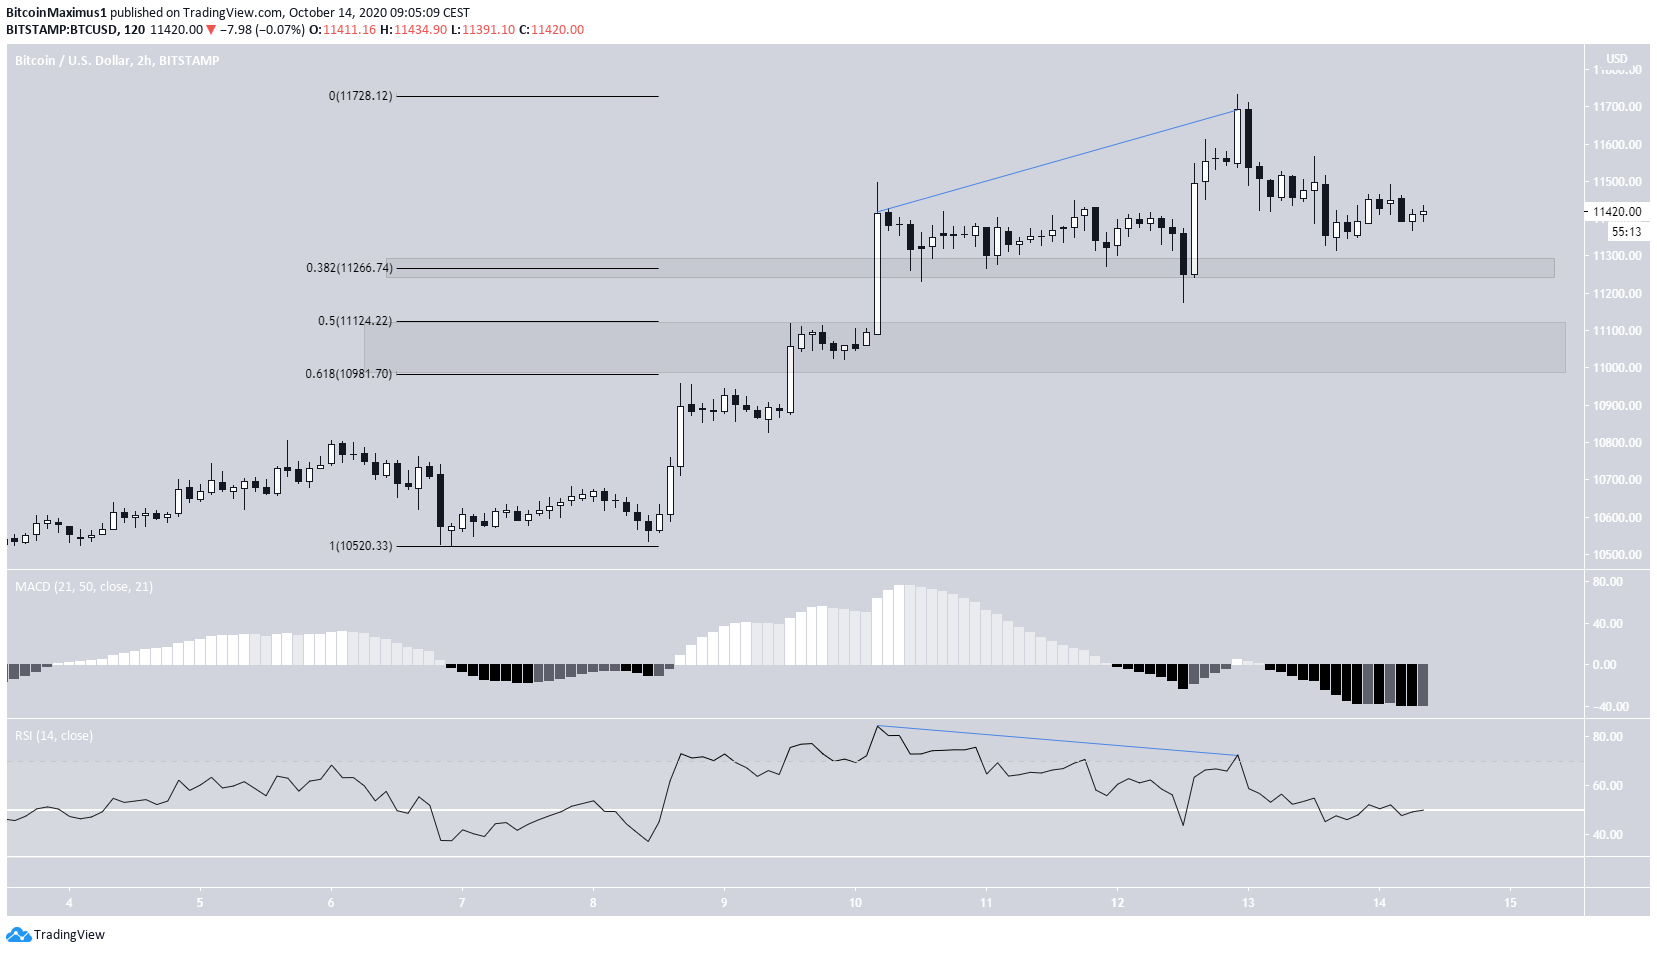
The 2-hour chart for BTC shows that the price generated a significant bearish divergence on Oct 12 once it reached a high of $11,731. What ensued was a decrease that nearly validated the 0.382 Fib level of the upward move at $11,266.
The $11,266 level is a minor support area. A breakdown from there would likely trigger a drop towards the 0.5-0.618 Fib levels between $10,981 and $11,124.
However, the MACD has started to pick up, suggesting that the price is possibly gearing up for a continuation of the upward movement.

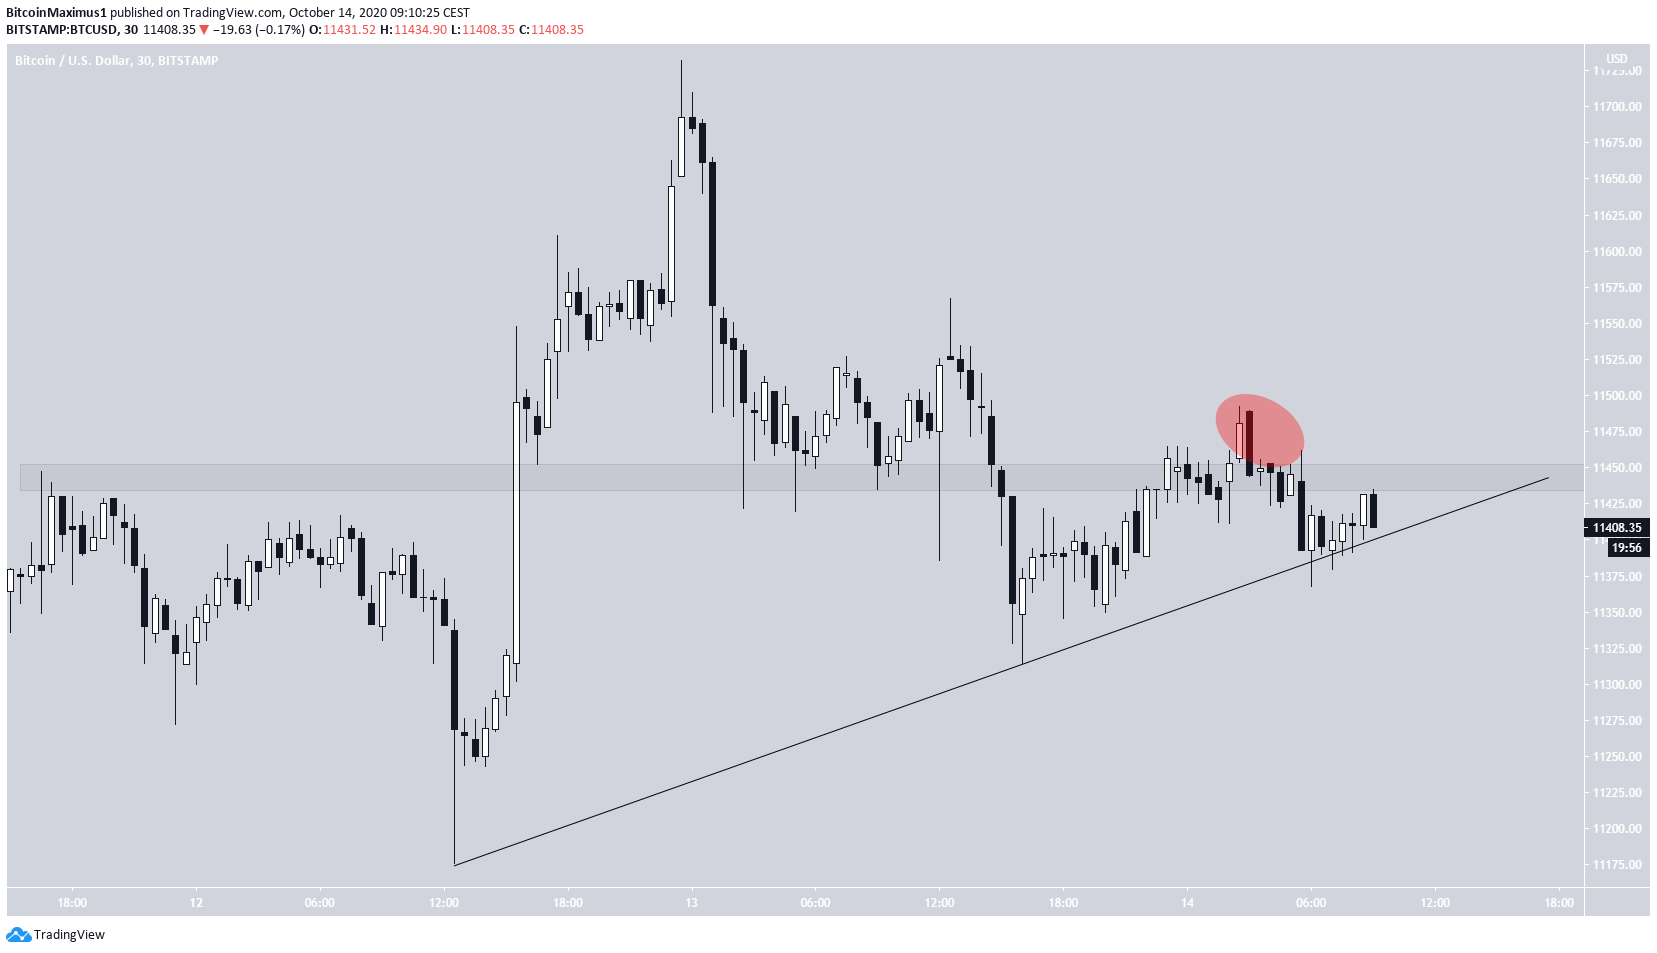
The shorter-term 30-minute chart shows the importance of the $11,450 area, which has intermittently acted as resistance and support since Oct 11.
This morning, the price deviated above the area before falling back below. The area is now expected to act as resistance.
If the price breaks down from the current ascending support line, it is likely to validate the $11,266 minor support area once more and possibly drop to the 0.5-0.618 Fib levels.
A breakout and validation of the $11,450 area as support would indicate that the price should go even higher.

Wave Count
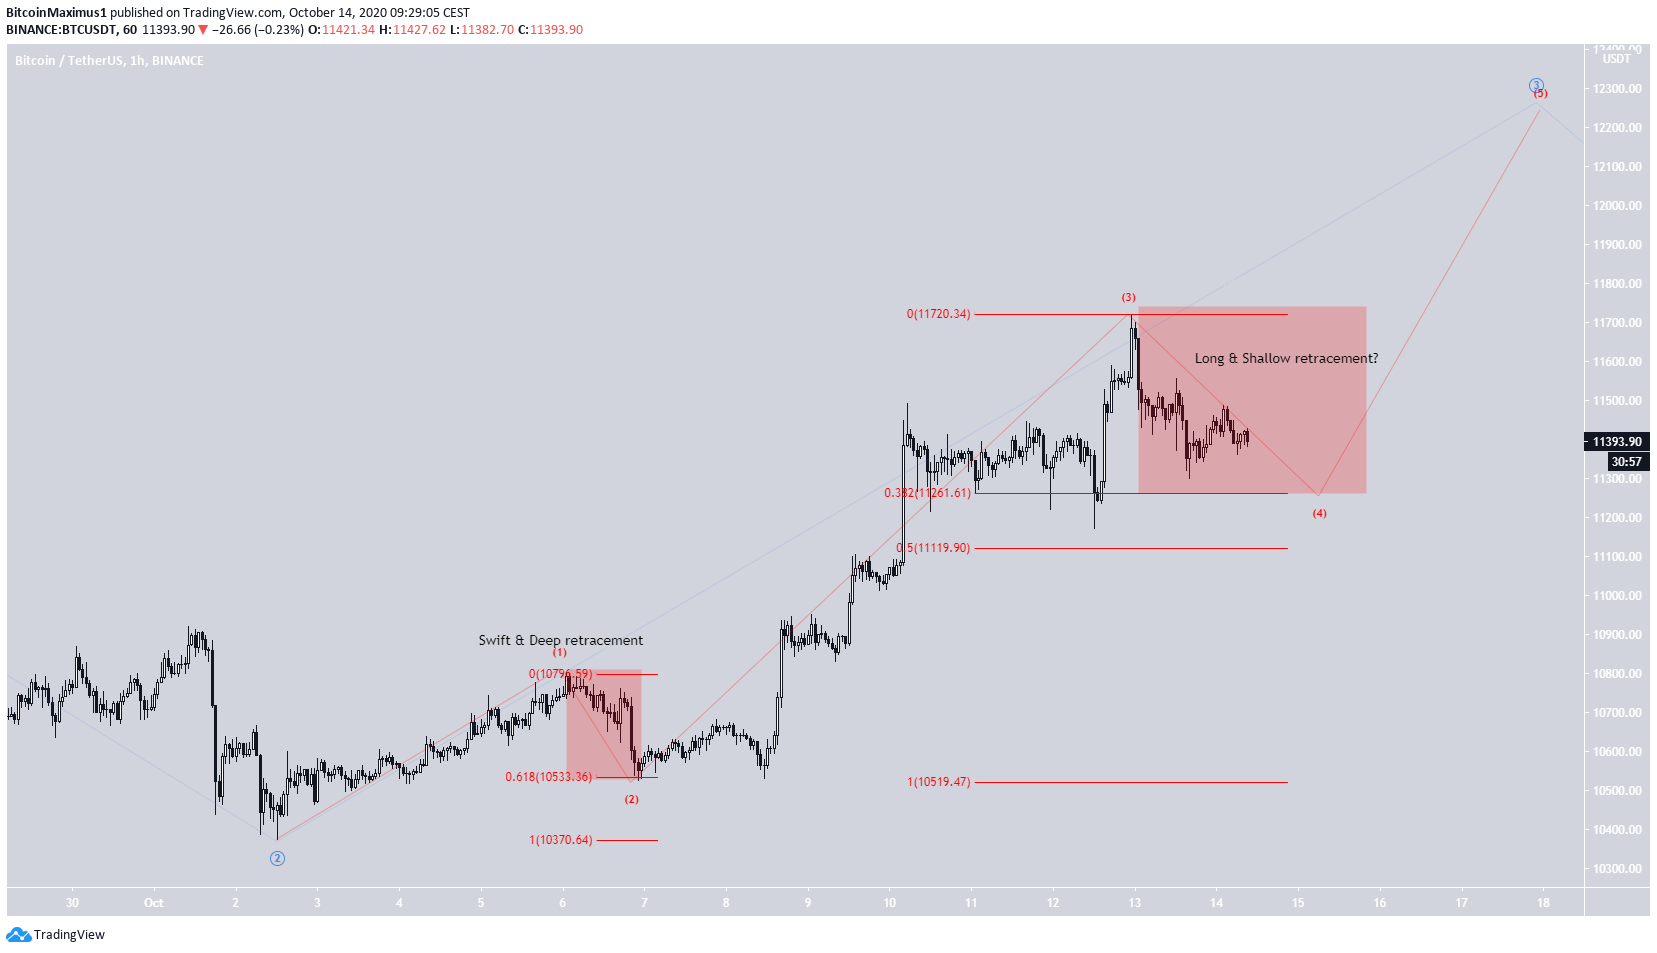
As stated in BeInCrypto’s BTC analysis from Oct 13, the price has likely begun a bullish impulse and is currently in wave 3 (shown in blue below).
Inside it, the price has completed sub-waves 1-3 and is currently in sub-wave 4, which is corrective (red).
Sub-wave 2 was a swift and deep retracement, reaching the 0.618 Fib levels. Because of alternation, sub-wave 4 is expected to be long and shallow, possibly ending near the 0.382 Fib level at $12,261. Afterward, the price is expected to resume its upward movement.
A decrease below the sub-wave1 high at $10,745 would invalidate this particular wave count.

To conclude, Bitcoin is expected to retrace in the short-term before resuming its upward movement.
For BeInCrypto’s previous Bitcoin analysis, click here!
Disclaimer: Cryptocurrency trading carries a high level of risk and may not be suitable for all investors. The views expressed in this article do not reflect those of BeInCrypto.
The post Bitcoin Continues Sideways Movement Inside Trading Range appeared first on BeInCrypto.


![Decentraland: Review & Beginner's Guide [current_date format=Y] 29 Decentraland: Review & Beginner's Guide](https://cryptheory.org/wp-content/uploads/2020/11/decentraland-02-gID_7-300x150.jpg)