Bitcoin Reaches Second-Highest Monthly Close in History
2 min readTable of Contents
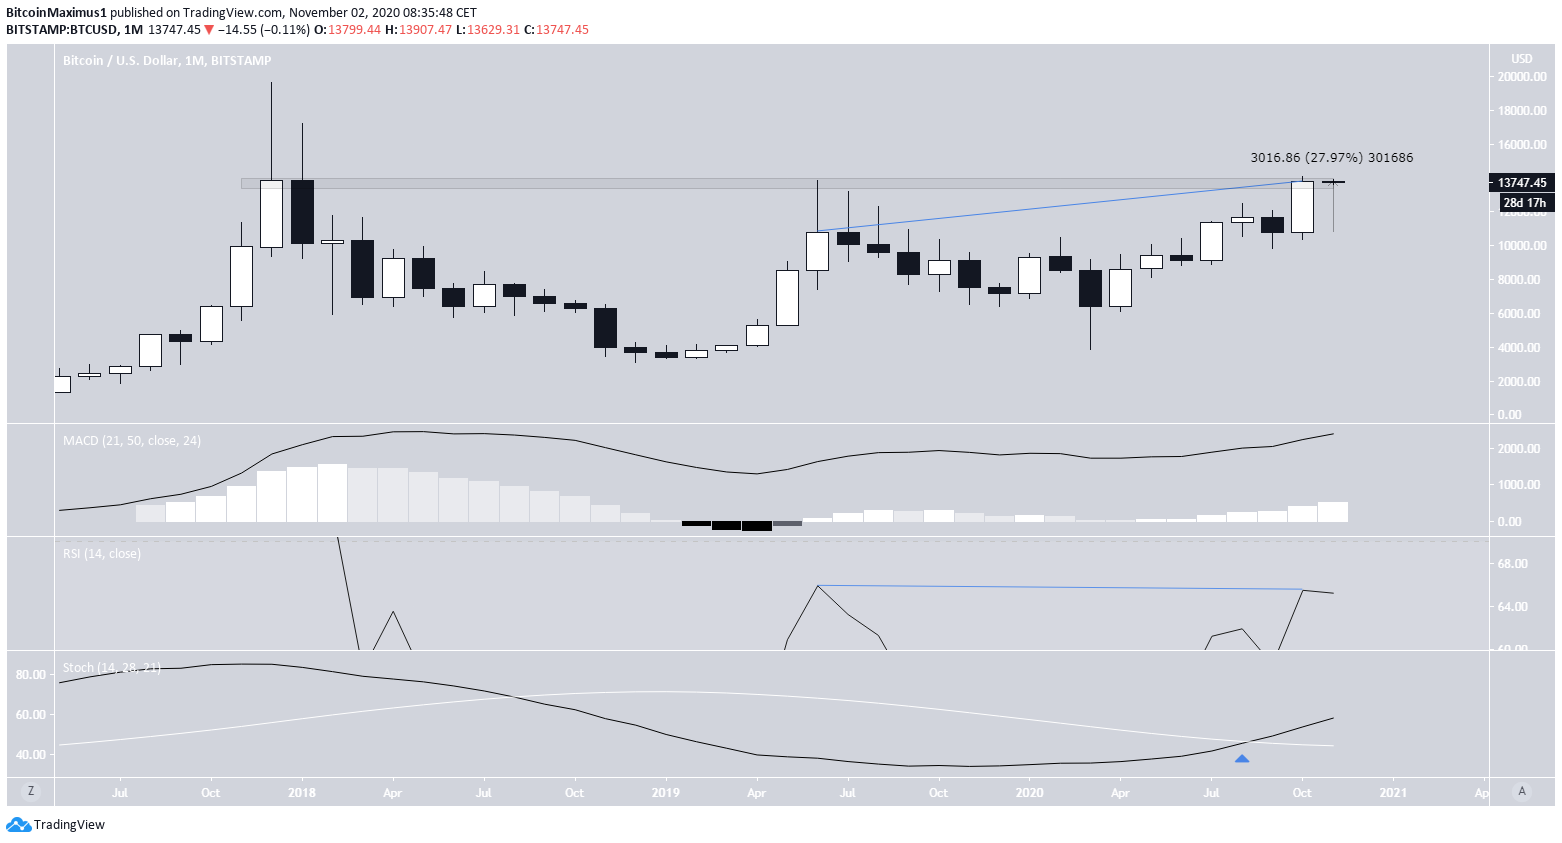
In the month of October 2020, the Bitcoin price increased by 28%, barely failing to reach its highest monthly close of all-time from January 2018 by less than $100.
Despite this increase, there are signs of weakness developing in the medium-term charts.
Bitcoin’s Monthly Close
The month of October was bullish for Bitcoin. BTC created a bullish engulfing candlestick and reached a high of $14,100 before dropping slightly to close at $13,816.
Despite the considerable increase, BTC is still trading inside the long-term resistance area of $13,800, created by the close of January 2018 and the highs of July 2019.
Technical indicators are mostly bullish since both the MACD and Stochastic oscillator are increasing and the latter has made a bullish cross. However, there is some weakness present in the form of a slight bearish divergence in the RSI.

Weekly Time-Frame Appears Bullish
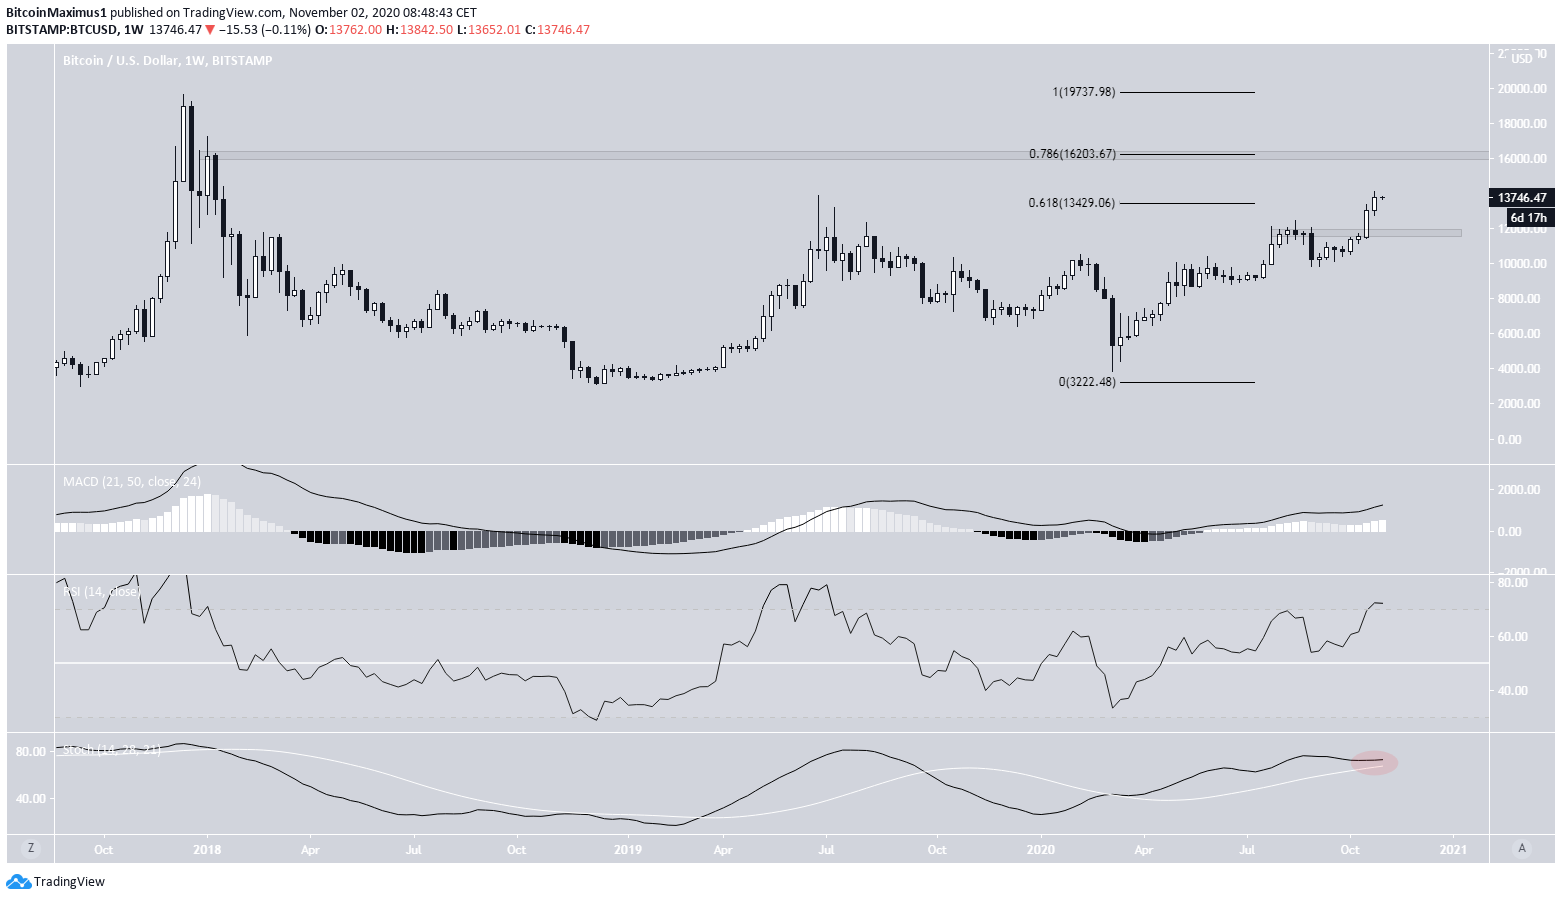
The weekly time-frame shows that the price has already moved above the 0.618 Fib level of the entire decrease stemming from the 2017 all-time highs. The next significant resistance level is found at $16,203, the 0.786 Fib level of the same decrease, while the closest support is found near $12,000.
Technical indicators are bullish considering the RSI, MACD, and Stochastic oscillator are increasing, even if the latter’s slope has straightened, indicating a loss of strength for buyers. There is no bearish divergence present in any of these indicators.

A Possible Retracement Scenario
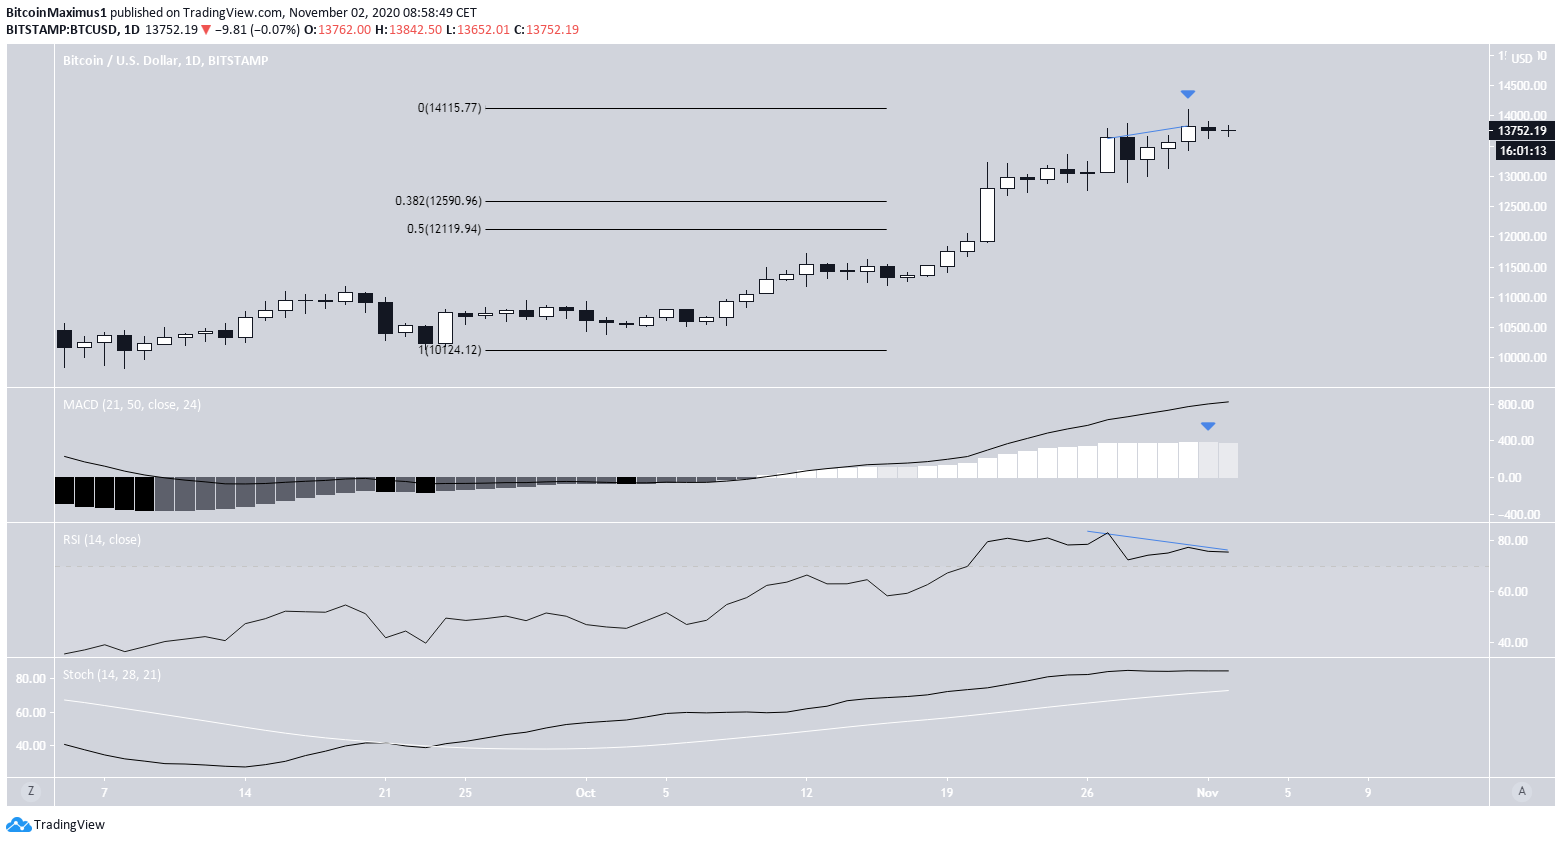
The daily chart shows a more pronounced weakness as the daily RSI has generated significant bearish divergence inside the overbought area. Furthermore, the MACD has generated its first lower bar, even if the signal line is considerably above 0.
Therefore, it would make sense for some sort of retracement to occur before the price eventually resumes its upward movement. If the price were to retrace, the closest support levels would be found near the range of $12,600-$12,100, the 0.382-0.5 Fib levels of the entire upward move.

Conclusion
To conclude, while the longer-term monthly and weekly charts look bullish for Bitcoin, there are signs of weakness warning of a possible retracement.
Since the price is trading inside a long-term resistance level, it would make sense for the price to retrace towards the mid-$12,000s before eventually resuming its upward movement.
For BeInCrypto’s previous Bitcoin analysis, click here!
Disclaimer: Cryptocurrency trading carries a high level of risk and may not be suitable for all investors. The views expressed in this article do not reflect those of BeInCrypto.
The post Bitcoin Reaches Second-Highest Monthly Close in History appeared first on BeInCrypto.


![Decentraland: Review & Beginner's Guide [current_date format=Y] 25 Decentraland: Review & Beginner's Guide](https://cryptheory.org/wp-content/uploads/2020/11/decentraland-02-gID_7-300x150.jpg)