Bitcoin Still Hunting for a Bottom After Losing Support
2 min readTable of Contents
The Bitcoin (BTC) price has continued its descent after breaking down from a parabolic ascending support line.
The downward move is expected to continue until Bitcoin reaches at least one of the key support levels outlined below.
Support Levels For Bitcoin
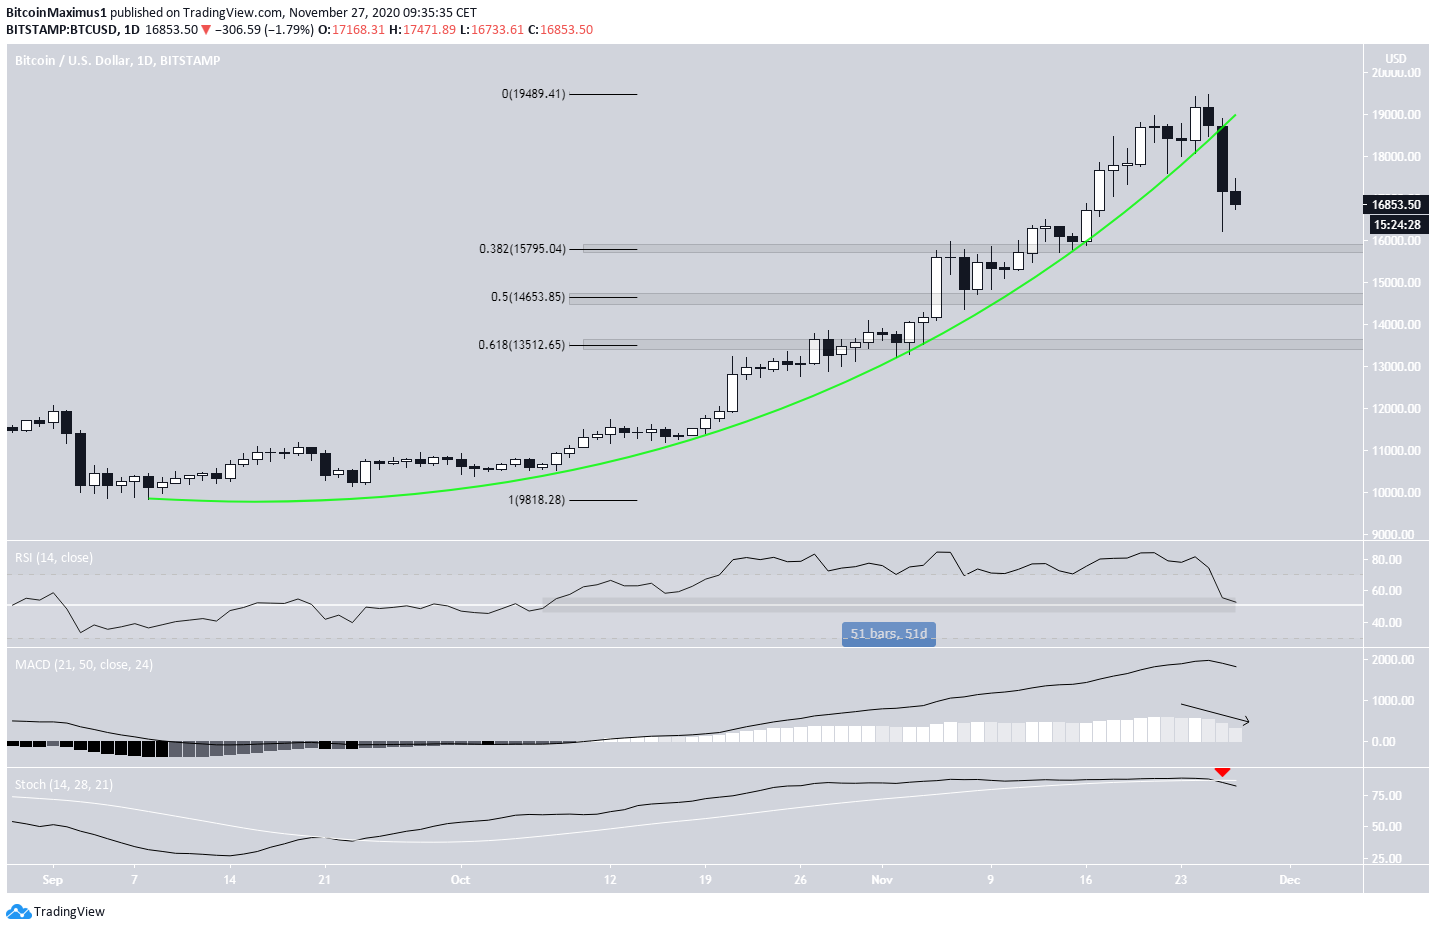
On Nov. 27, BTC created a massive bearish candlestick, dropping from a high of $18,911 to a low of $16,218. The decrease caused a decisive breakdown from a parabolic ascending support line that the price had been following since the beginning of September.
Technical indicators have turned bearish. The Stochastic oscillator has made a bearish cross (shown with the red arrow below) and both the RSI and MACD are decreasing.
Interestingly, the RSI is in the process of decreasing below 50, something it has not done for 51 days. This is a bearish signal that could indicate that the trend is reversing, especially in combination with other bearish readings.
The three closest support levels are found at $15,800, $14,650, and $13,500 (0.382, 0.5 & 0.618 Fib retracement levels).
Each of these also present as horizontal support levels in addition to being important Fib retracement levels.

Bounce and Rejection
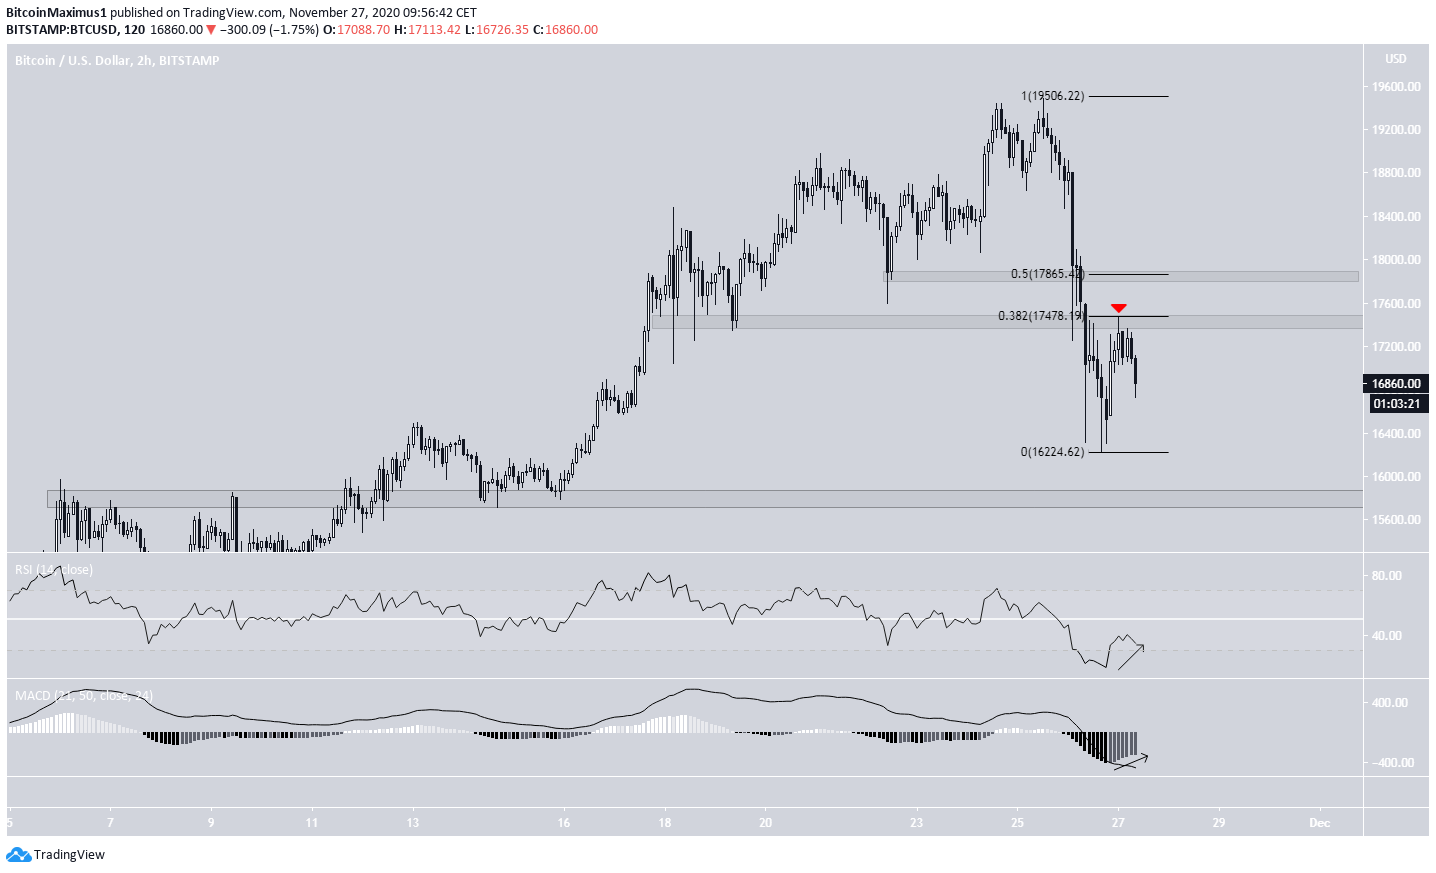
The two-hour chart shows that the price has bounced and made an attempt at moving upwards, but was rejected by the support area turned to resistance at $17,470. The area is also the 0.382 Fib retracement level of the entire decrease.
Technical indicators have begun to show signs of reversal, as both the MACD and RSI have begun to increase, but have not confirmed the trend reversal yet.
Even if the price were to break out above the current resistance area, it would face strong resistance at the 0.5 Fib retracement level of $17,865.
Therefore, until the price is successful in flipping both these levels, we cannot consider the price movement bullish — at least not in the short-term.

Wave Count
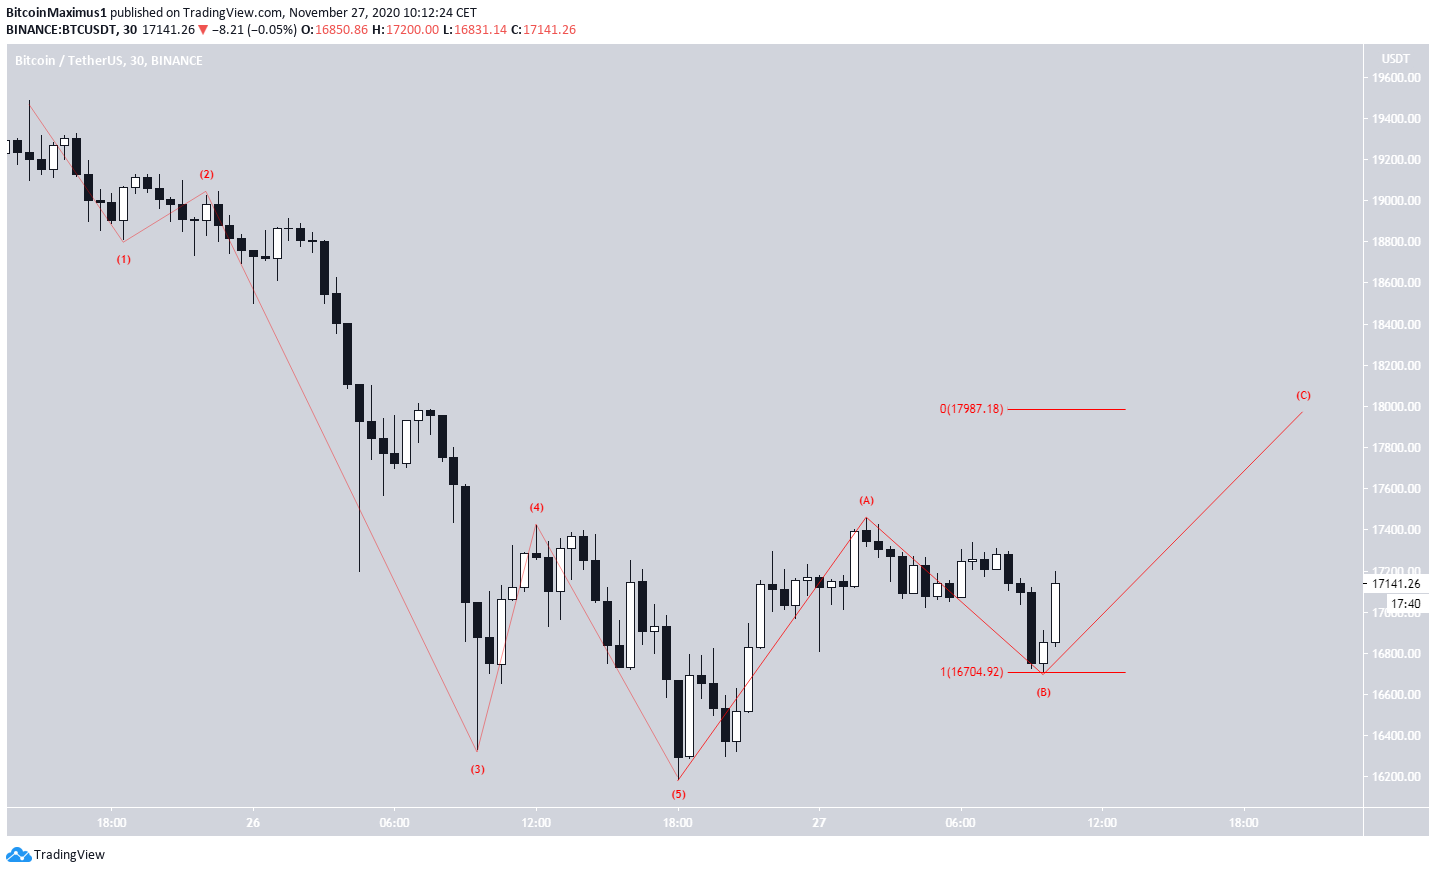
The wave count for Bitcoin suggests that the price has already completed a bearish impulse (red) and has now begun a corrective A-B-C structure. The correction could take BTC above the first resistance area at $17,470 and towards the second at $17,865.
An increase in which the A:C waves have a 1:1 ratio would take BTC to $17,987.
However, a decrease afterward would be the most likely scenario, unless BTC manages to consolidate above $17,865.

For the longer-term wave count, click here.
Conclusion
To conclude, the BTC price is expected to increase in the short-term, possibly towards $17,850-$18,000. However, unless the price manages to reclaim the level as support, another move to the downside would be expected to follow.
For BeInCrypto’s previous Bitcoin analysis, click here!
Disclaimer: Cryptocurrency trading carries a high level of risk and may not be suitable for all investors. The views expressed in this article do not reflect those of BeInCrypto
The post Bitcoin Still Hunting for a Bottom After Losing Support appeared first on BeInCrypto.


![Decentraland: Review & Beginner's Guide [current_date format=Y] 26 Decentraland: Review & Beginner's Guide](https://cryptheory.org/wp-content/uploads/2020/11/decentraland-02-gID_7-300x150.jpg)