Bitcoin Targets $17,000 After Achieving Highest Daily Close in 2020
2 min readTable of Contents
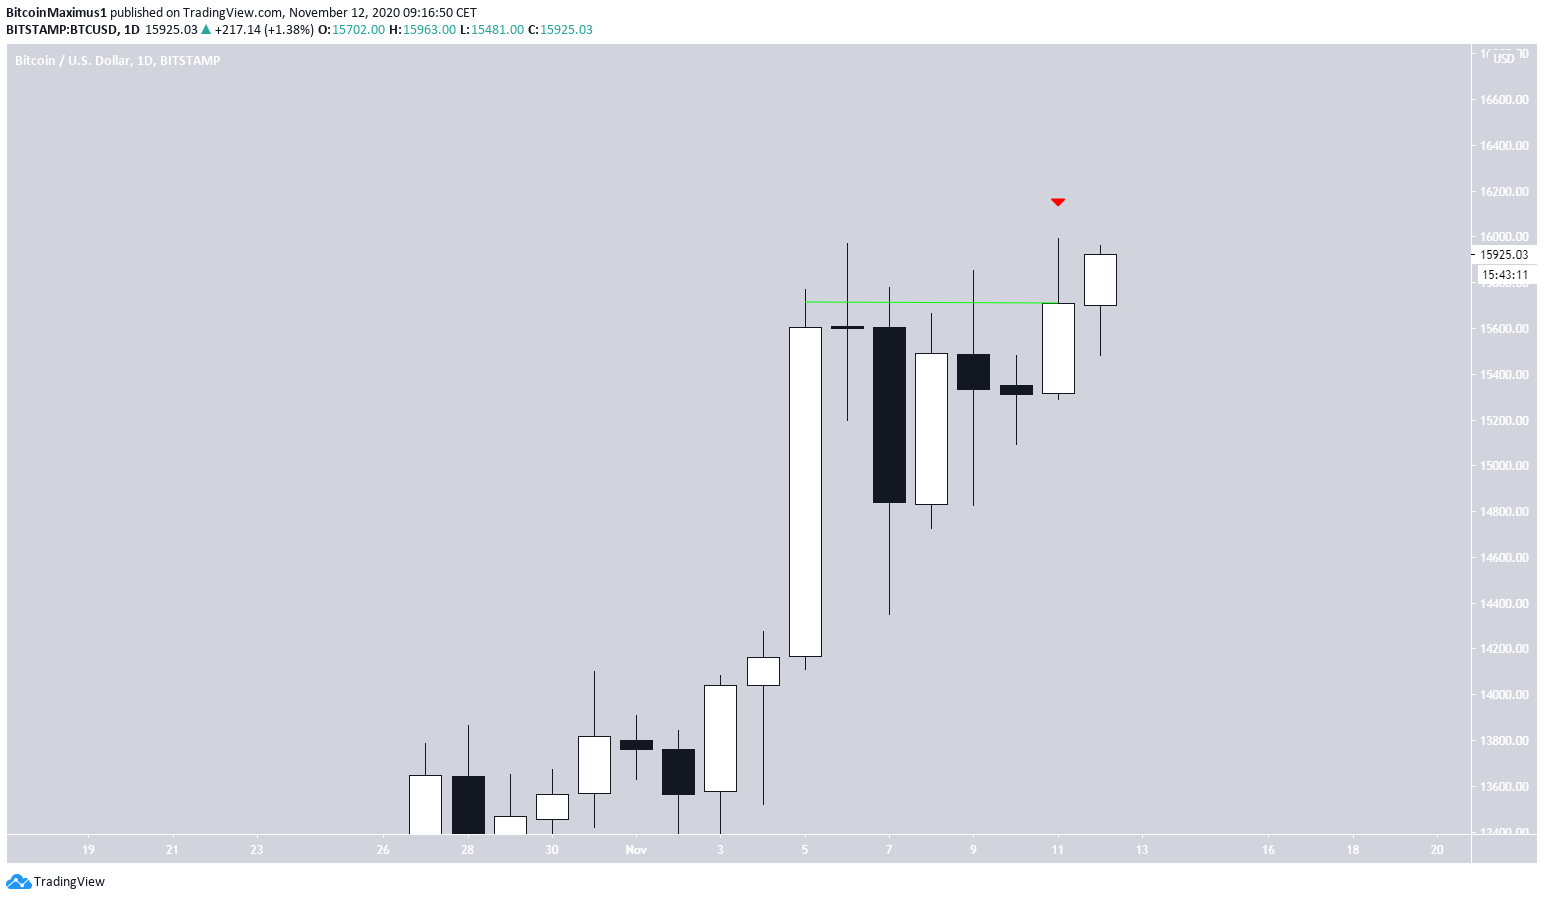
Bitcoin (BTC) reached a daily close of $15,707 on Nov 11, marking the highest daily close so far in 2020.
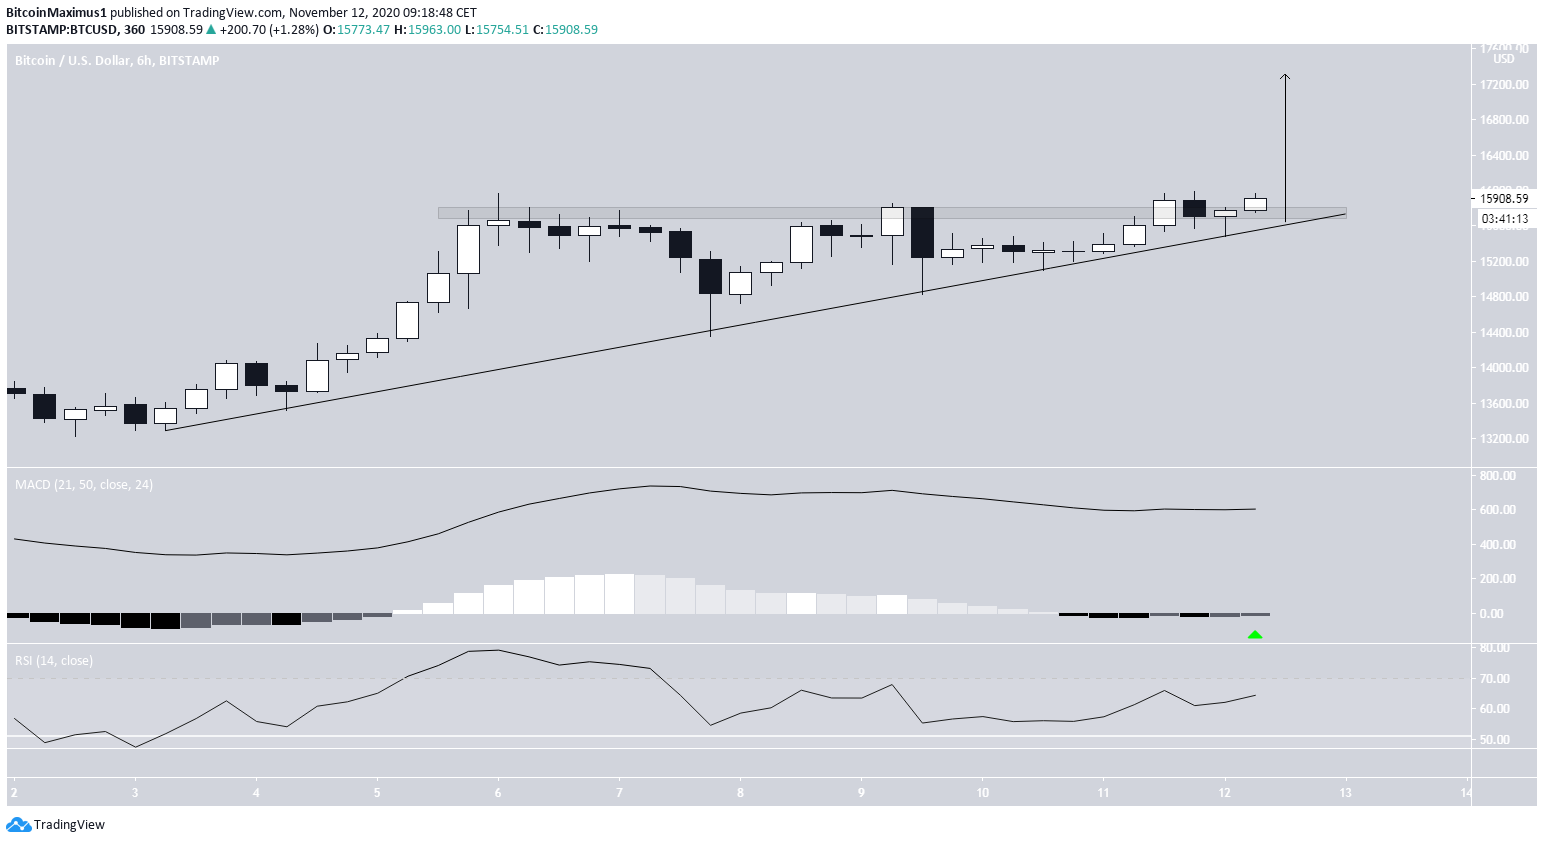
The price is currently making an attempt at breaking out from an ascending triangle, which is expected to be successful and could take the price towards the next resistance at $17,000.
Bitcoin Hits Highest 2020 Daily Close
On Nov 12, the Bitcoin price resumed its upward movement and reached a high of $15,991.
Even though BTC fell back to $15,707, leaving an upper wick in its wake, it still closed higher than the previous 2020 high of $15,610 on Nov 6.
BTC has continued its ascent today and is currently trading just above $15,900.
Ongoing Breakout
The shorter-term six-hour chart shows that the price is in the process of breaking out from the $15,800 horizontal resistance area and an ascending triangle that it has been trading in since Nov 3.
Technical indicators are bullish since the RSI is above 50. To supplement this, the MACD line is above 0 and the MACD histogram is in the process of turning positive.
A breakout that travels the entire height of the pattern would take the price towards $17,200.
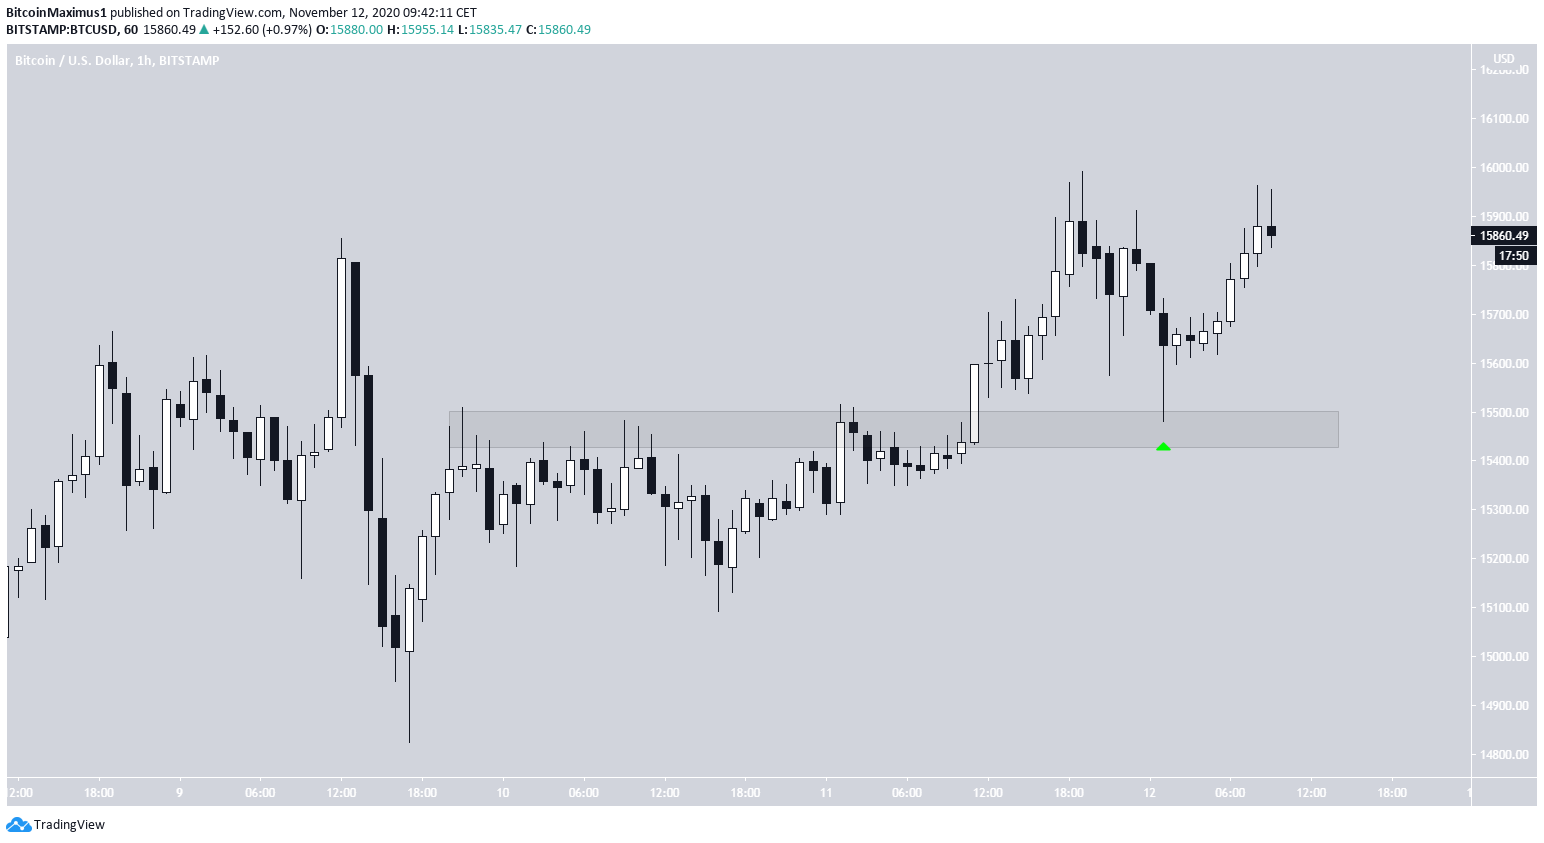
The one-hour chart shows the significant strength of the buyers, which was visible in the long lower wick that was created as soon as the price touched the previous resistance area at $15,500. This level has now turned into support.
Long-Term Resistance
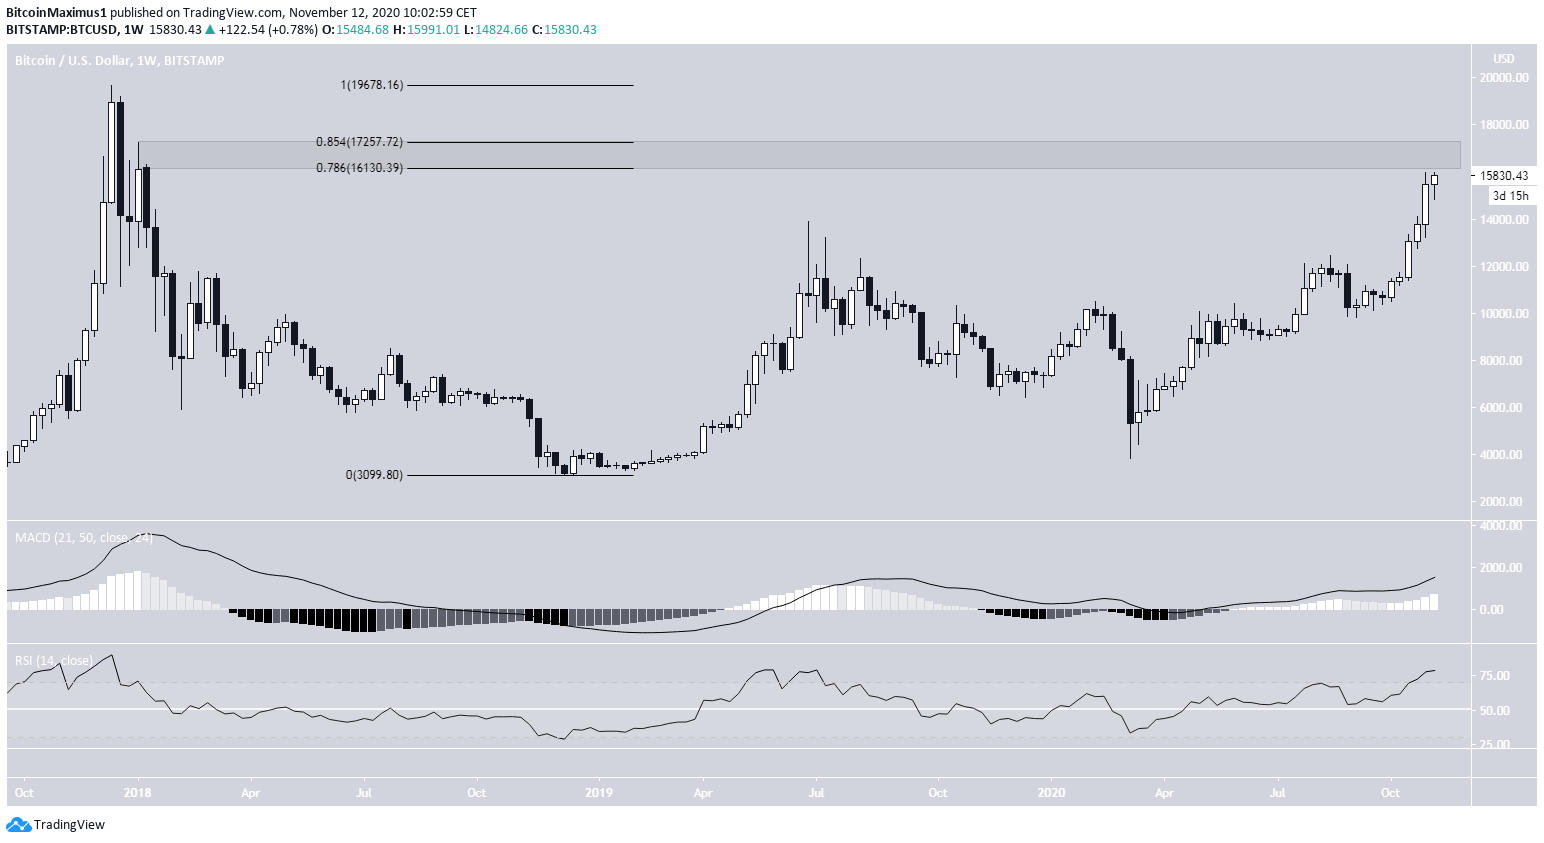
The weekly time-frame for BTC shows that the price is approaching a long-term resistance area found between $16,130-$17,257.
The area previously acted as a horizontal resistance in January 2018 and is the 0.786-0.854 Fib levels of the entire decrease since.
BTC is very close to the first resistance area and technical indicators are bullish, suggesting that the price will make an attempt at moving towards the $17,257 resistance area.
Wave Count
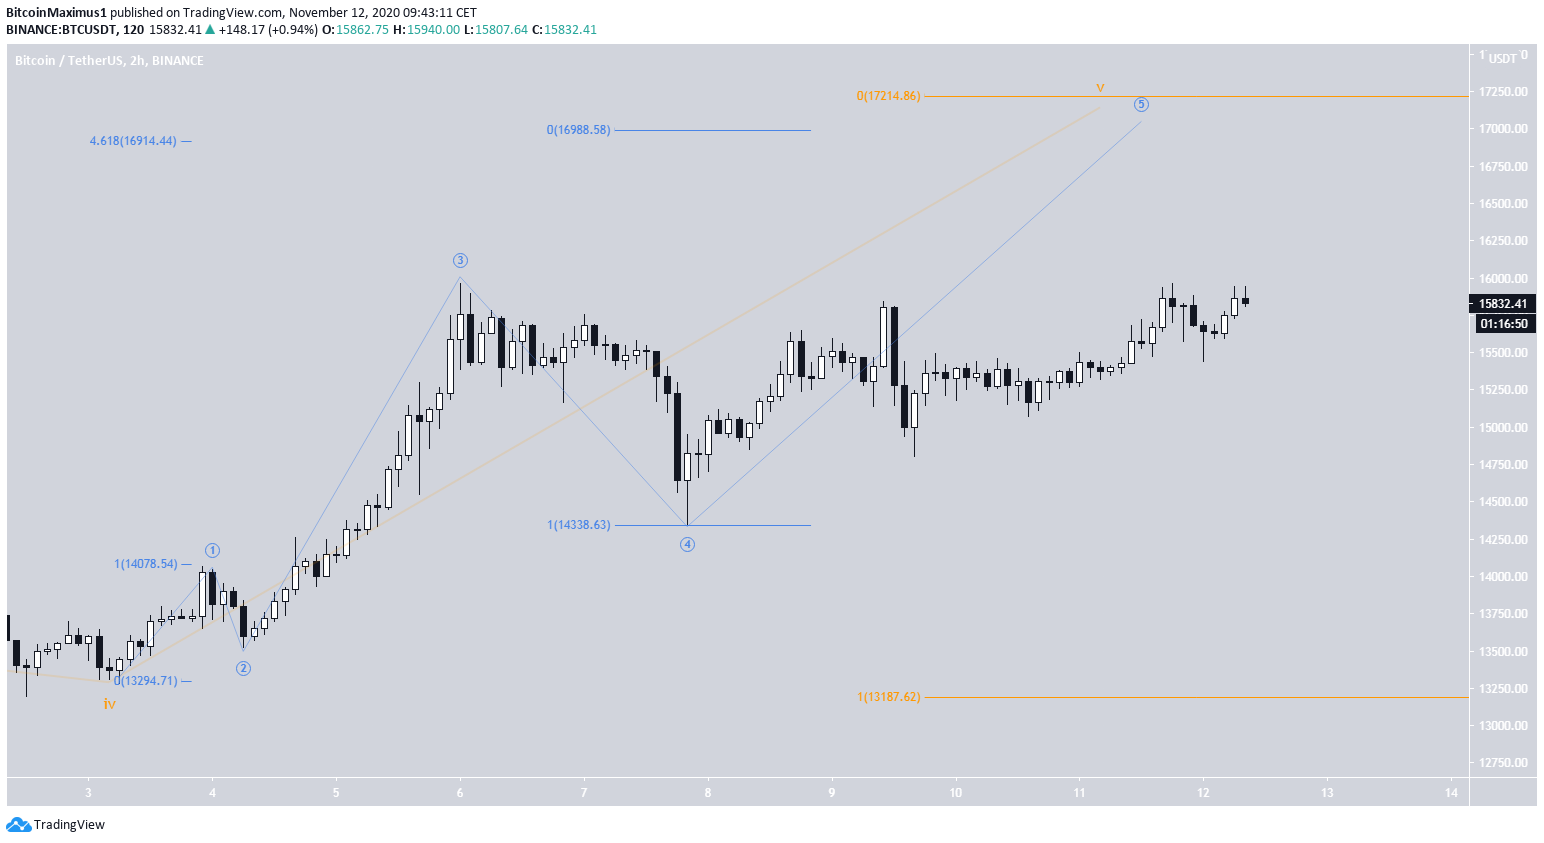
Bitcoin’s wave count supports the possibility of a breakout and gives a target between $16,900-$17,200 for the movement. The target aligns with that from the triangle and the long-term resistance levels.
This particular target was found by projecting the length of sub-waves 1-3 to sub-wave 4 (blue & orange). This is also the 4.618 Fib extension of sub-wave 1 (blue).
The 30-minute chart shows a possible 1-2/1-2 wave formation, which could lead to a significant acceleration of the rate of increase if BTC is successful in breaking out from the current resistance area.

Conclusion
Bitcoin is expected to continue its ascent and break out from the current resistance area, possibly leading to a high above $17,000.
For BeInCrypto’s latest Bitcoin analysis, click here!
Disclaimer: Cryptocurrency trading carries a high level of risk and may not be suitable for all investors. The views expressed in this article do not reflect those of BeInCrypto.
The post Bitcoin Targets $17,000 After Achieving Highest Daily Close in 2020 appeared first on BeInCrypto.


![Decentraland: Review & Beginner's Guide [current_date format=Y] 35 Decentraland: Review & Beginner's Guide](https://cryptheory.org/wp-content/uploads/2020/11/decentraland-02-gID_7-300x150.jpg)