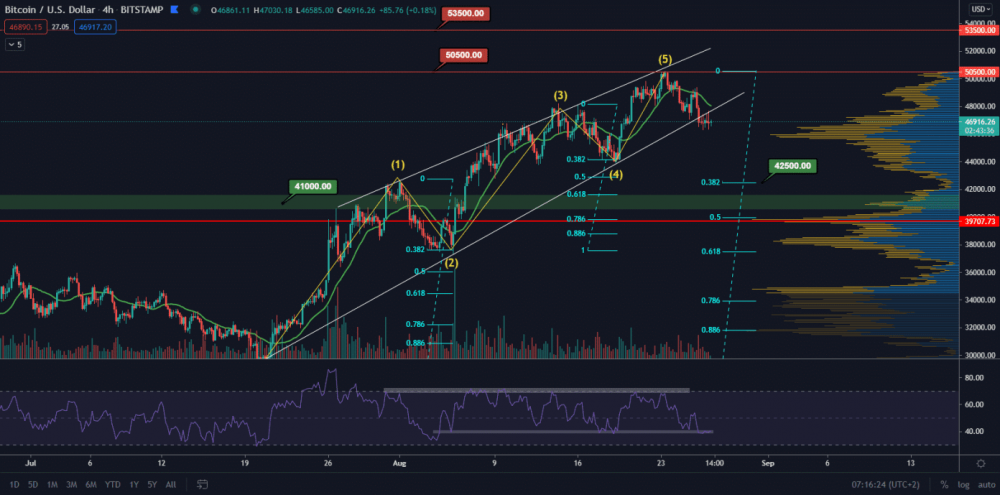
BTC analysis – what is the most bearish scenario of the current correction?
1 min readBTC continues its short-term correction leg downwards, but the price for the last day has rather stagnated. However, the reflection has not yet been confirmed and is still volumes are missing. In addition, the price is below double resistance. The trend will reverse or the price will be continue the short-term correction still?
BTC broke the growing trend, but there has not been a big sale yet. The price is trading for about $ 47,000 on the last day and the last maximum was tested by MA21 as resistance. This indicator can also serve as future short-term resistance. And if the price rises, the MA21 will exactly match the previous wedge support. This would create a double resistance at about $ 47,900.

The BTC correction is still ongoing
If the price will be continue the correction, we will watch first support at $ 46,000. However, this support is not significant in the long run. It’s more interesting support level from $ 41,000 to $ 42,500. At $ 42,500, the first target of the entire growing wedge is 38.2% retracement. This zone is a key shopping and support area.


