BTC (BTC) Attempts to Regain Key Support Area at $34,7000
3 min readBTC (BTC) has again approached an important support area near $34,700. After revisiting the $30,000 level last weekend, the price is trying to resume the uptrend.
Regaining this support area or validating it as a resistance again could determine the future direction of the trend.
BTC in the weekly chart
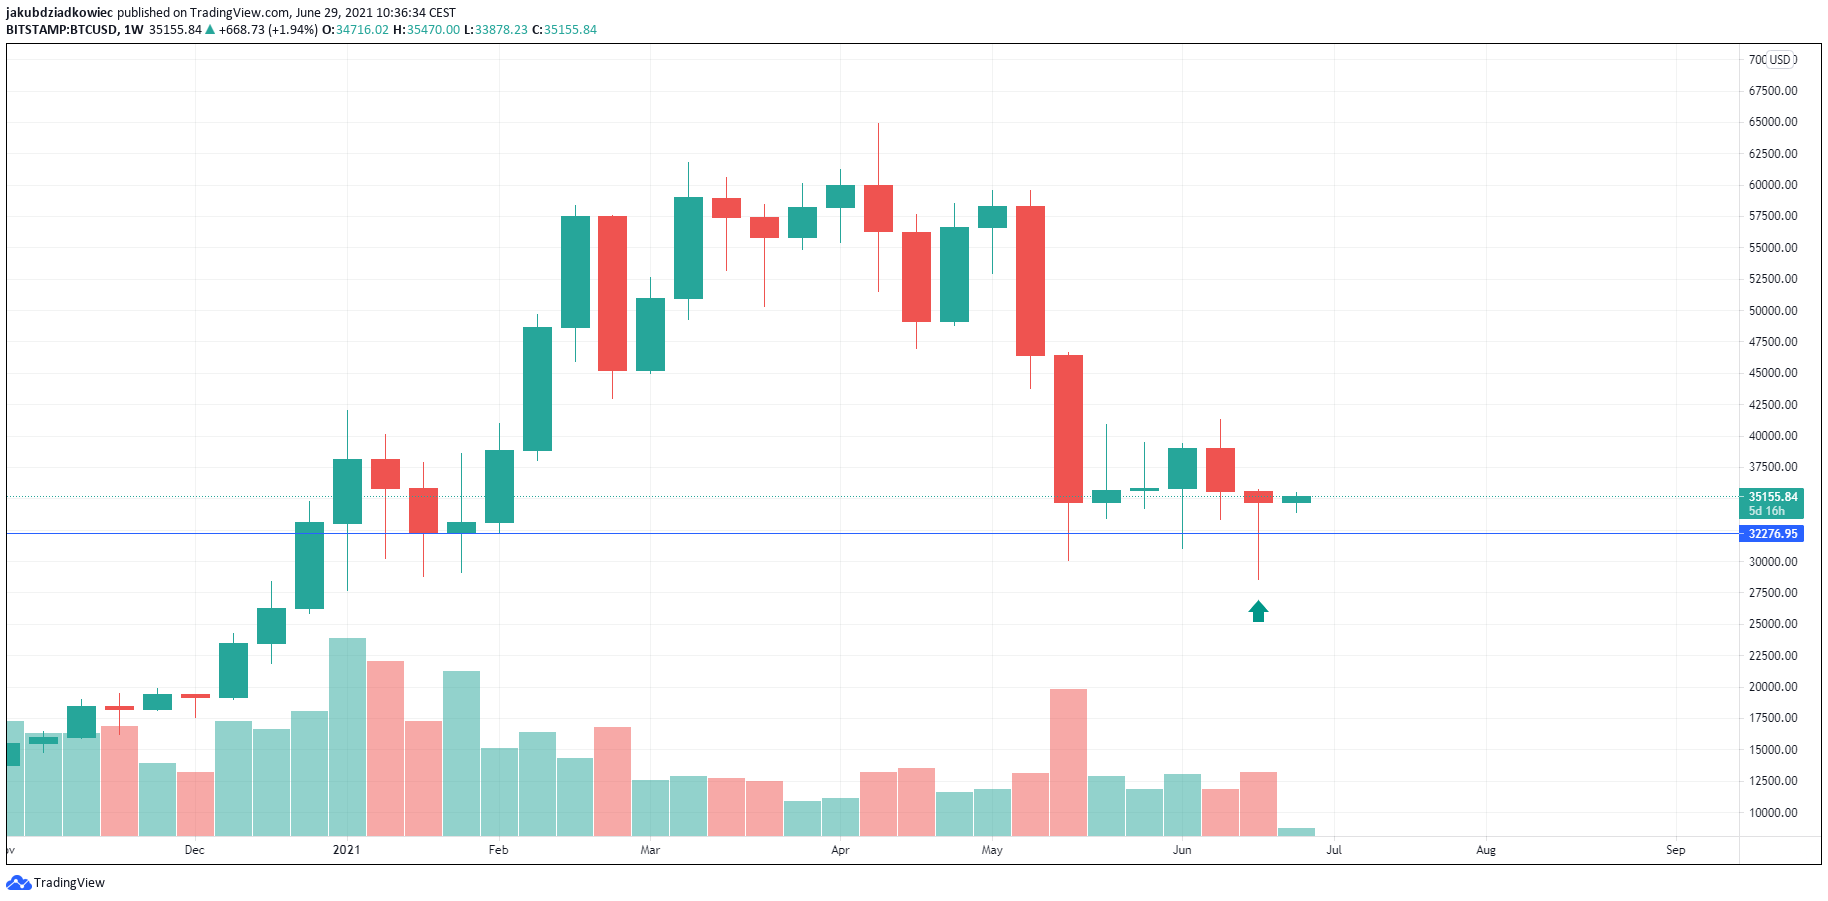
Last week, the BTC price bottomed at $28,600, an area that has not been seen since January 2021. However, a strong rebound and a retest of the $35,000 level followed shortly thereafter.
As a result, a hammer candlestick with a long bottom wick (green arrow) appeared on the weekly chart. It may be a sign of trend reversal.
Moreover, BTC did not record a close below the weekly support level in the $32,250 area (blue line), so technically the structure of the long-term uptrend remains intact.

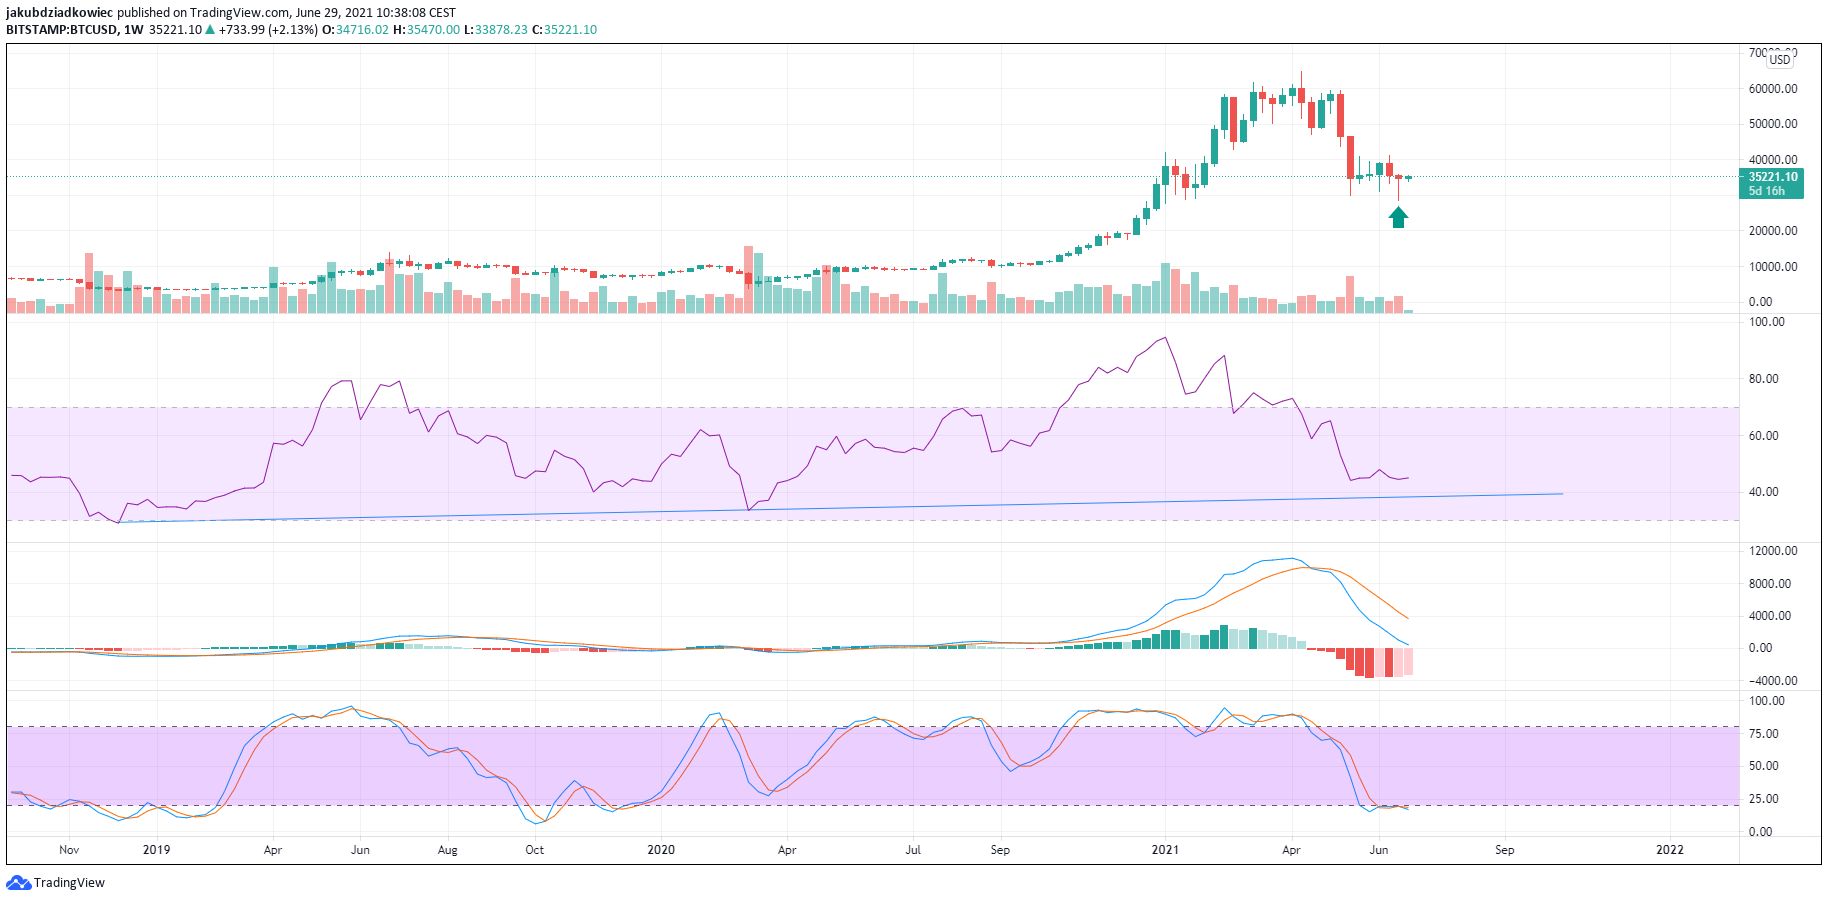
The weekly technical indicators are bearish, although signals for a bottoming action can be seen:
RSI is trying to turn around in the neutral area of the 44-48 range. At the same time, the indicator is approaching the long-term support line (blue), which dates back to December 2018 and was second validated during the COVID-19 crisis in March 2020.
MACD is falling sharply, but momentum has been weakening for the past two weeks, with the red bars getting shorter. The indicator has not yet entered negative territory as it did in March 2020.
The stochastic oscillator is in bearish territory below the 20 line and is not providing signals of a possible rebound for now.

Descending triangle
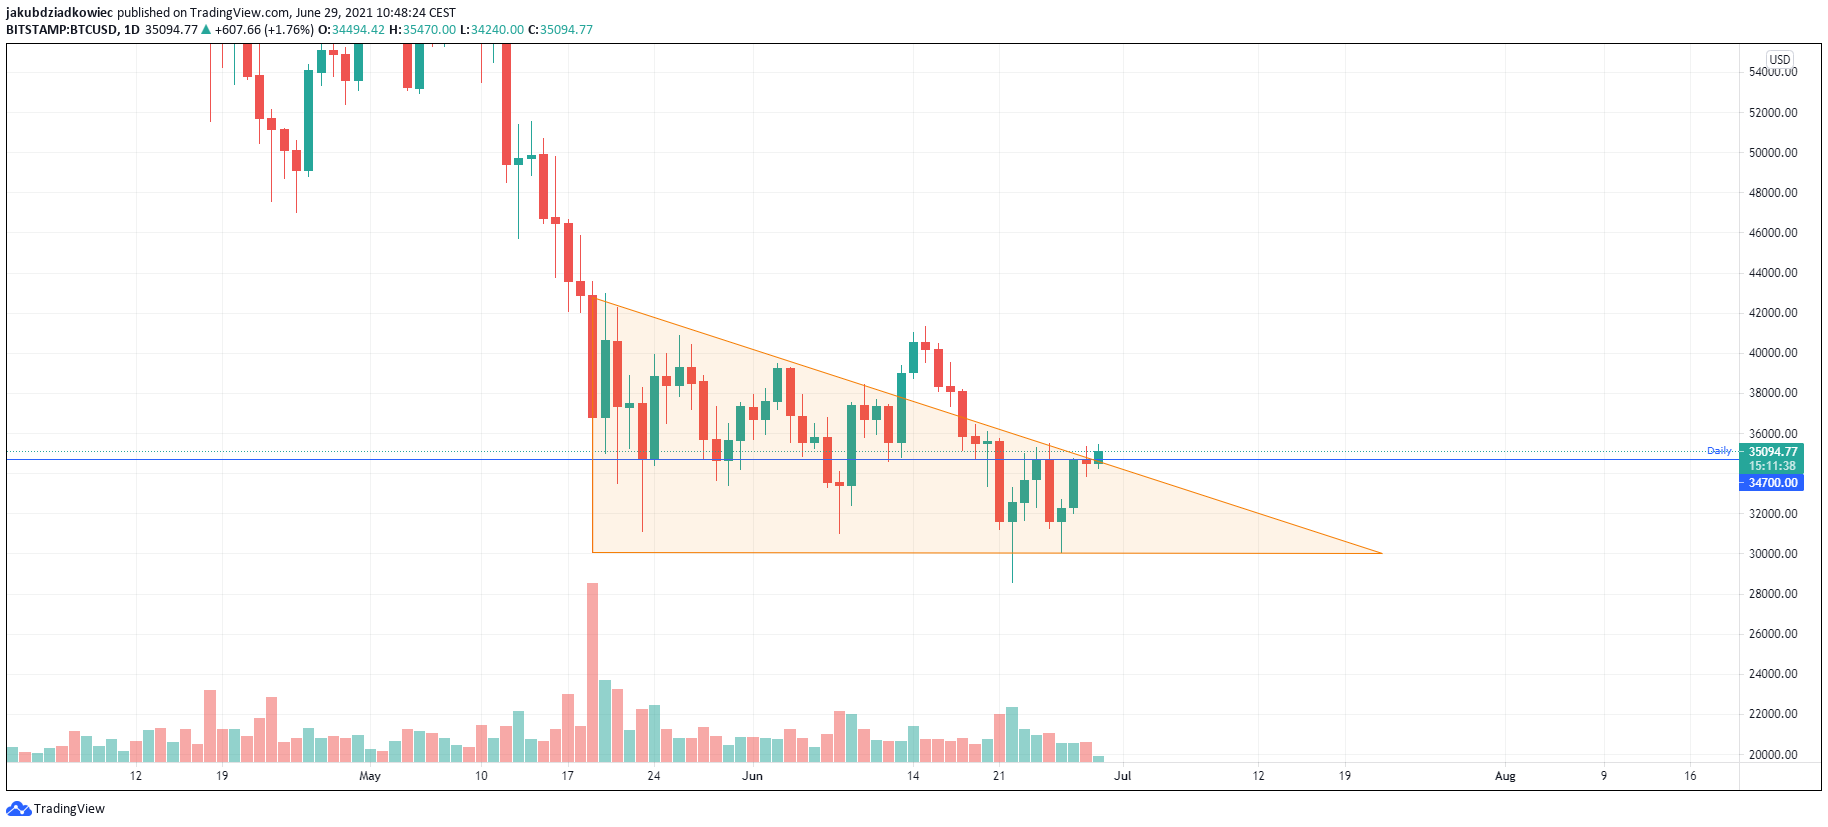
The daily chart provides a more bullish perspective. Since May 19, the BTC price appears to have formed a descending triangle structure, the base of which coincides with the $30,000 area. This area has already been tested and validated as support several times.
On June 13, there was a false breakout from this structure, validating the $40,500 level as resistance and returning to the bottom of the range. Currently, we see another attempt to break out of the triangle and overcome the key resistance level at $34,700 (blue line).
This level has served as support several times before, while it was confirmed as resistance on June 24. It also coincides with the falling resistance line of the aforementioned triangle structure. A breakout above this area would open the way for a retest of resistance at $40,500.

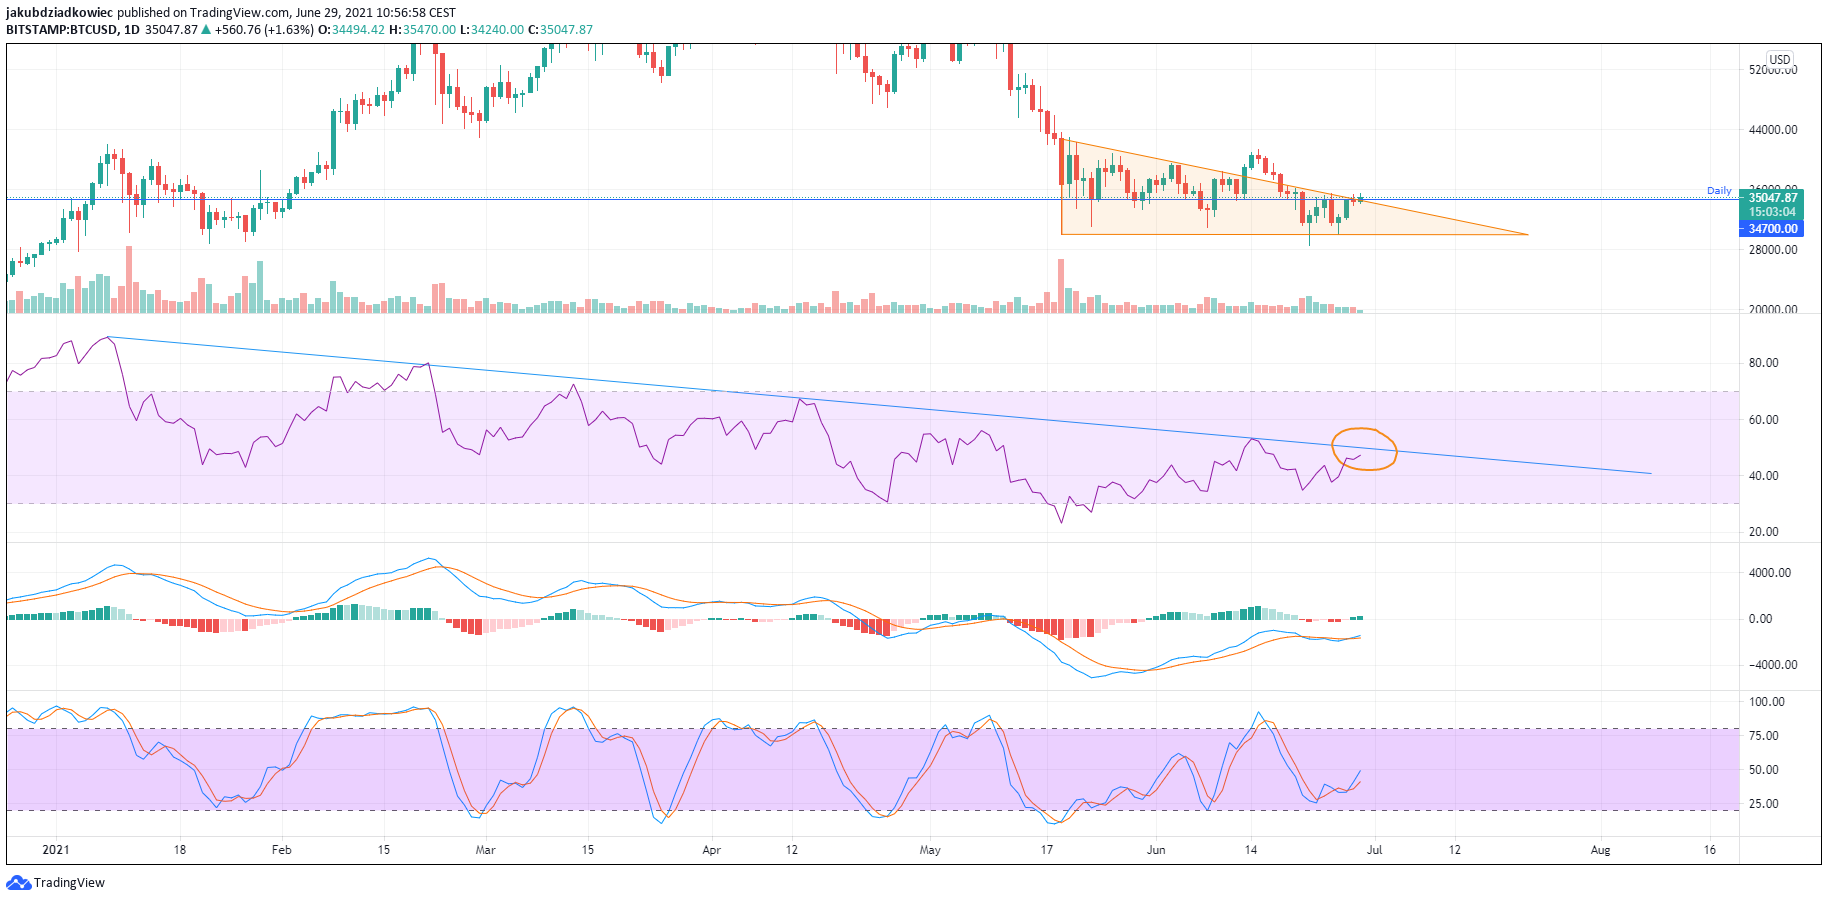
Technical indicators seem to support the possibility of a breakout. First, the bottom at $28,600 has helped to generate numerous bullish divergences on RSI, MACD and the stochastic oscillator. We see increasing readings on the basic indicators despite the fact that the price recorded a lower low.
Next, the MACD has been generating bars of positive momentum for the past two days and is getting closer to entering positive territory. The stochastic oscillator has reversed from the bearish territory and continues to rise in the neutral area.
The RSI seems most interesting, as the indicator has also rejected the decline into bearish territory, but is currently approaching the long-term resistance line (orange circle). This line goes back to January 2021 and has already been tested four times – most recently during the aforementioned June 13 false breakout. If the RSI breaks through this resistance line, it will be a strong reversal signal.

For BeInCrypto’s previous BTC (BTC) analysis, click here.
The post BTC (BTC) Attempts to Regain Key Support Area at $34,7000 appeared first on BeInCrypto.


![Decentraland: Review & Beginner's Guide [current_date format=Y] 28 Decentraland: Review & Beginner's Guide](https://cryptheory.org/wp-content/uploads/2020/11/decentraland-02-gID_7-300x150.jpg)