BTC (BTC) Bounces Back But Fails to Reclaim $36,000
2 min readBTC (BTC) has been moving upwards since bouncing on June 22. So far, it has managed to reach a local high of $36,623 on June 29.
However, BTC has failed to reclaim several important resistance levels. In addition, technical indicators do not indicate a bullish reversal is in the cards.
BTC rebound
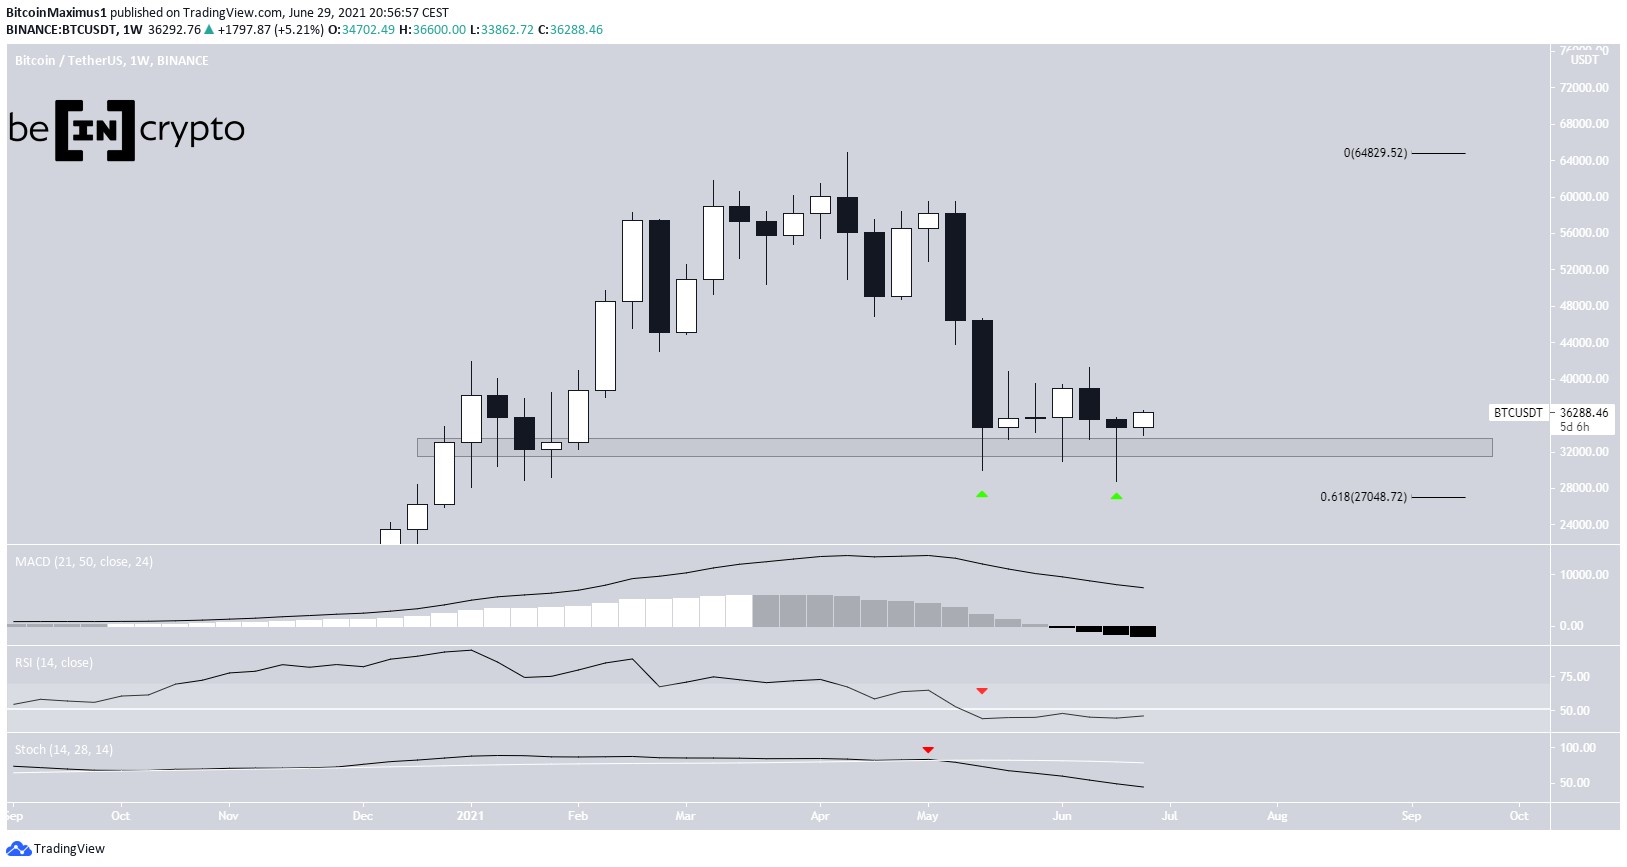
BTC rebounded considerably during the week of June 21-28. It reached a low of $28,805 but created a long lower wick (green). It proceeded to reach a close above the $32,600 horizontal support area. This area is crucial because BTC hasn’t reached a close below it since the beginning of the year, though some wicks have breached it.
The weekly close was a hammer candlestick, which is often seen as a bullish sign.
Despite the close above horizontal support, technical indicators are still bearish. The MACD is decreasing and negative, the RSI has fallen below 50, and the Stochastic oscillator has made a bearish cross (red icons).
Therefore, the bounce is not sufficient to confirm a reversal.

BTC still trading in a range
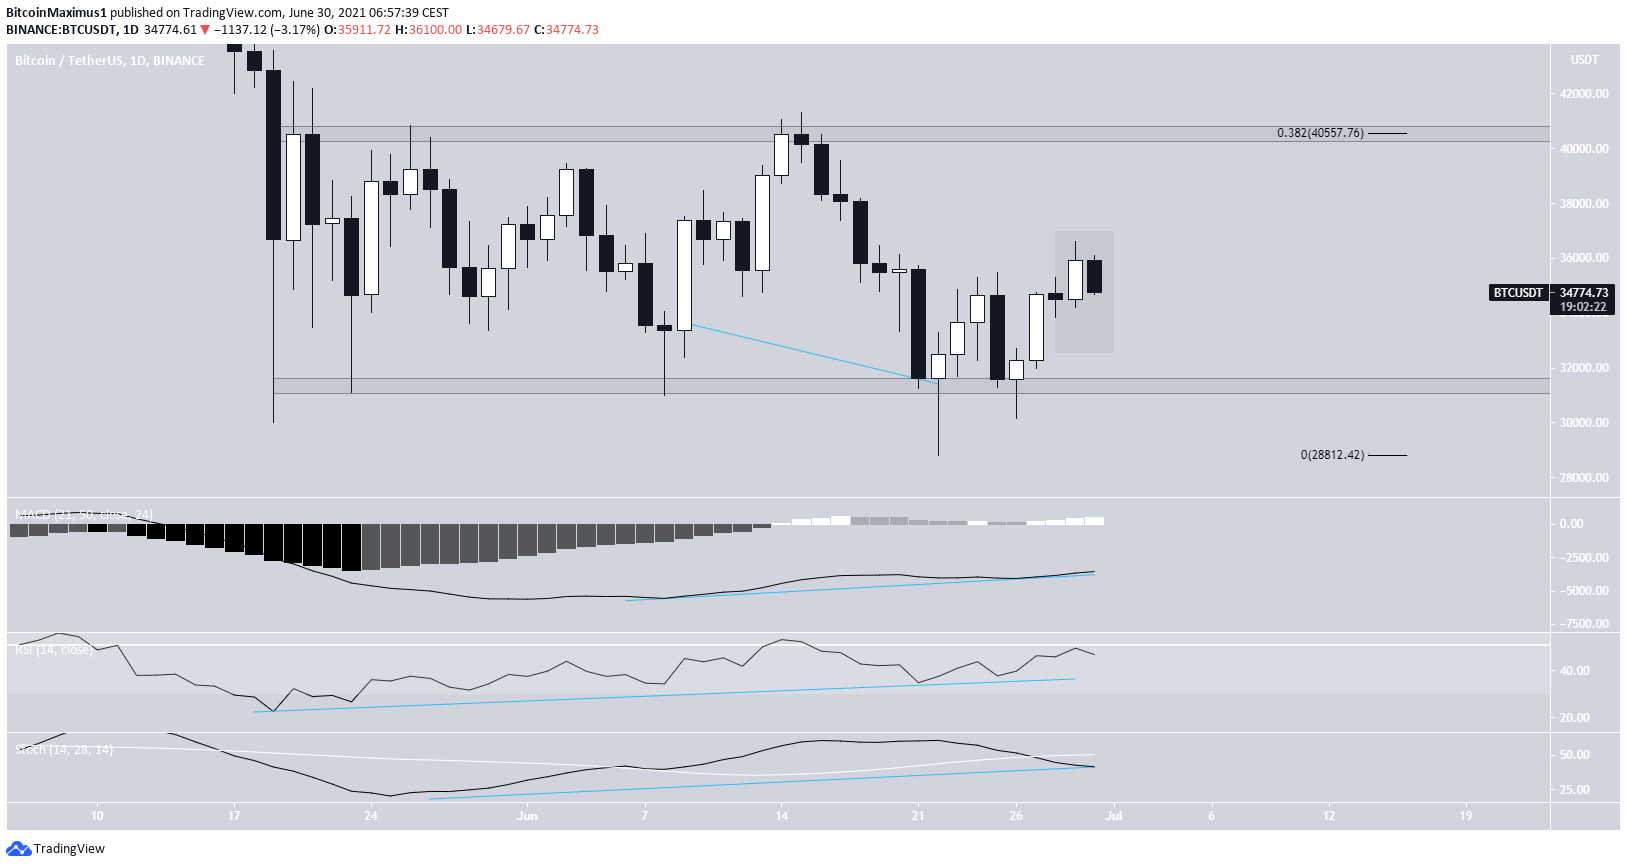
The daily chart provides a somewhat mixed outlook. BTC seems to be trading in a range between $31,400 and $40,550. It has been doing so since the initial drop on May 19. It bounced at the support area on June 22 and has been moving upwards since.
On one hand, the upward movement was preceded by very significant bullish divergence in the MACD signal line, the RSI, and the Stochastic oscillator.
However, none of the three currently has a bullish reading. The MACD signal line is still negative, the RSI is below 50, and the Stochastic oscillator has made a bearish cross.
While BTC is roughly halfway to the resistance area of $40,557, it has decreased sharply today and is in the process of creating a bearish engulfing candlestick. Doing so would likely confirm that the trend is bearish.

Wave count
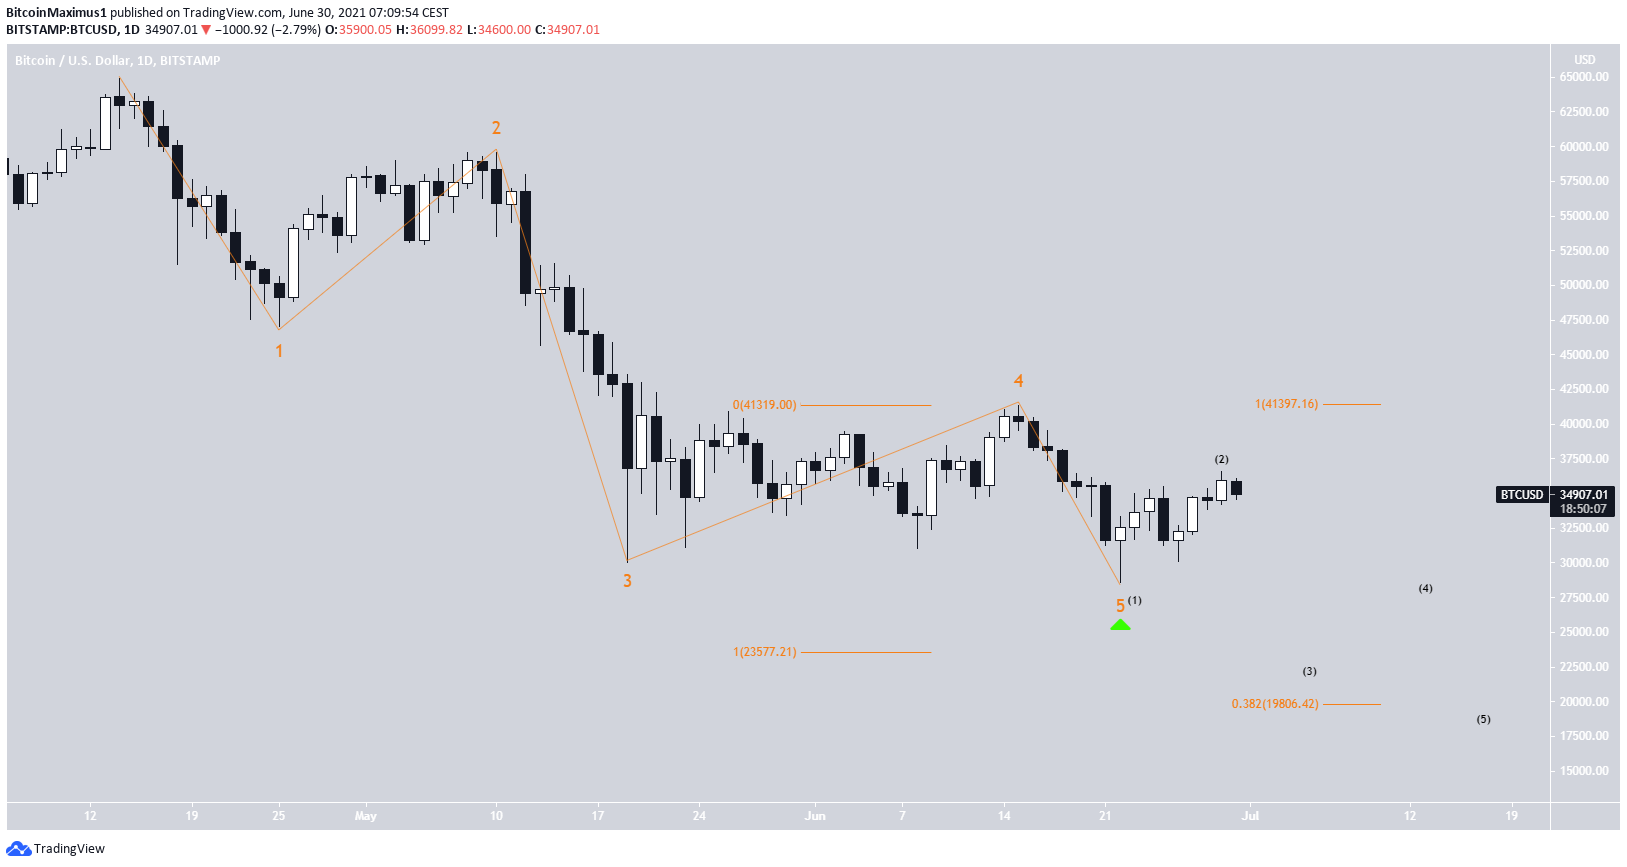
The long-term wave count is not yet entirely clear.
While BTC has clearly been on a downward trend since April 14, it’s not yet certain if the downward movement ended on June 22 (green icon), or if BTC is still in the fifth and final wave of a bearish impulse (black count).
While the former would suggest that the bottom is in, the latter would indicate that the price could continue decreasing towards $23,600 and potentially $19,800.

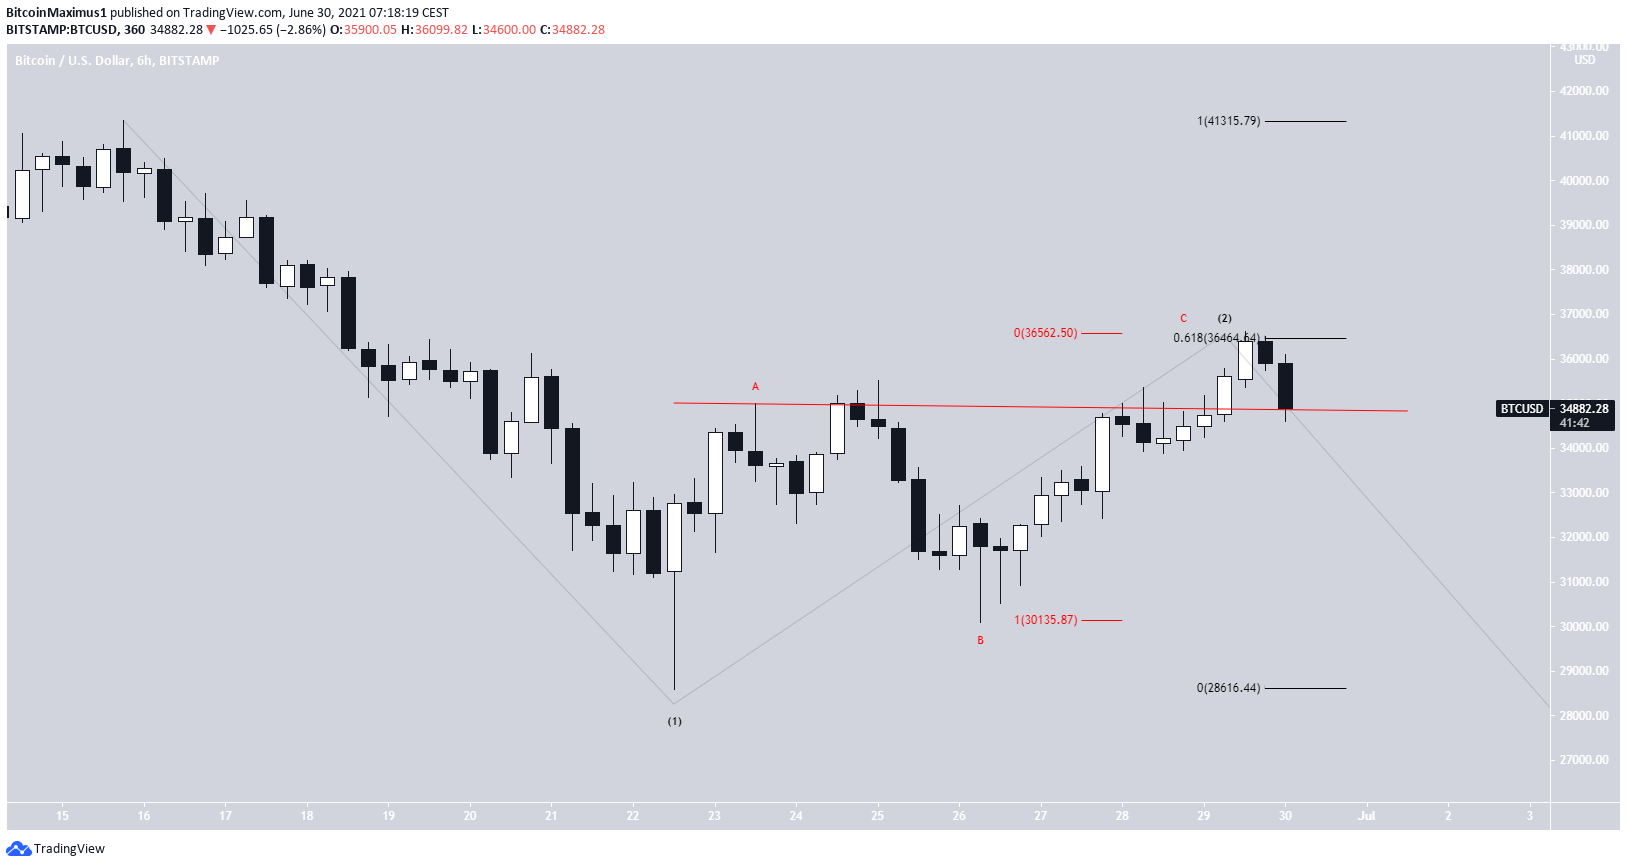
A closer look at the movement supports the bearish scenario.
The ongoing upward movement looks like an A-B-C corrective structure (red). There are two main reasons for this:
- The overlap between the upward movement and the rejection (red line).
- The move ended at a confluence of Fib resistance levels; the 0.618 Fib retracement level (black) and the 1:1 A:C target (red).
Therefore, it’s more likely that BTC has yet to reach its low and that another downward movement will follow.

The post BTC (BTC) Bounces Back But Fails to Reclaim $36,000 appeared first on BeInCrypto.


![Decentraland: Review & Beginner's Guide [current_date format=Y] 28 Decentraland: Review & Beginner's Guide](https://cryptheory.org/wp-content/uploads/2020/11/decentraland-02-gID_7-300x150.jpg)