BTC (BTC) Has Roller Coaster Weekend, Revisits Crucial Support
3 min readBTC (BTC) decreased considerably last week, approaching the May lows near $30,000.
While a short-term bounce could occur, it seems that both the daily and weekly trends are bearish.
Long-term BTC movement
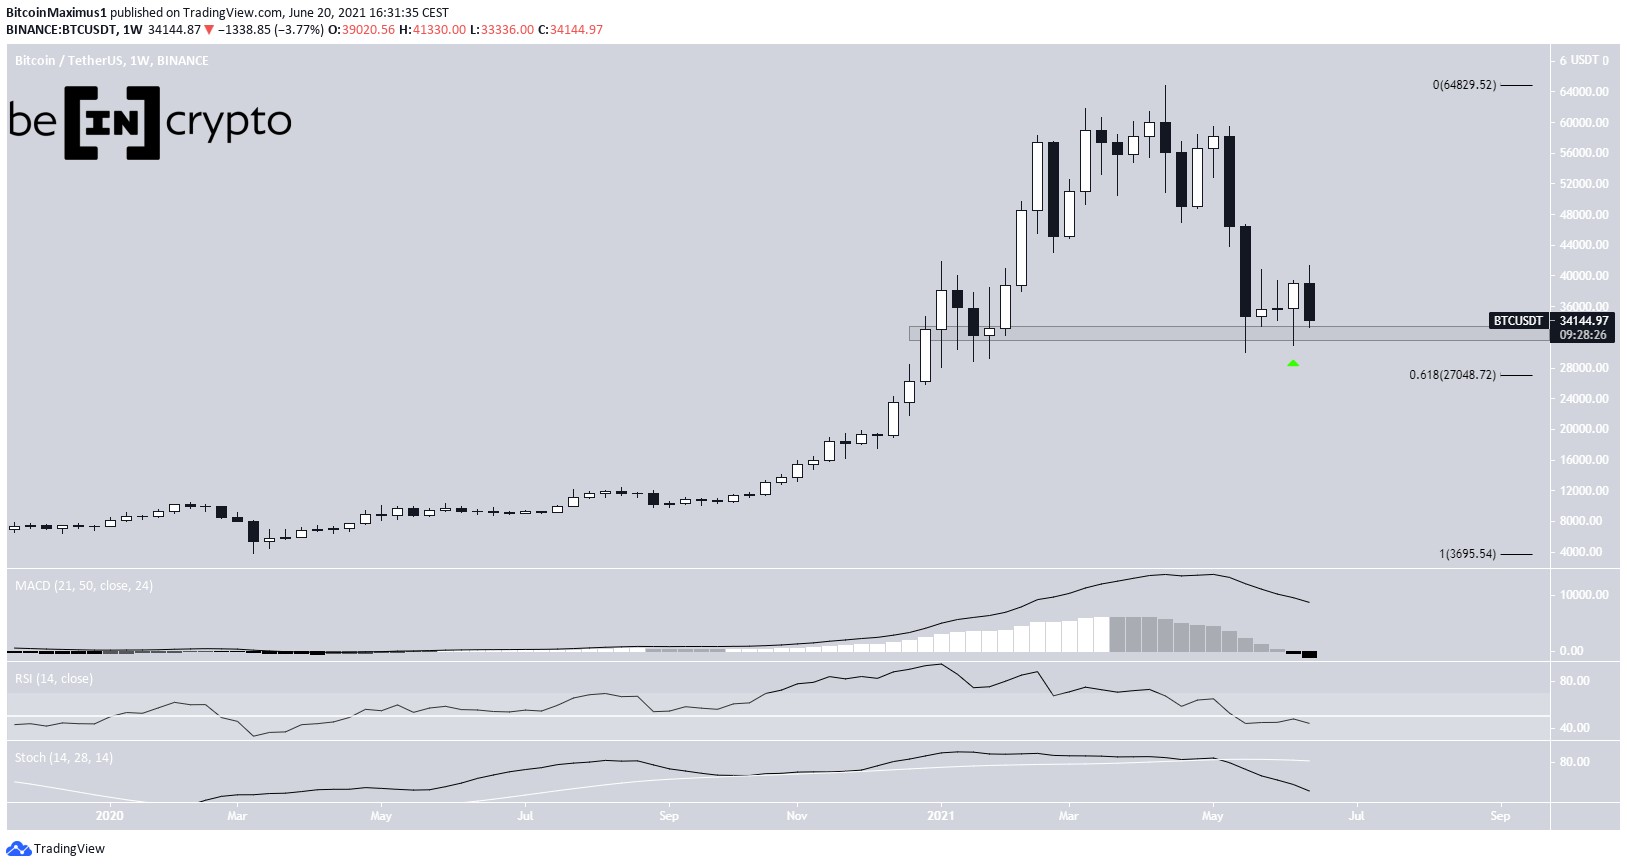
The weekly BTC chart provides a bearish picture. BTC appeared to have begun a bullish movement two weeks ago after creating a bullish hammer candlestick with a long lower wick. The bounce occurred right at the $32,500 long-term horizontal support area (green icon).
However, it created a bearish candlestick last week, engulfing the previous bullish candle and negating the bullish sentiment.
Despite still trading above support, technical indicators are bearish. The MACD histogram has crossed into negative territory, the RSI has fallen below 50, and the Stochastic oscillator has made a bearish cross.
If a breakdown occurs, the next support would be found at $27,000. This target is the 0.618 Fib retracement support level.
Ongoing rejection
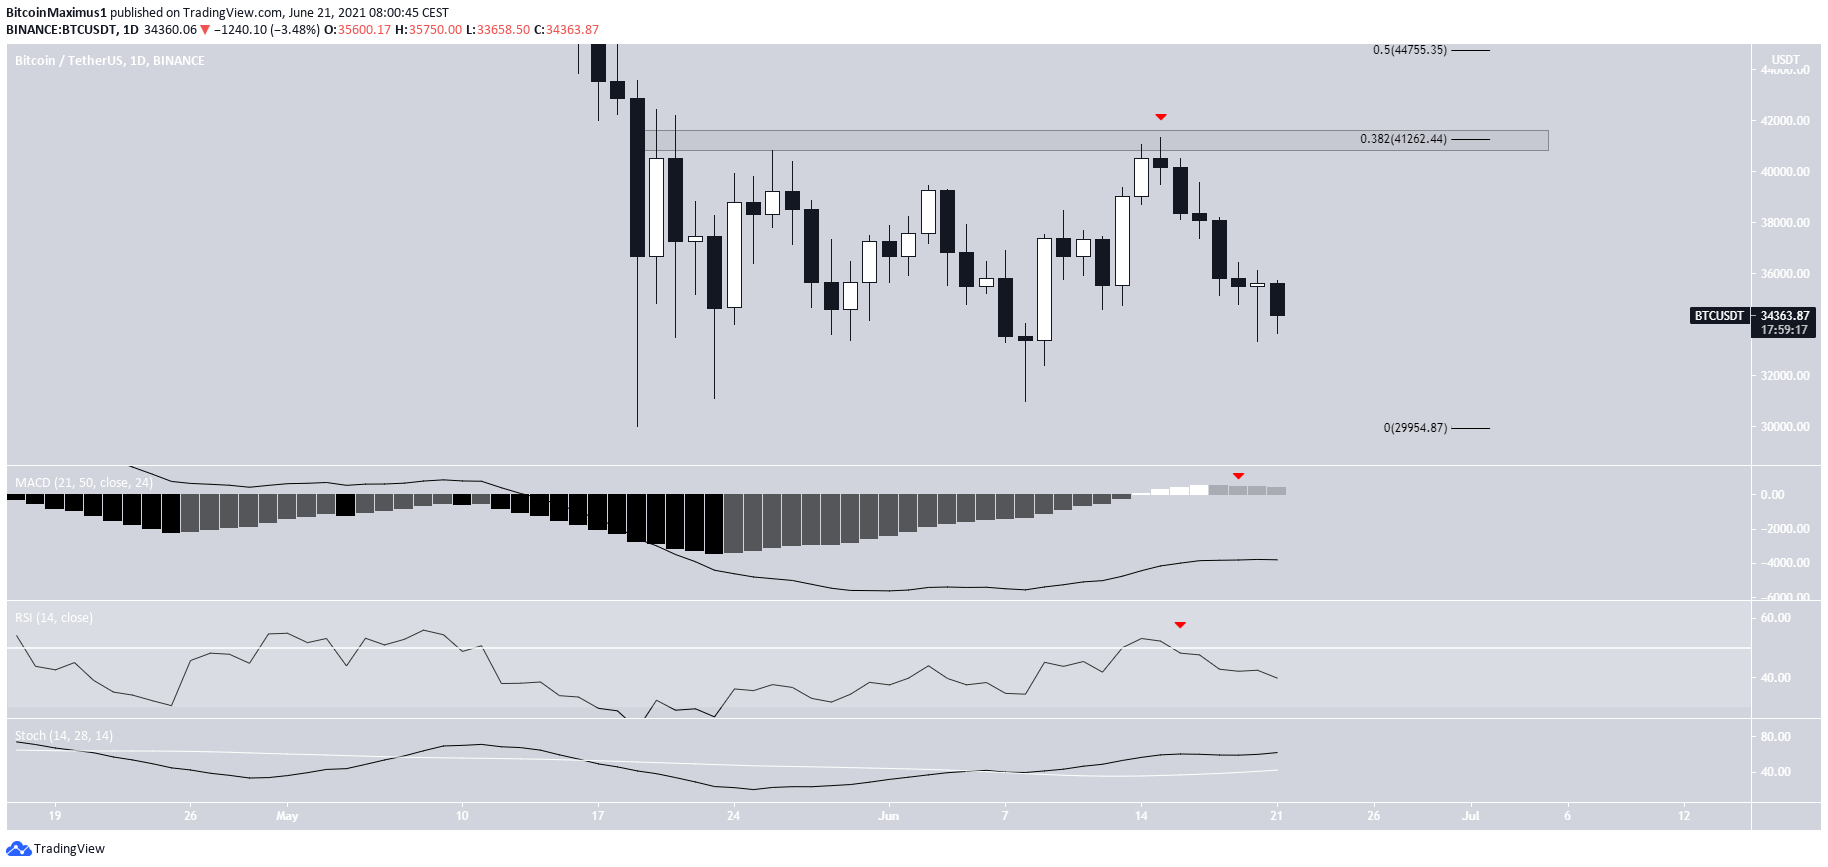
The daily chart also provides a bearish outlook. BTC has been falling since it was rejected by the $41,250 resistance area on June 15 (red icon).
Technical indicators are bearish. The MACD histogram has given a bearish reversal signal (red icon) and its signal line is well below 0. The RSI is also below 50 and decreasing, and the Stochastic oscillator has made a bullish cross but has lost all of its strength.
These readings support those from the daily time frame in suggesting that BTC is expected to eventually break down.
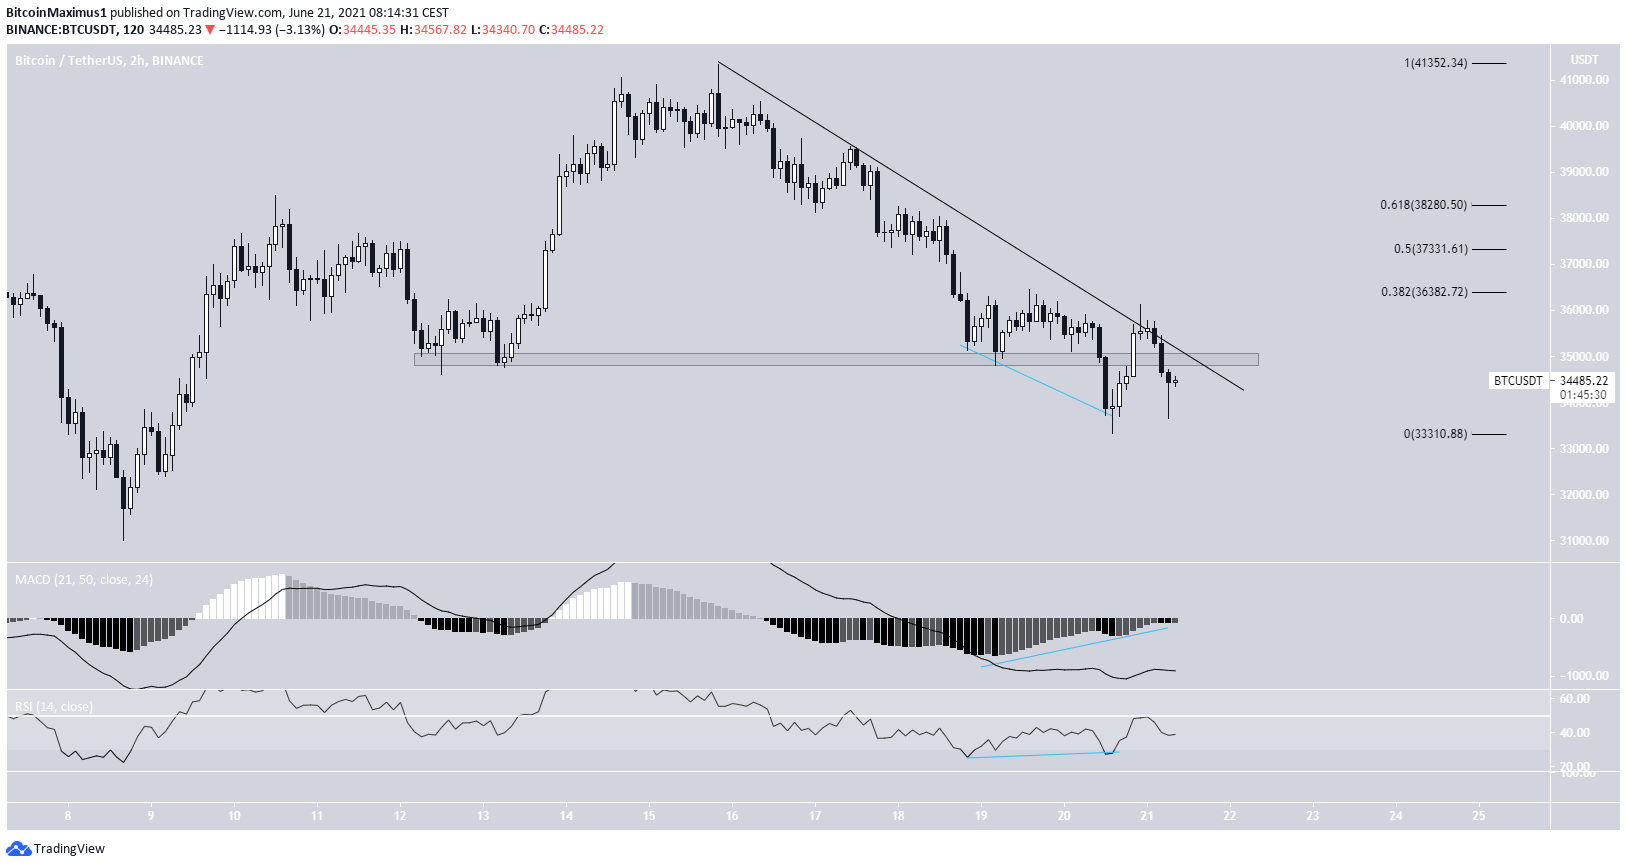
The two-hour chart shows some bullish signs in the form of a bullish divergence in both the RSI and MACD during the most recent lower low. Following this, BTC created a higher low.
However, it’s facing strong resistance from the $35,000 area in the form of both a descending resistance line and a horizontal resistance level.
Breaking out above this level would indicate that the price is likely heading towards the 0.382, 0.5, or 0.618 Fib retracement resistance levels.
Nevertheless, this would most likely be just a short-term bounce in a longer-term bearish trend.
BTC wave count
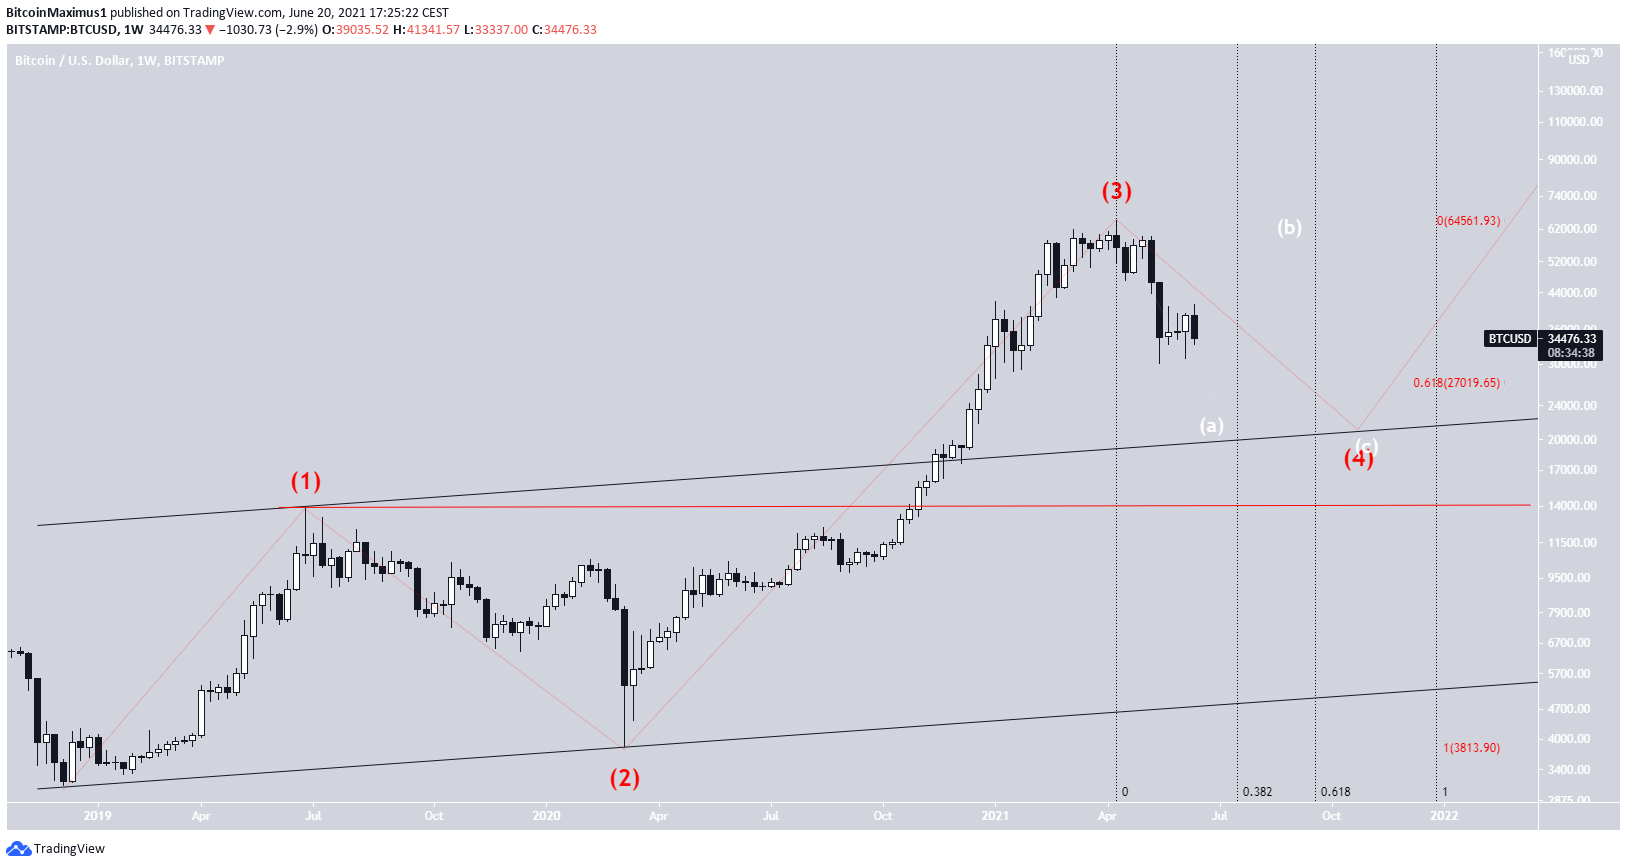
The wave count shows that BTC is likely in cycle wave four (red) of a bullish impulse that began on Dec. 2018. It is now decreasing, potentially completing a fourth wave pullback. The wave count is given in white. It indicates that BTC is likely still in the first part of the correction.
The 0.618 Fib retracement support level is at $27,000, while the resistance line of the channel near $20,000.
A move that lasts as long as cycle wave two (red) would continue until the end of December 2021. However, other potential length ratios are the 0.382 and 0.618 Fib time levels. The former ends on July 19 while the latter on Sept. 20.
A decrease below the wave 1 high at $13,880 would invalidate this wave count.
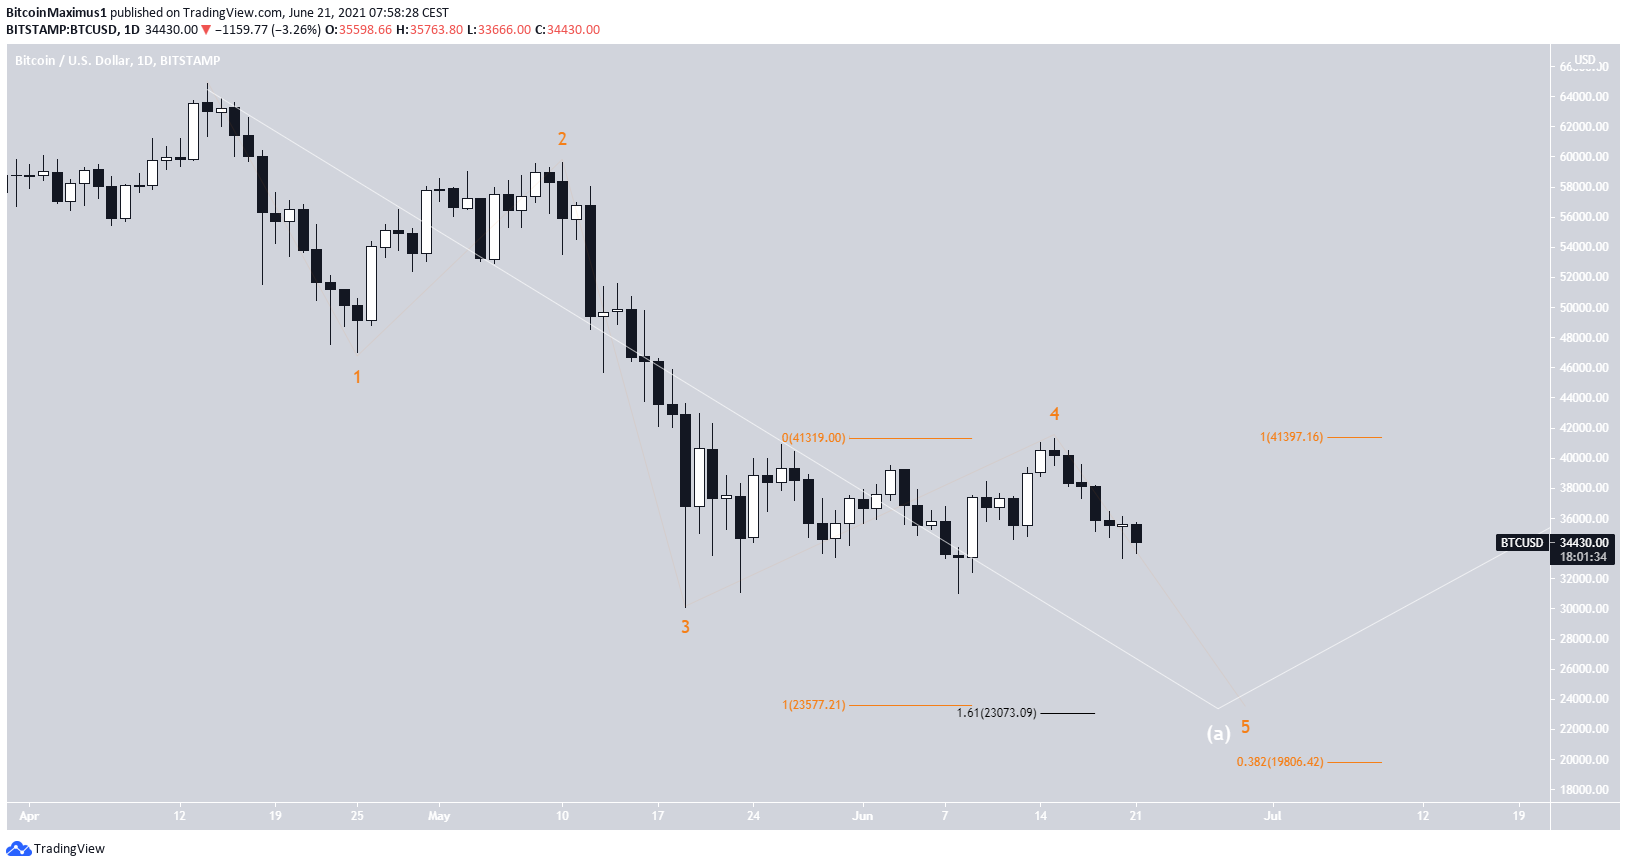
The daily chart shows the sub-wave count in orange. It shows that BTC is in the fifth and final wave of a bearish impulse, that completes wave A.
There is a confluence of Fib targets between $23,500 and $23,070, found by the length of sub-wave 1 and an external retracement on sub-wave four.
If this fails to play out, the next most likely target would be $19,800, found by using a Fib projection on the length of sub-waves 1-3.
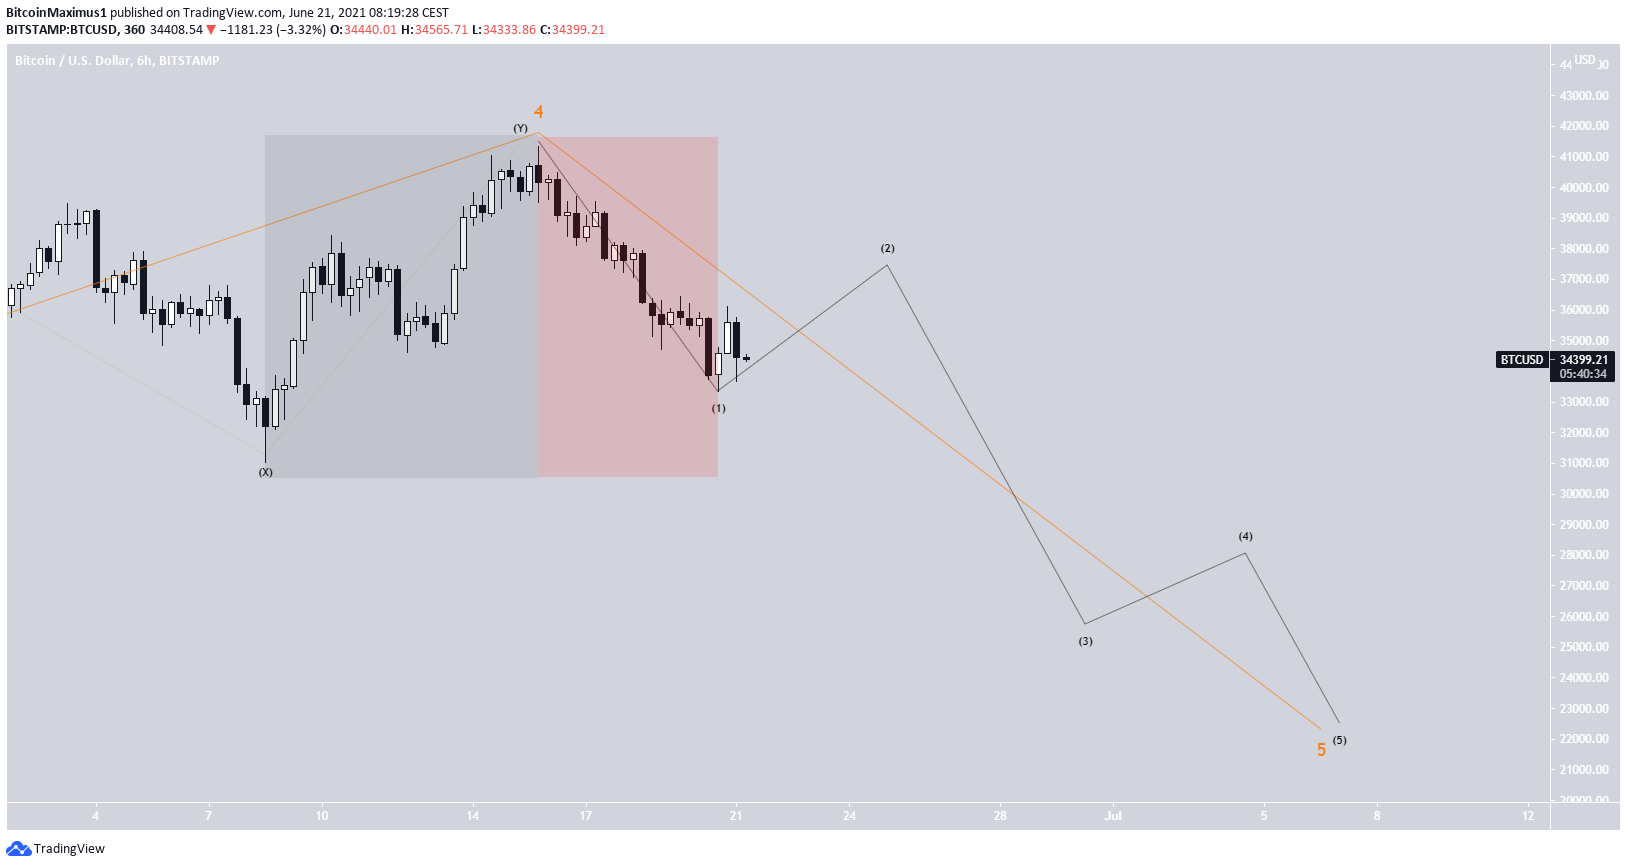
While the very short-term wave count is not entirely clear, the downward movement looks impulsive. In addition, the upward movement that led to the $41,341 high looks corrective.
Therefore, it’s likely that BTC is in minor sub-wave one (black) of a bearish impulse that will gradually take it towards the previously outlined target near $23,000.
For BeInCrypto’s previous BTC (BTC) analysis, click here.
The post BTC (BTC) Has Roller Coaster Weekend, Revisits Crucial Support appeared first on BeInCrypto.


![Decentraland: Review & Beginner's Guide [current_date format=Y] 35 Decentraland: Review & Beginner's Guide](https://cryptheory.org/wp-content/uploads/2020/11/decentraland-02-gID_7-300x150.jpg)