BTC: changes in market structure – an overview
2 min readTable of Contents
Long-term holders still control most BTCs and show the highest levels of accumulation. In terms of coin movements, the market situation looks calm and neutral. Market data point to sales by short-term and long-term speculators. We are now waiting for the demand.
Neutral market structure
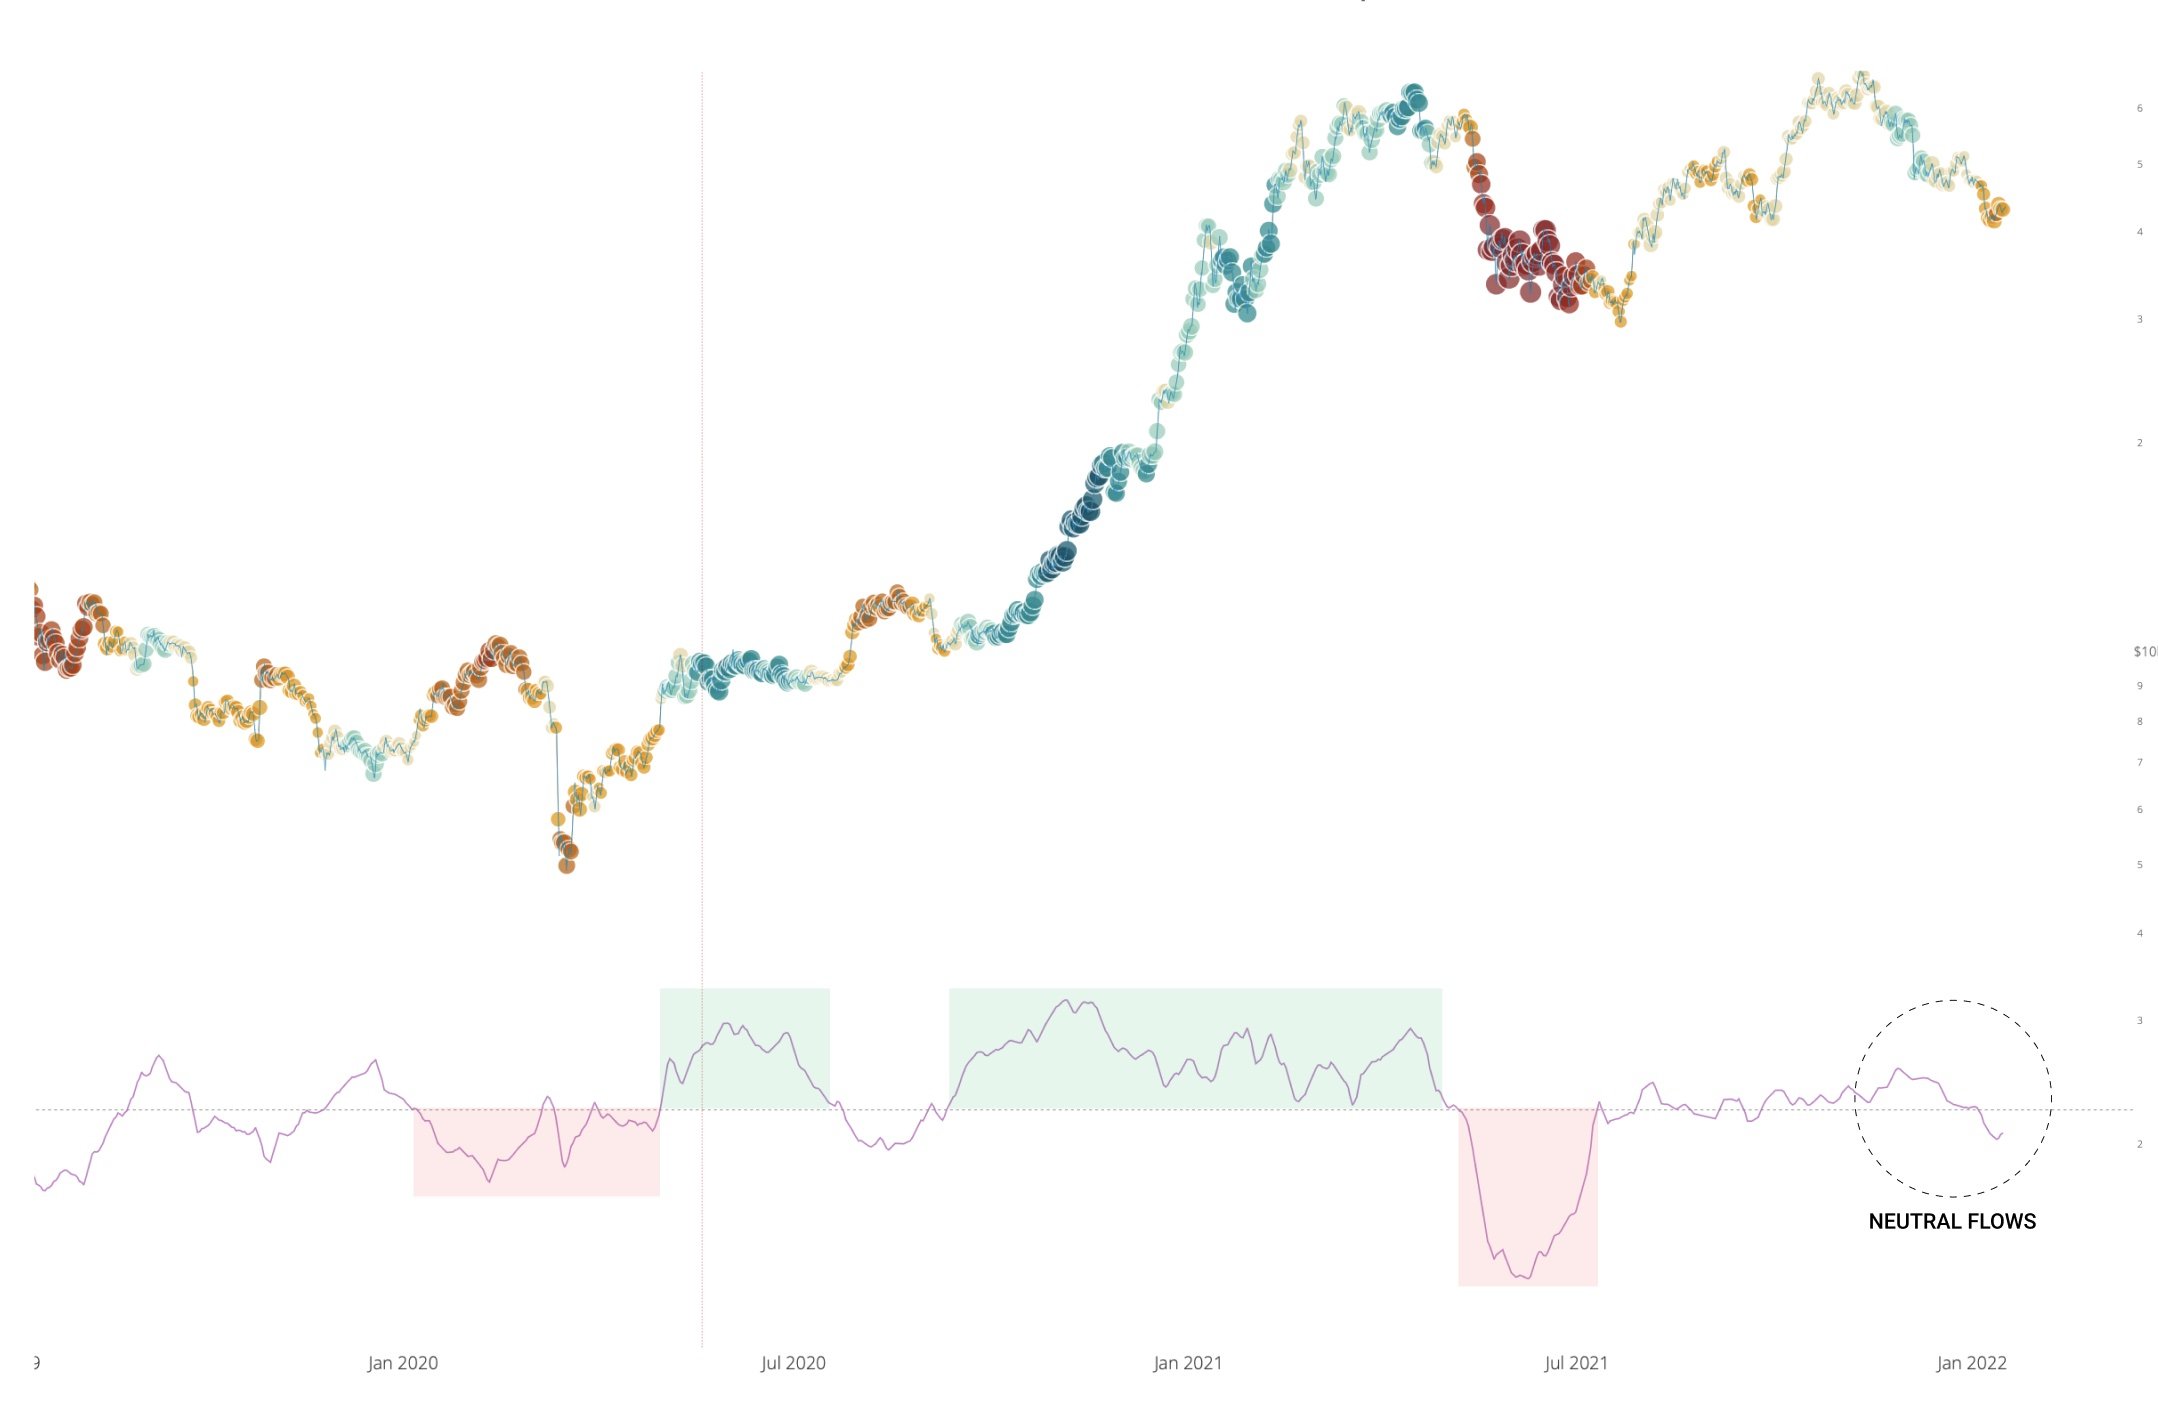
From a macro perspective, long-term BTC holders are still at the highest level of accumulation. Such investors usually sell only at a profit with a significant increase in price. Similar sales could be seen as the price rose to $ 69,000. In the last 3 weeks, they have stopped collecting profits, probably believing that BTC is too cheap to sell at the current level.
In the chart below, this formula is slightly adjusted using the z-score for a more reliable comparison with past levels. Values marked in red are typical for full-fledged bear markets. The May sale can be seen as a medium-sized “mini-bear market”. To date, the indicator is still in a strong accumulation range due to the previous 8-year market history.
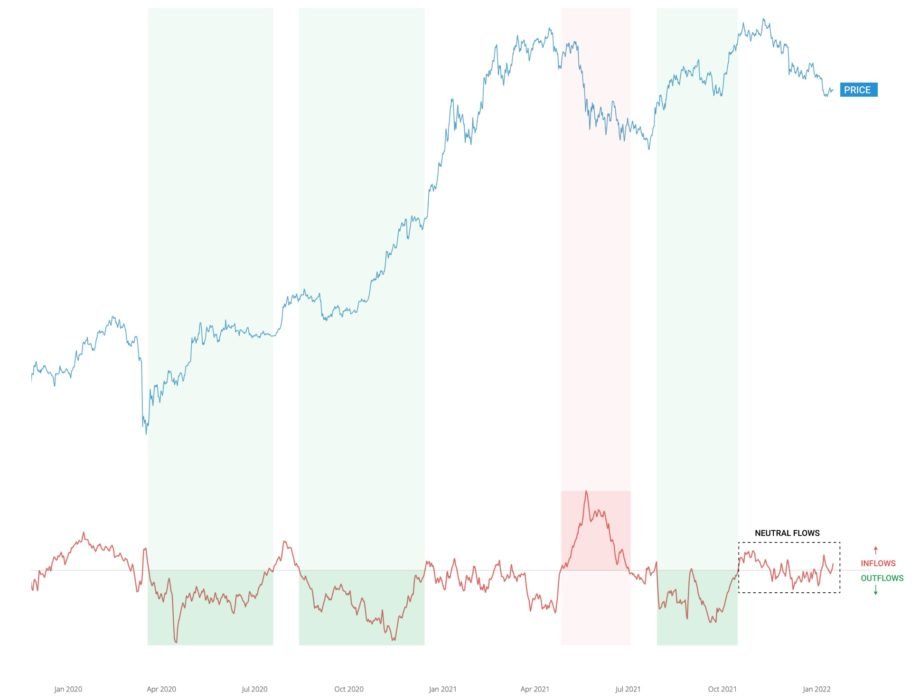
The net inflow of coins into exchanges wallets remains in a relatively neutral zone. Now the situation looks more like a “bear”. In the chart below, the previous periods of significant purchases or sales are indicated in green and red. Compared to them, the current values look quite neutral.
The net inflow of coins on the exchange looks similar – very neutral:
So far no signs of institutional capital allocation
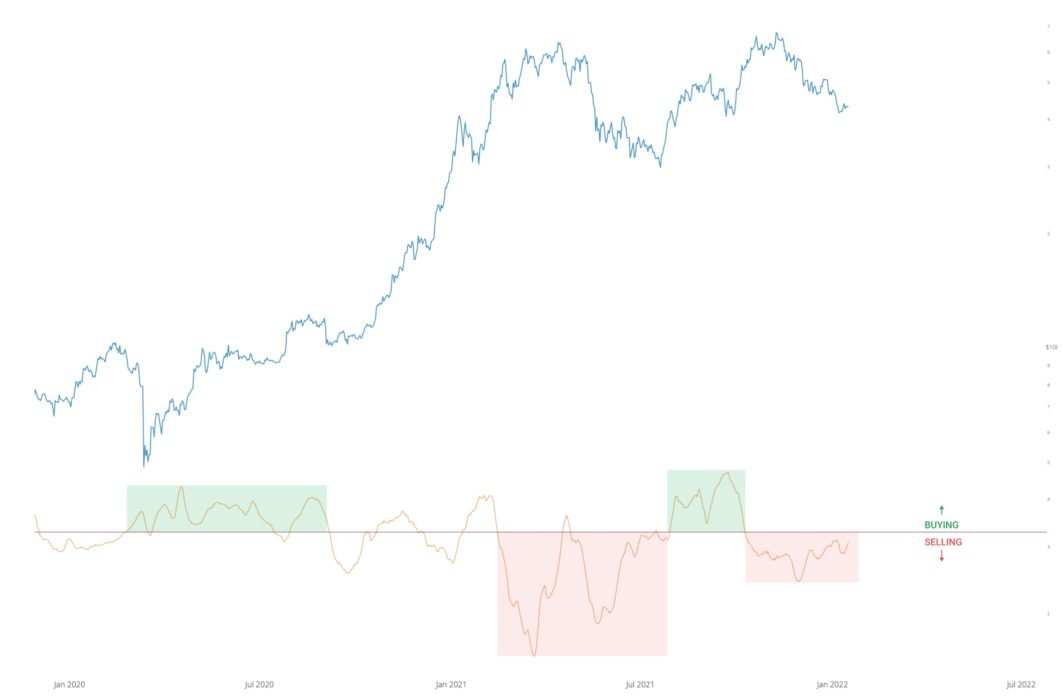
Whales – wallets with a balance of ≥1000 BTC – have been selling since October and peaked in December. The December sale was not a surprise, as hedge funds raised profits at the end of the year to maximize their management fees. New capital inflows were expected in January, but so far this has not been reflected in the market. However, the sale is weakening and the market is gradually moving to the buying territory.
Looking at the supply and demand on the chain, a trend of sell-offs by both retailers and speculative investors can be observed in the last 2 months. It looks like a wait and a peak in the hodler chart (green curve) would be the most important bull signal.
Speculators are not ready to buy yet
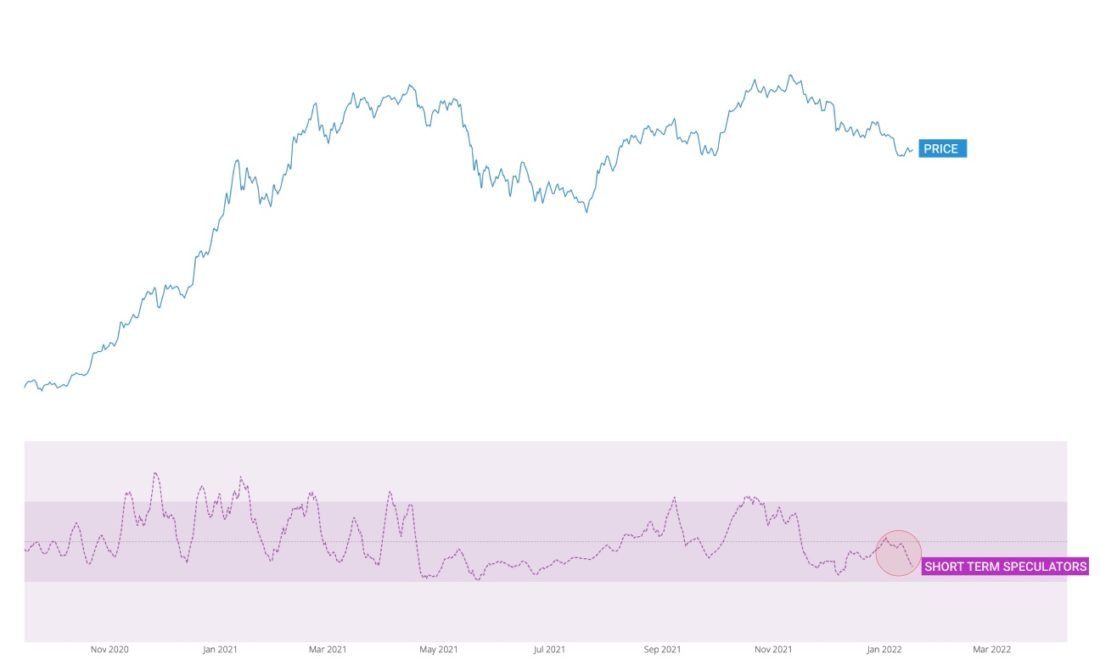
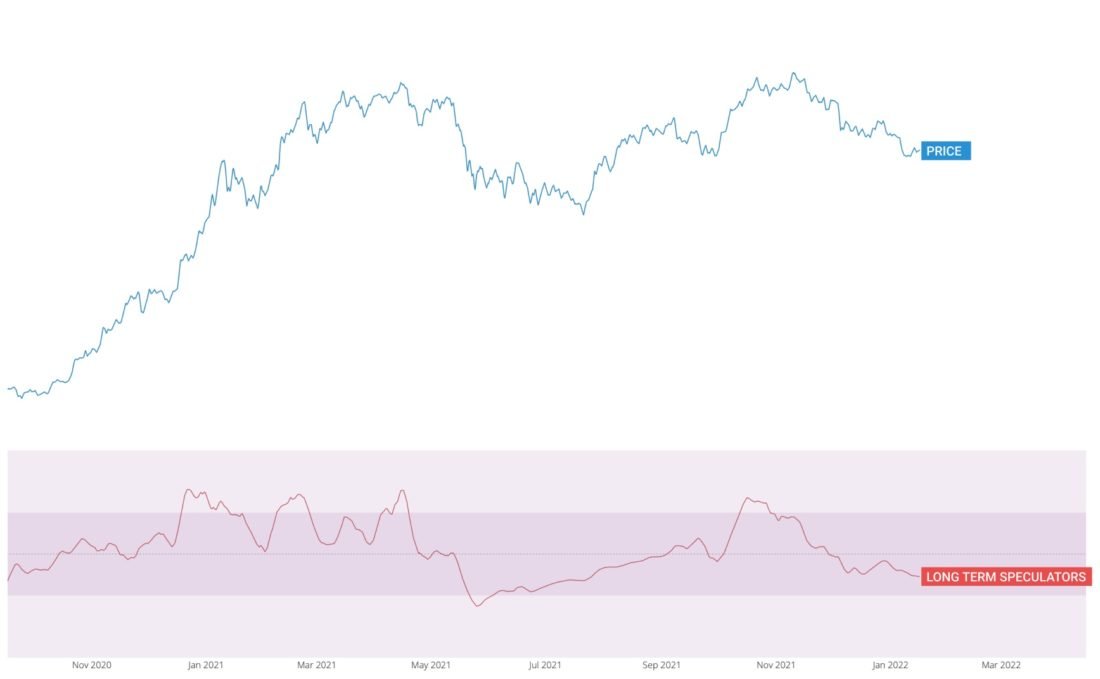
The PDL oscillator in the chart below monitors short-term supply and demand from speculators based on data from futures exchanges. In the last two weeks, short-term traders have sold out.
Likewise, the PDL oscillator for longer-term speculators has not yet bottomed out, although given the shallow appearance of the downward trend, it is showing signs of being close to it.
Conclusion
BTC is roughly in a horizontal accumulation zone with low spot volumes compared to futures markets, where most short-term speculation takes place. We will have to wait until the spot volumes due to futures increase.


