BTC, ETH, XRP, SOL, ZEC, MANA, ONE — Technical Analysis July 7
3 min readTable of Contents
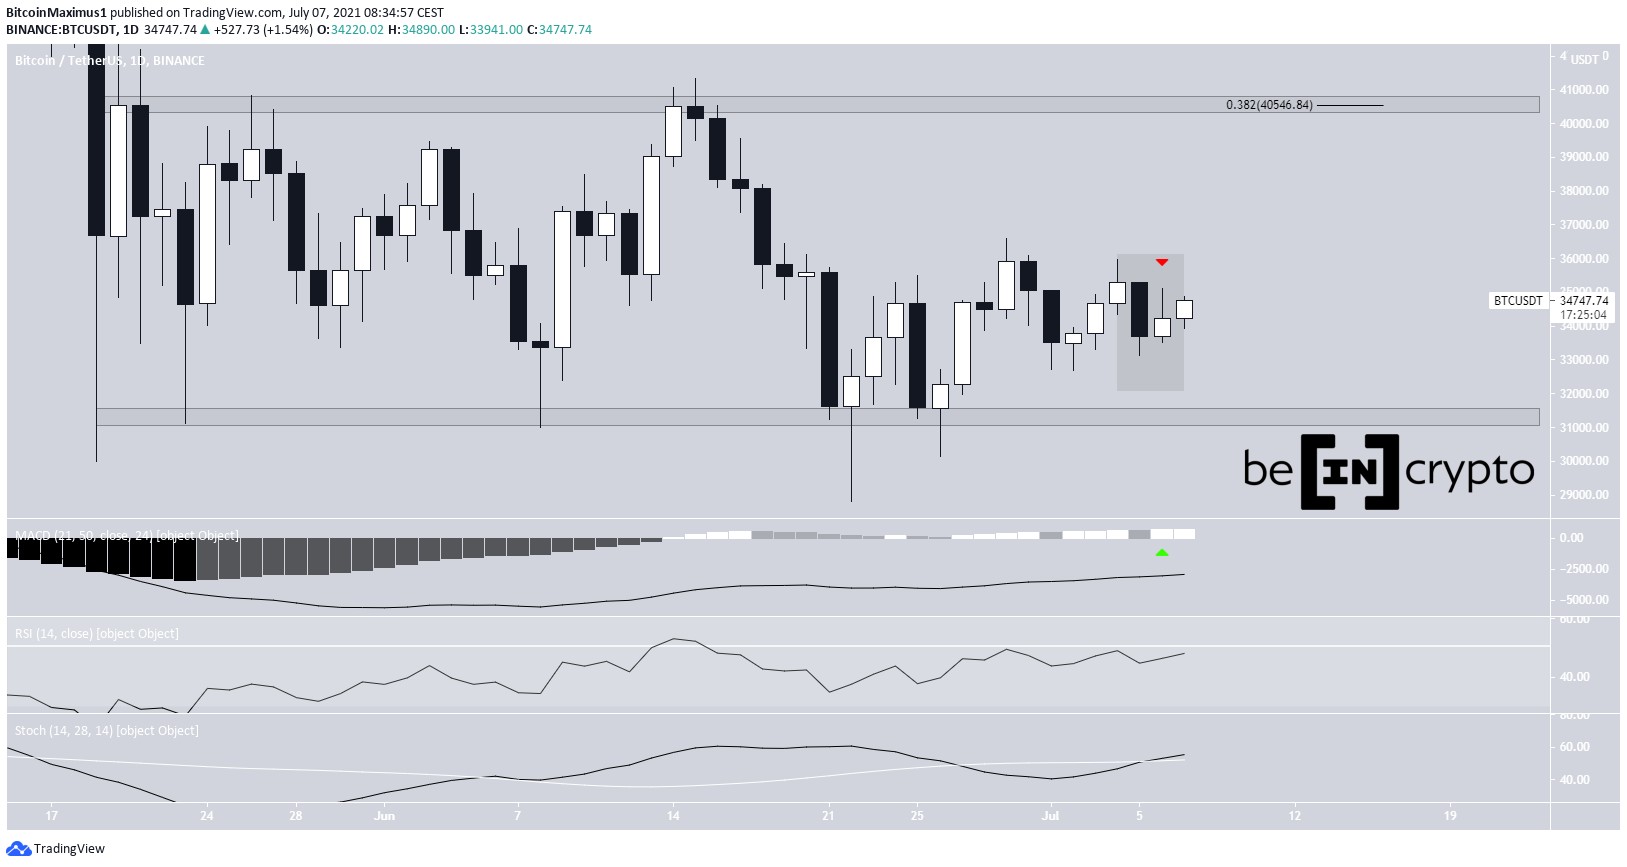
BTC (BTC) is trading inside a range between $31,400 and $40,550.
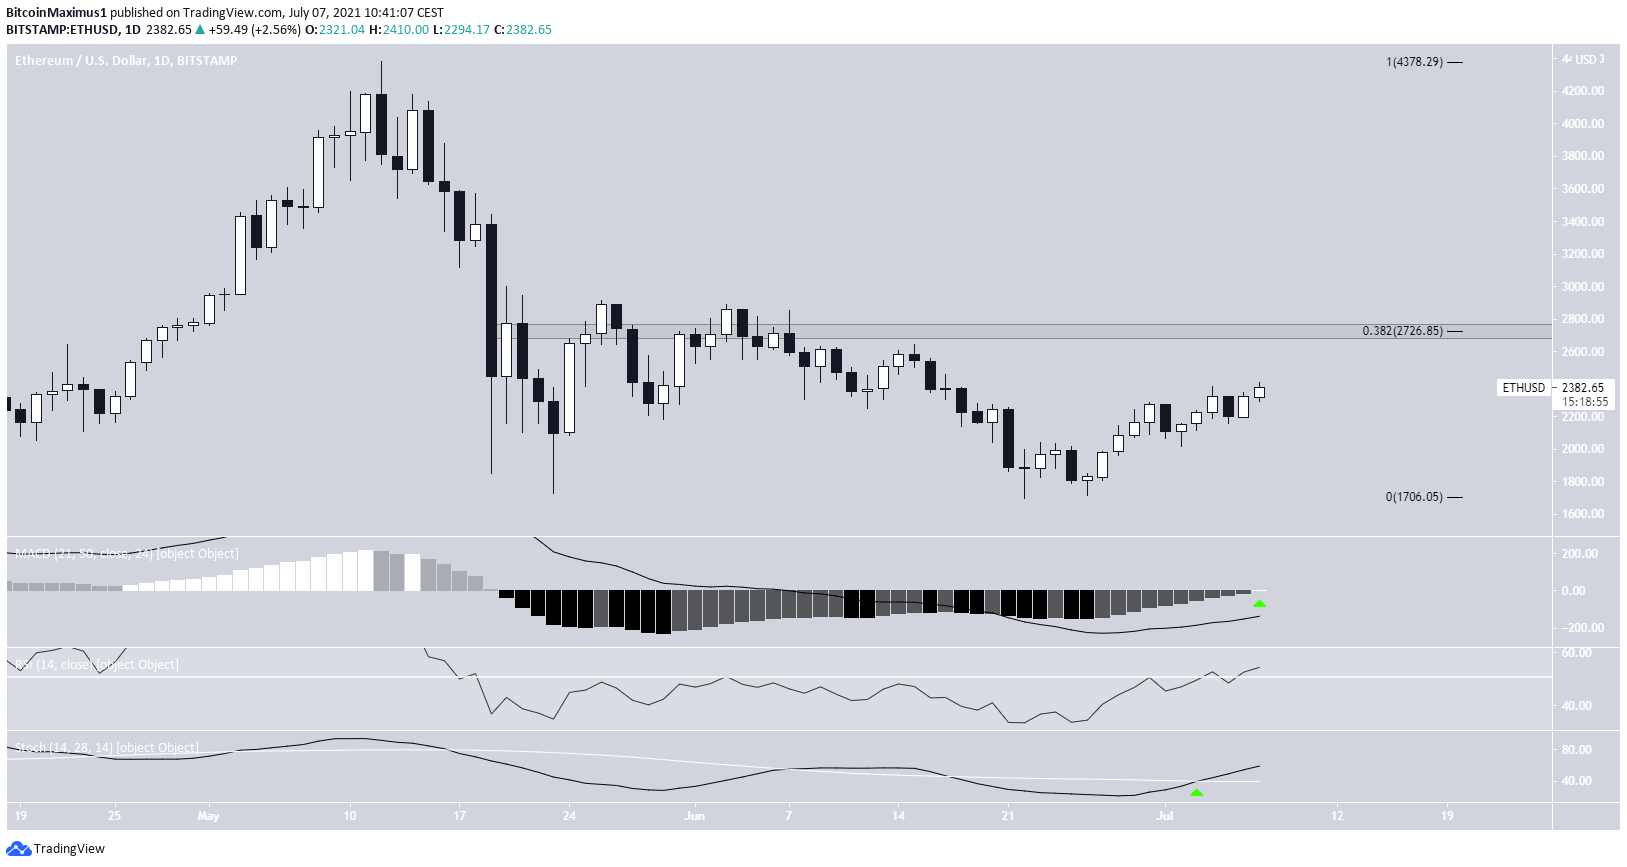
ETH (ETH) is gradually moving towards the $2,725 resistance area.
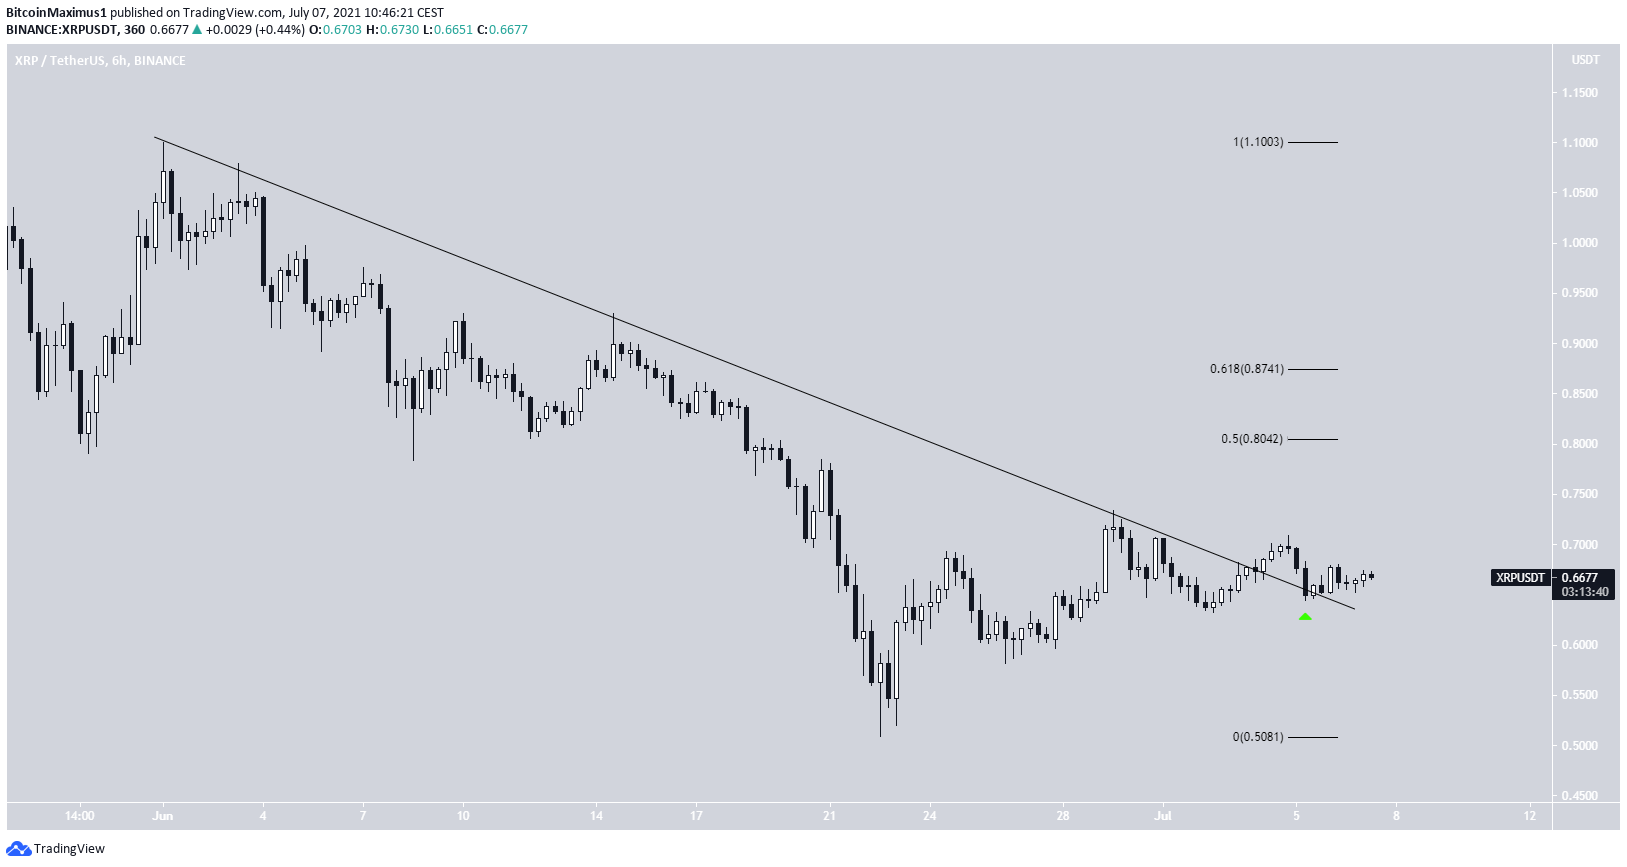
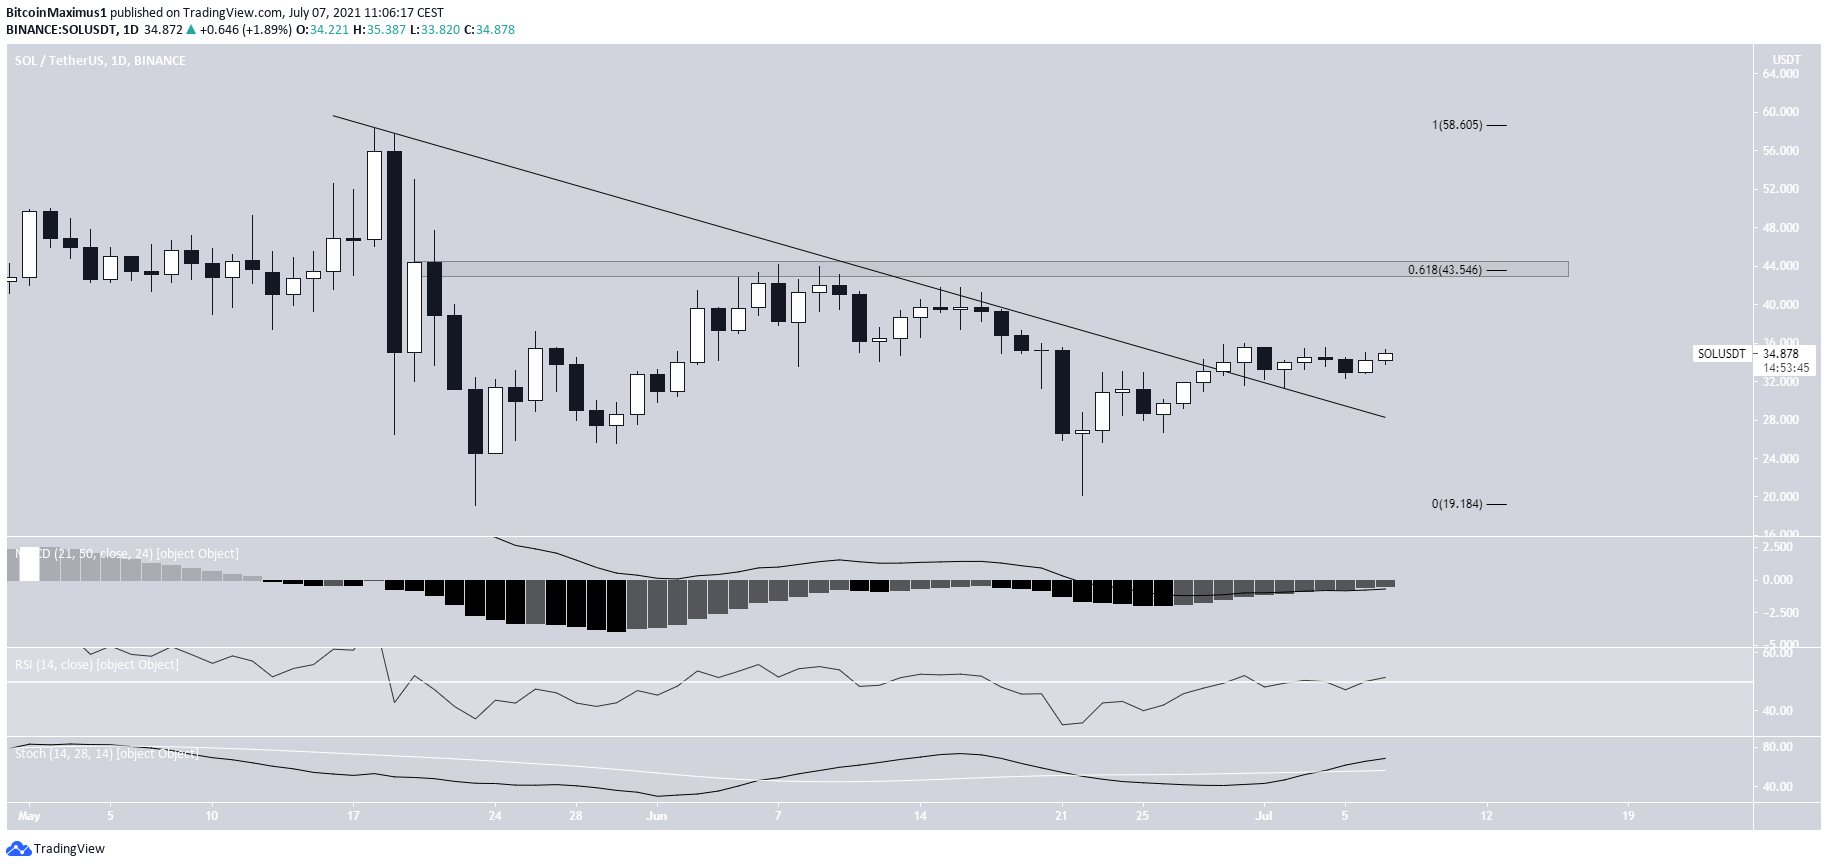
XRP (XRP), Decentraland (MANA), and Solana (SOL) have broken out from descending resistance lines.
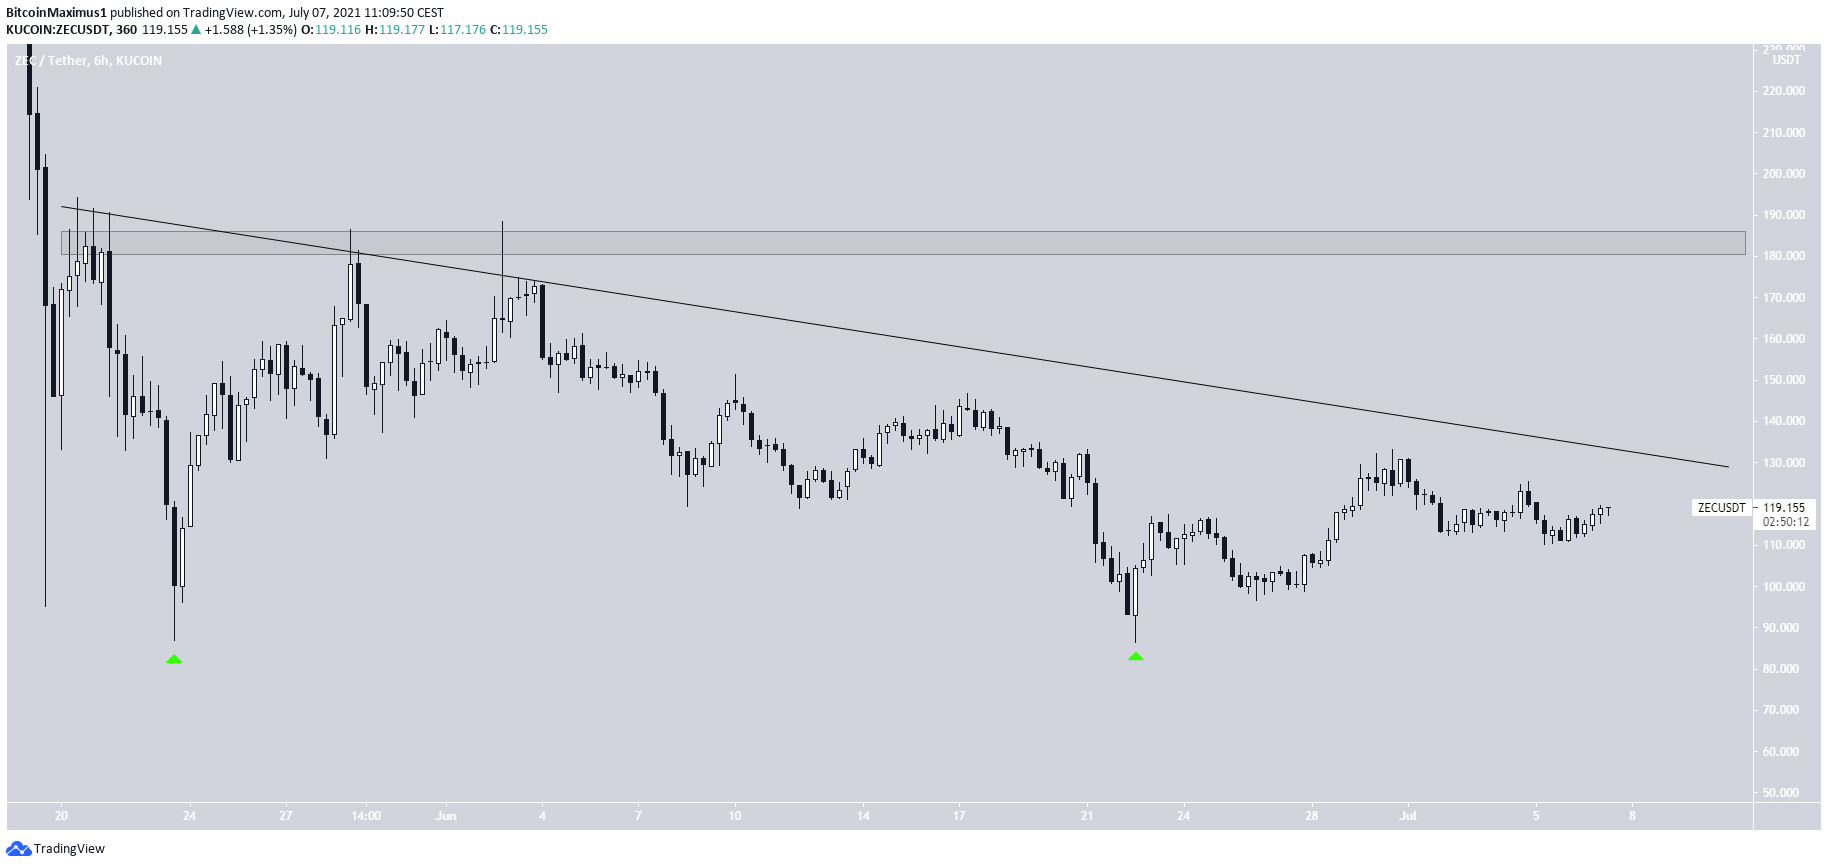
Zcash (ZEC) has created a double bottom pattern but is still following a descending resistance line.
Harmony (ONE) is in the process of moving above a descending resistance line.
BTC
BTC decreased considerably on July 5, creating a bearish engulfing candlestick. It regained its footing the next day, even though it left a long upper wick in place.
The MACD did not generate a bearish reversal signal and instead made a higher momentum bar. In addition to this, the Stochastic oscillator has made a bullish cross.
The closest support and resistance levels are found at $31,400 and $40,550.
A move towards the range highs could occur.
ETH
ETH has been increasing since reaching a local low of $1,700 on June 22. It created its first higher low on July 2.
Technical indicators provide a bullish outlook. The MACD histogram is positive, the RSI has moved above 50, and the Stochastic oscillator has made a bullish cross.
The closest resistance is created by the 0.382 Fib retracement level at $2,725.
XRP
XRP has been decreasing alongside a descending resistance line since June 1. After four unsuccessful breakout attempts, it managed to move above the line on July 4 and validated it as support the next day (green icon).
The closest resistance area is found between the 0.5-0.618 Fib retracement resistance levels at $0.804-$0.874.
SOL
SOL had been following a descending resistance line since May 18, after reaching an all-time high price of $58.38.
After hitting a low of $20.18 on June 22, it began an upward move and broke out from this descending resistance line.
Technical indicators are bullish, supporting the continuation of the upward movement. The RSI has just crossed above 50 and the Stochastic oscillator has made a bullish cross.
The closest resistance area is found at $43.50 (0.618 Fib retracement resistance level).
ZEC
On May 23, ZEC reached a low of $86.85 and rebounded. However, this only served to validate the $184 area as resistance alongside a descending resistance line.
ZEChas been moving downwards since. On June 22, it reached a low of $86.33, completing a double bottom pattern.
While it has been moving upwards, it has yet to break out from the descending resistance line.
MANA
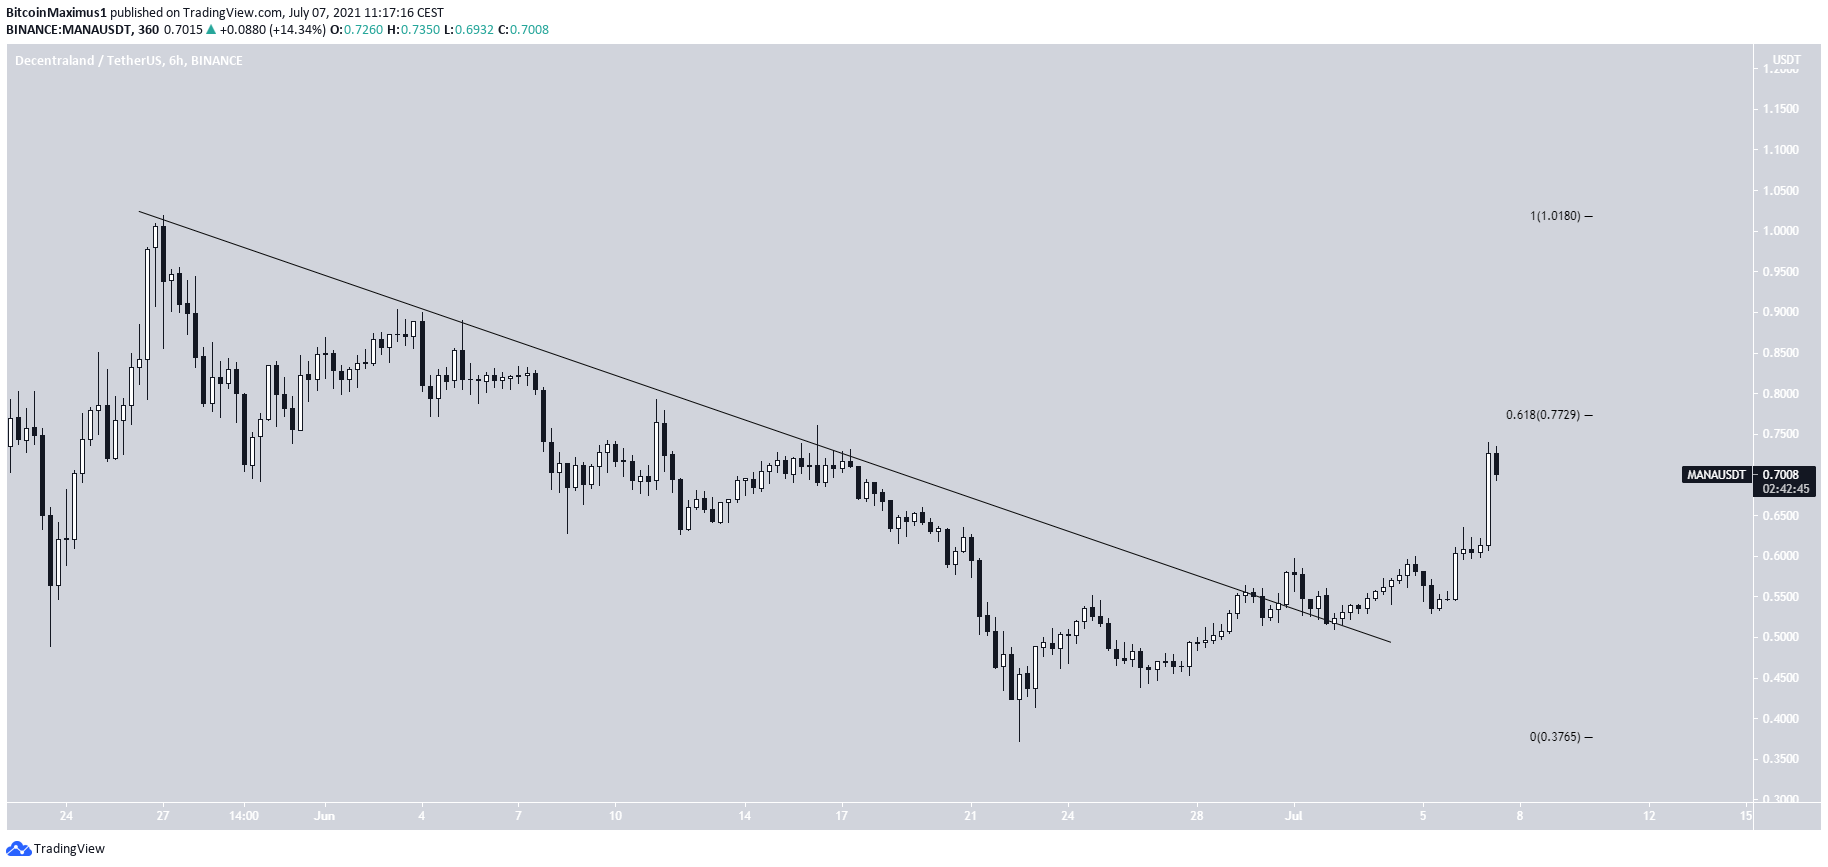
MANA had been following a descending resistance line since May 27, after reaching a high of $1.018. After four unsuccessful breakout attempts, it managed to move above the resistance on July 1, and validated it as support two days later.
It has been moving upwards since then, increasing sharply on July 7. MANA is currently trading very close to the $0.77 resistance area, which is the 0.618 Fib retracement resistance level. An increase above this level could likely trigger an upward move toward $1.01.
ONE
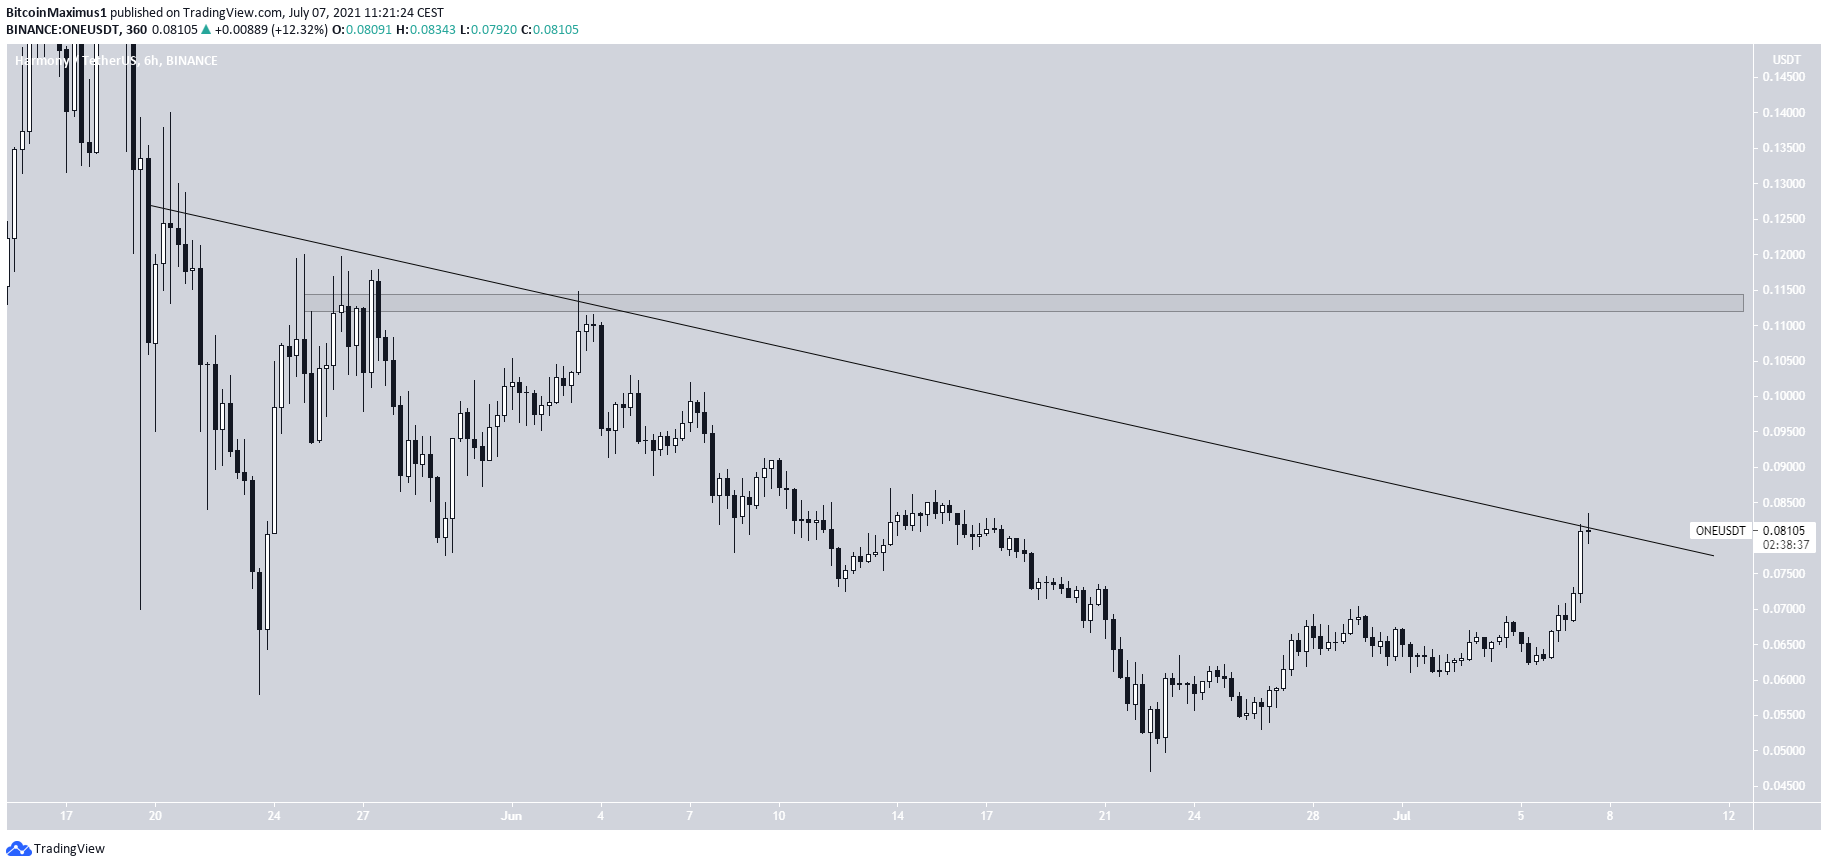
ONE has been following a descending resistance line since May 20.
It reached a low of $0.047 on June 22 and began to move upwards shortly after.
ONE has reached the resistance line again, on its fourth attempt. A breakout would likely take the price toward the $0.112 resistance area.
For BeInCrypto’s latest BTC (BTC) analysis, click here.
The post BTC, ETH, XRP, SOL, ZEC, MANA, ONE — Technical Analysis July 7 appeared first on BeInCrypto.


![Decentraland: Review & Beginner's Guide [current_date format=Y] 38 Decentraland: Review & Beginner's Guide](https://cryptheory.org/wp-content/uploads/2020/11/decentraland-02-gID_7-300x150.jpg)