BTC, ETH, XRP, TRX, EOS, XVG, SUSHI—Technical Analysis May 6
3 min readTable of Contents
BTC (BTC) bounced at the $53,000 support area on May 5, creating a bullish engulfing candlestick in the process.
TRON (TRX) has been increasing since bouncing at the long-term $0.09 support area.
ETH (ETH) has reached a long-term reversal area and is showing short-term signs of weakness.
XRP (XRP) has been moving upwards since bouncing at the 1,850 satoshi support area.
EOS (EOS) is in the process of breaking out from a long-term resistance level.
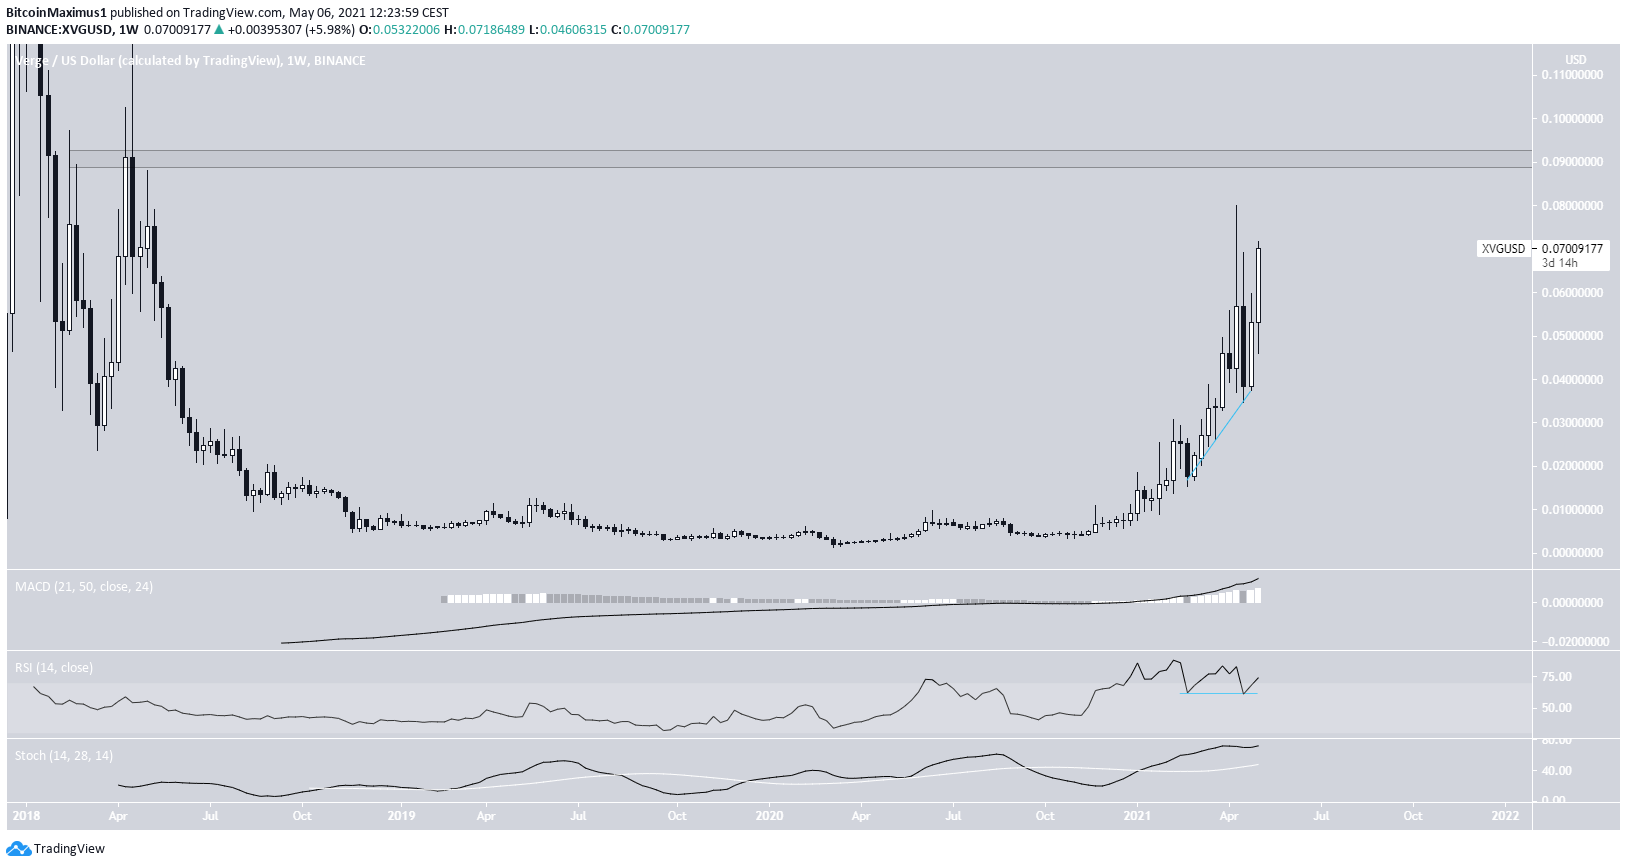
Verge (XVG) is approaching the $0.09 resistance area.
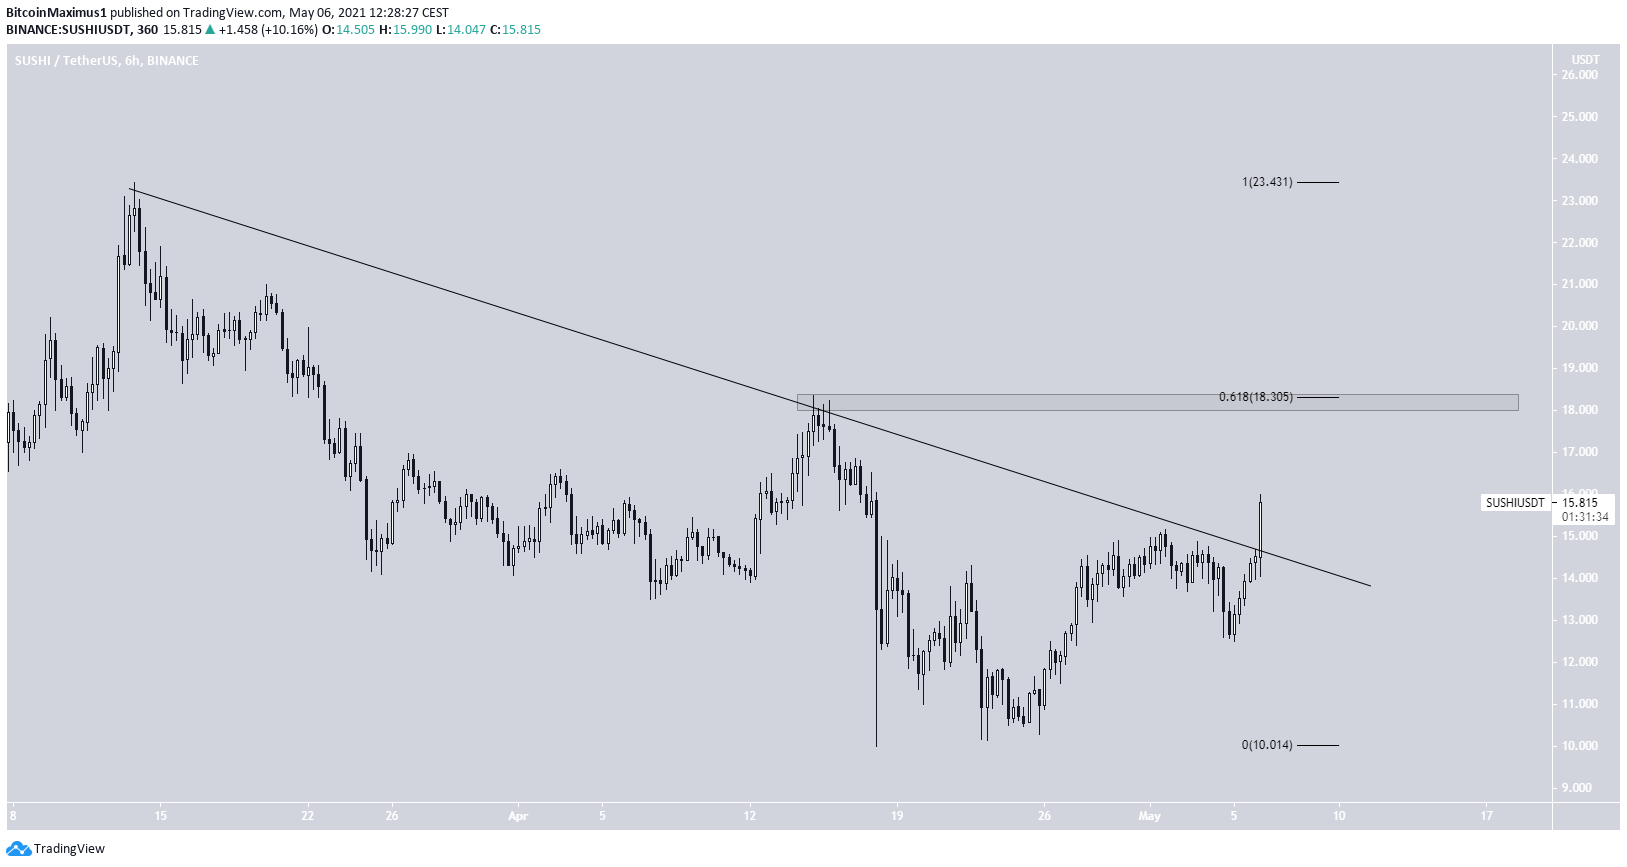
SushiSwap (SUSHI) has broken out from a descending resistance line.
BTC
On May 5, BTC reached the $53,000 support area and created a bullish engulfing candlestick. This is a positive sign that suggests the bullish trend and the price action is likely to head higher.
Technical indicators also suggest that the trend is bullish. This is especially evident by the bullish cross (green arrow) in the Stochastic oscillator.

ETH
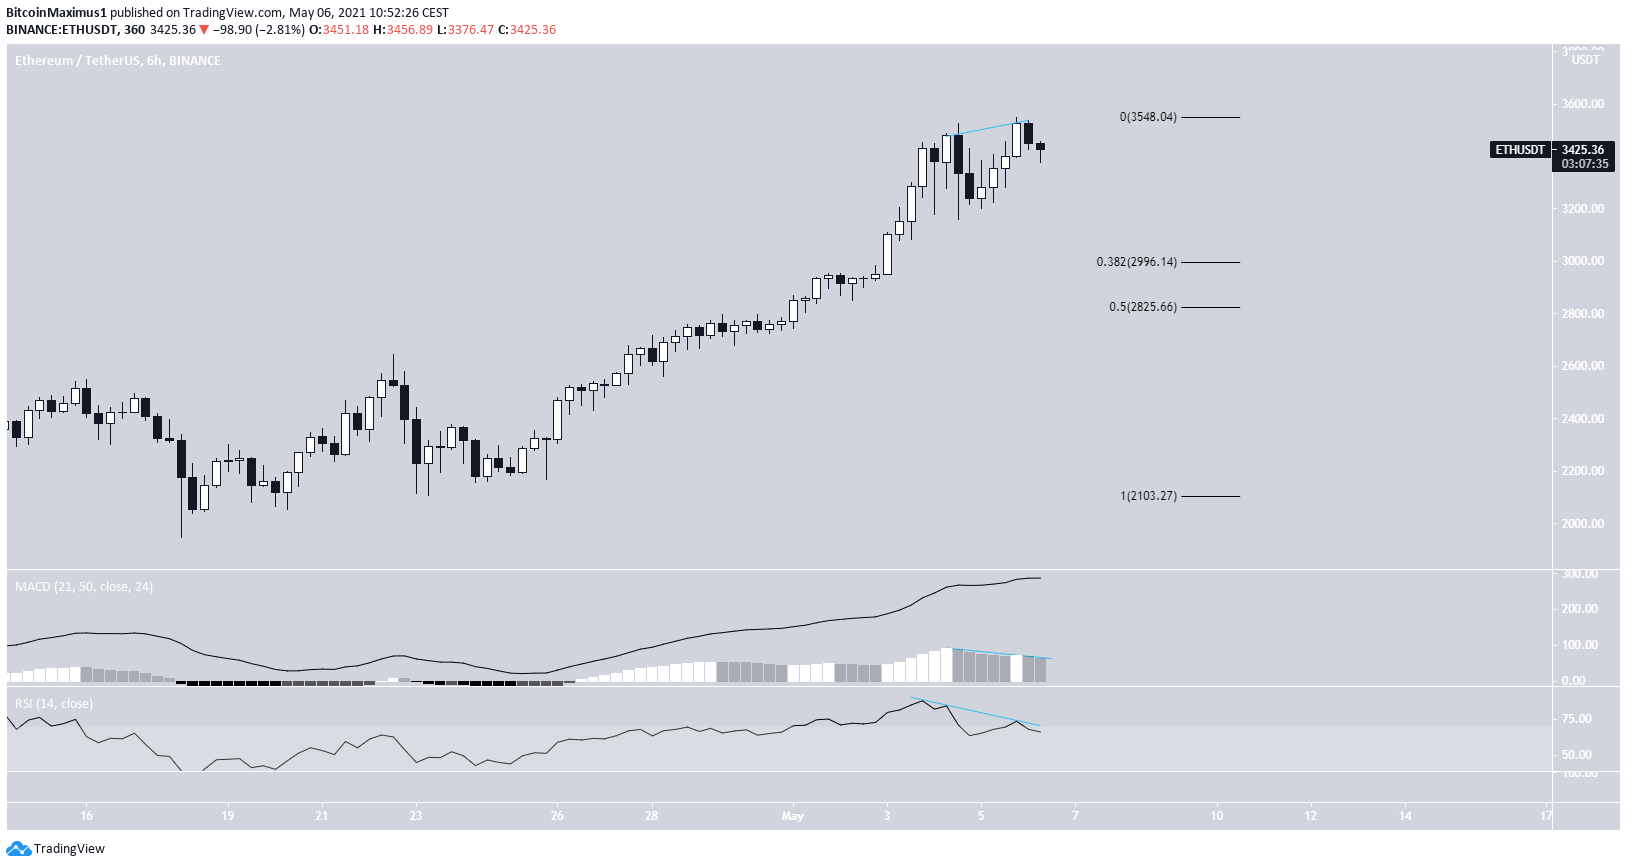
On May 5, ETH reached a new all-time high price of $3,549, but has decreased slightly since.
The drop was preceded by a bearish divergence in both the RSI and the MACD. Therefore, it’s possible that this was a short-term double top pattern.
If so, the closest support areas are found at $3,000 and $2,826.
In addition, ETH has reached a likely long-term reversal area.
XRP/BTC
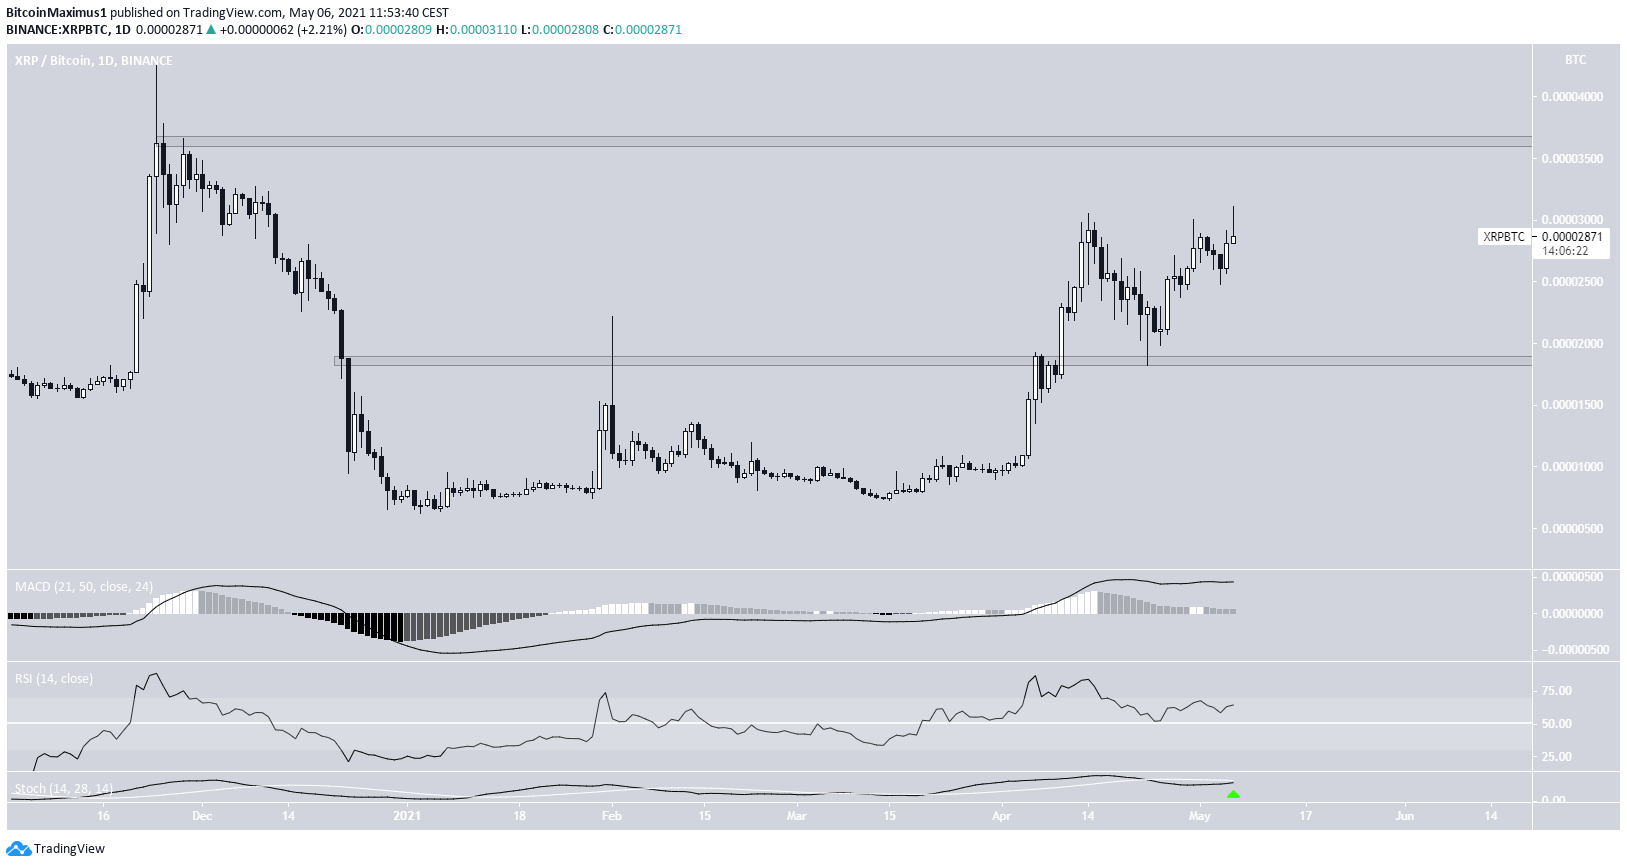
On April 23, XRP validated the 1,850 satoshi area as support, creating a hammer candlestick in the process. It has been moving upwards since.
Technical indicators are bullish and support the continuation of the upward movement.
The next closest resistance area is found at 3,600 satoshis. A breakout above it could trigger a very rapid price increase.
For an XRP/USD analysis, click here.
TRX
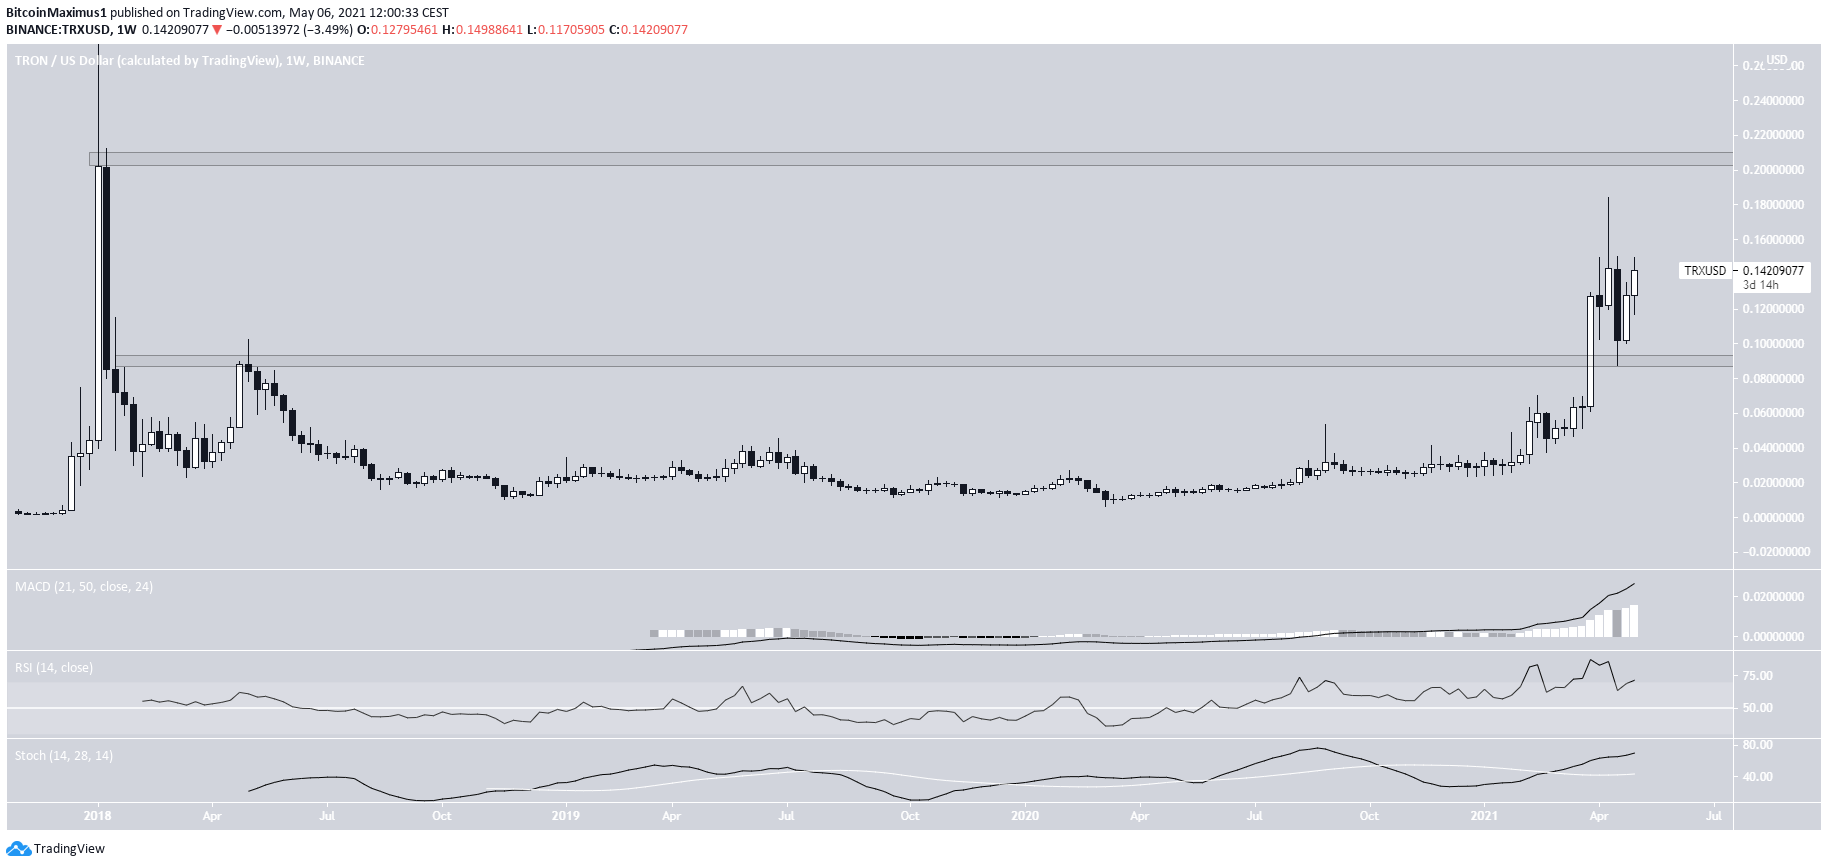
On April 23, TRX returned in order to validate the long-term $0.09 area as support. It has been moving upwards since.
Technical indicators in the weekly time frame support the continuation of the upward movement.
The next resistance area is found at $0.205. If it manages to clear this level, the price is expected to move towards a new all-time high.
EOS
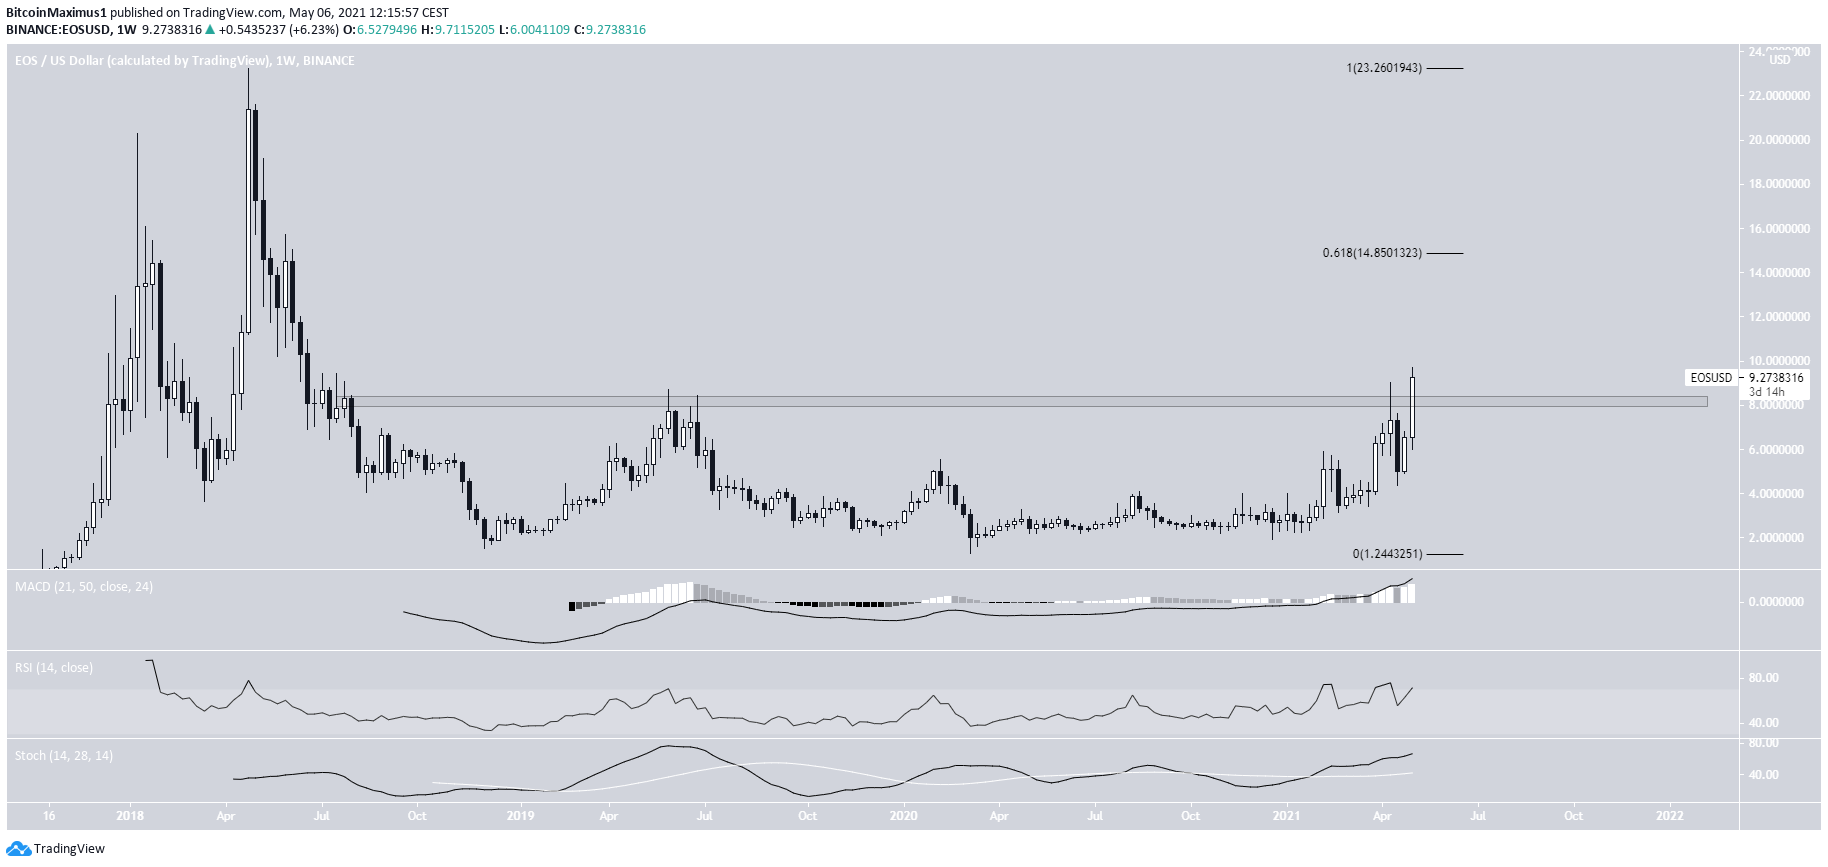
EOS has increased considerably this past week and is in the process of breaking out from the $8.50 resistance area. It has not reached a close above this level since early 2018.
If successful in breaking out, the next resistance would be found at $14.70. This is the 0.618 Fib retracement of the previous downward movement.
Similar to TRX, technical indicators in the weekly time frame are bullish.
XVG
XVG has been moving upwards with strength over the past two weeks. The increase was preceded by a considerable hidden bullish divergence in the RSI.
The next resistance area is found at $0.09.
If XVG manages to break out above this level, the rate of increase could quickly become parabolic.
SUSHI
SUSHI has been following a descending resistance line since reaching an all-time high price of $23.43 on March 13.
After three unsuccessful attempts, it’s currently in the process of breaking out.
The next resistance area is found at $18.30, while the next one beyond that would be at the $23.43 high.
For BeInCrypto’s latest BTC (BTC) analysis, click here.
The post BTC, ETH, XRP, TRX, EOS, XVG, SUSHI—Technical Analysis May 6 appeared first on BeInCrypto.


![Decentraland: Review & Beginner's Guide [current_date format=Y] 38 Decentraland: Review & Beginner's Guide](https://cryptheory.org/wp-content/uploads/2020/11/decentraland-02-gID_7-300x150.jpg)