BTC, ETH, XRP, TRX, IOTA, NEO, ATOM: Technical Analysis March 23
3 min readTable of Contents
BTC (BTC) and ETH (ETH) are attempting to find support between their 0.5-0.618 Fib retracement levels.
XRP (XRP) is following a descending resistance line. It is expected to break out.
TRON (TRX) has fallen below the $0.061 support level, but is expected to reclaim it.
Iota (IOTA) has broken out from a descending resistance line.
Neo (NEO) and Cosmos (ATOM) are trading inside parallel ascending channels. They have failed to break out above a crucial resistance areas.
BTC (BTC)
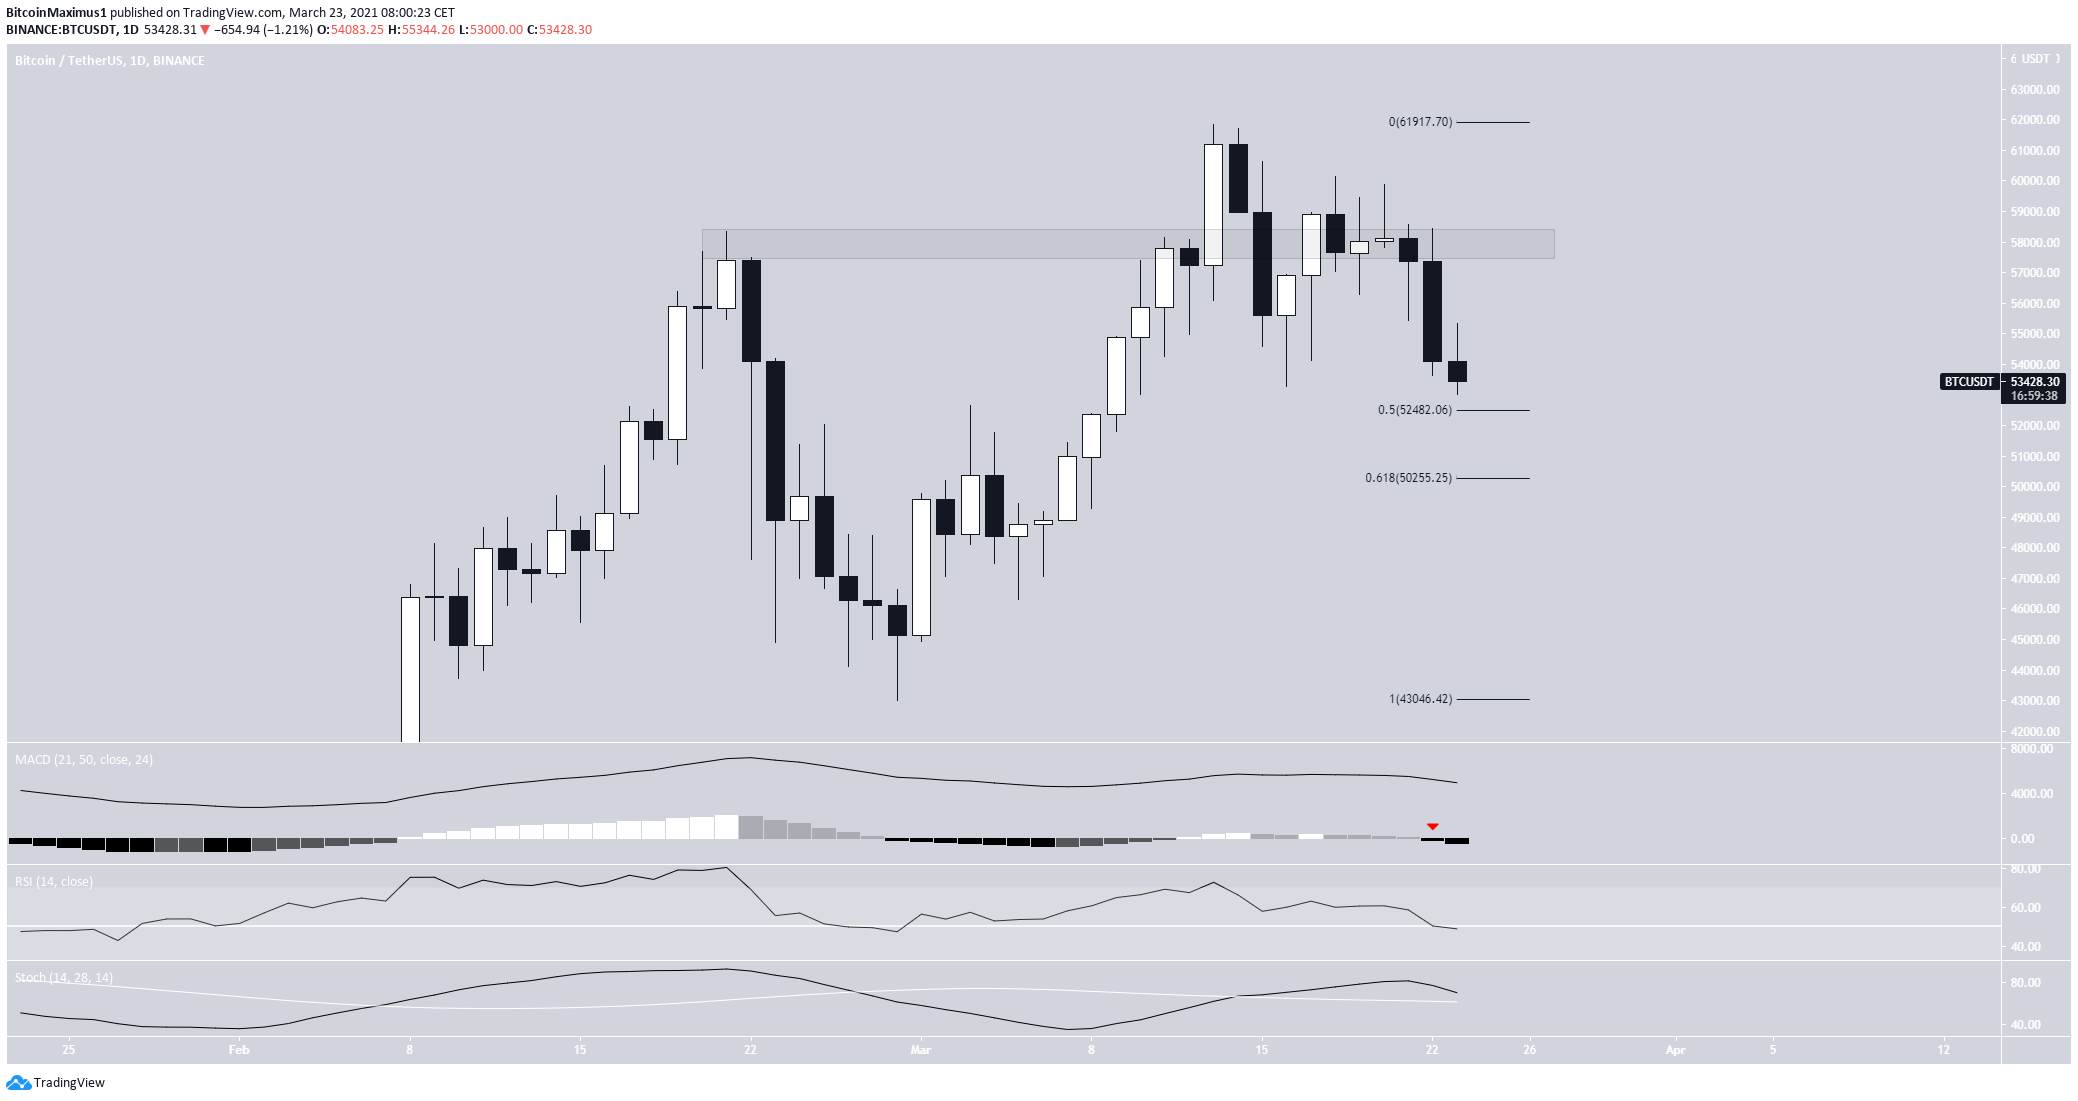
BTC has been decreasing since reaching an all-time high of $61,884. It has since fallen below the $57,800 level, validating it as resistance.
Currently, BTC is trading just above the $52,500-$50,250 support area. This range is created by the 0.5-0.618 Fib retracement levels. A bounce is expected at this level.
Technical indicators are undecided. Nevertheless, BTC is expected to eventually reach a new all-time high price.
ETH (ETH)
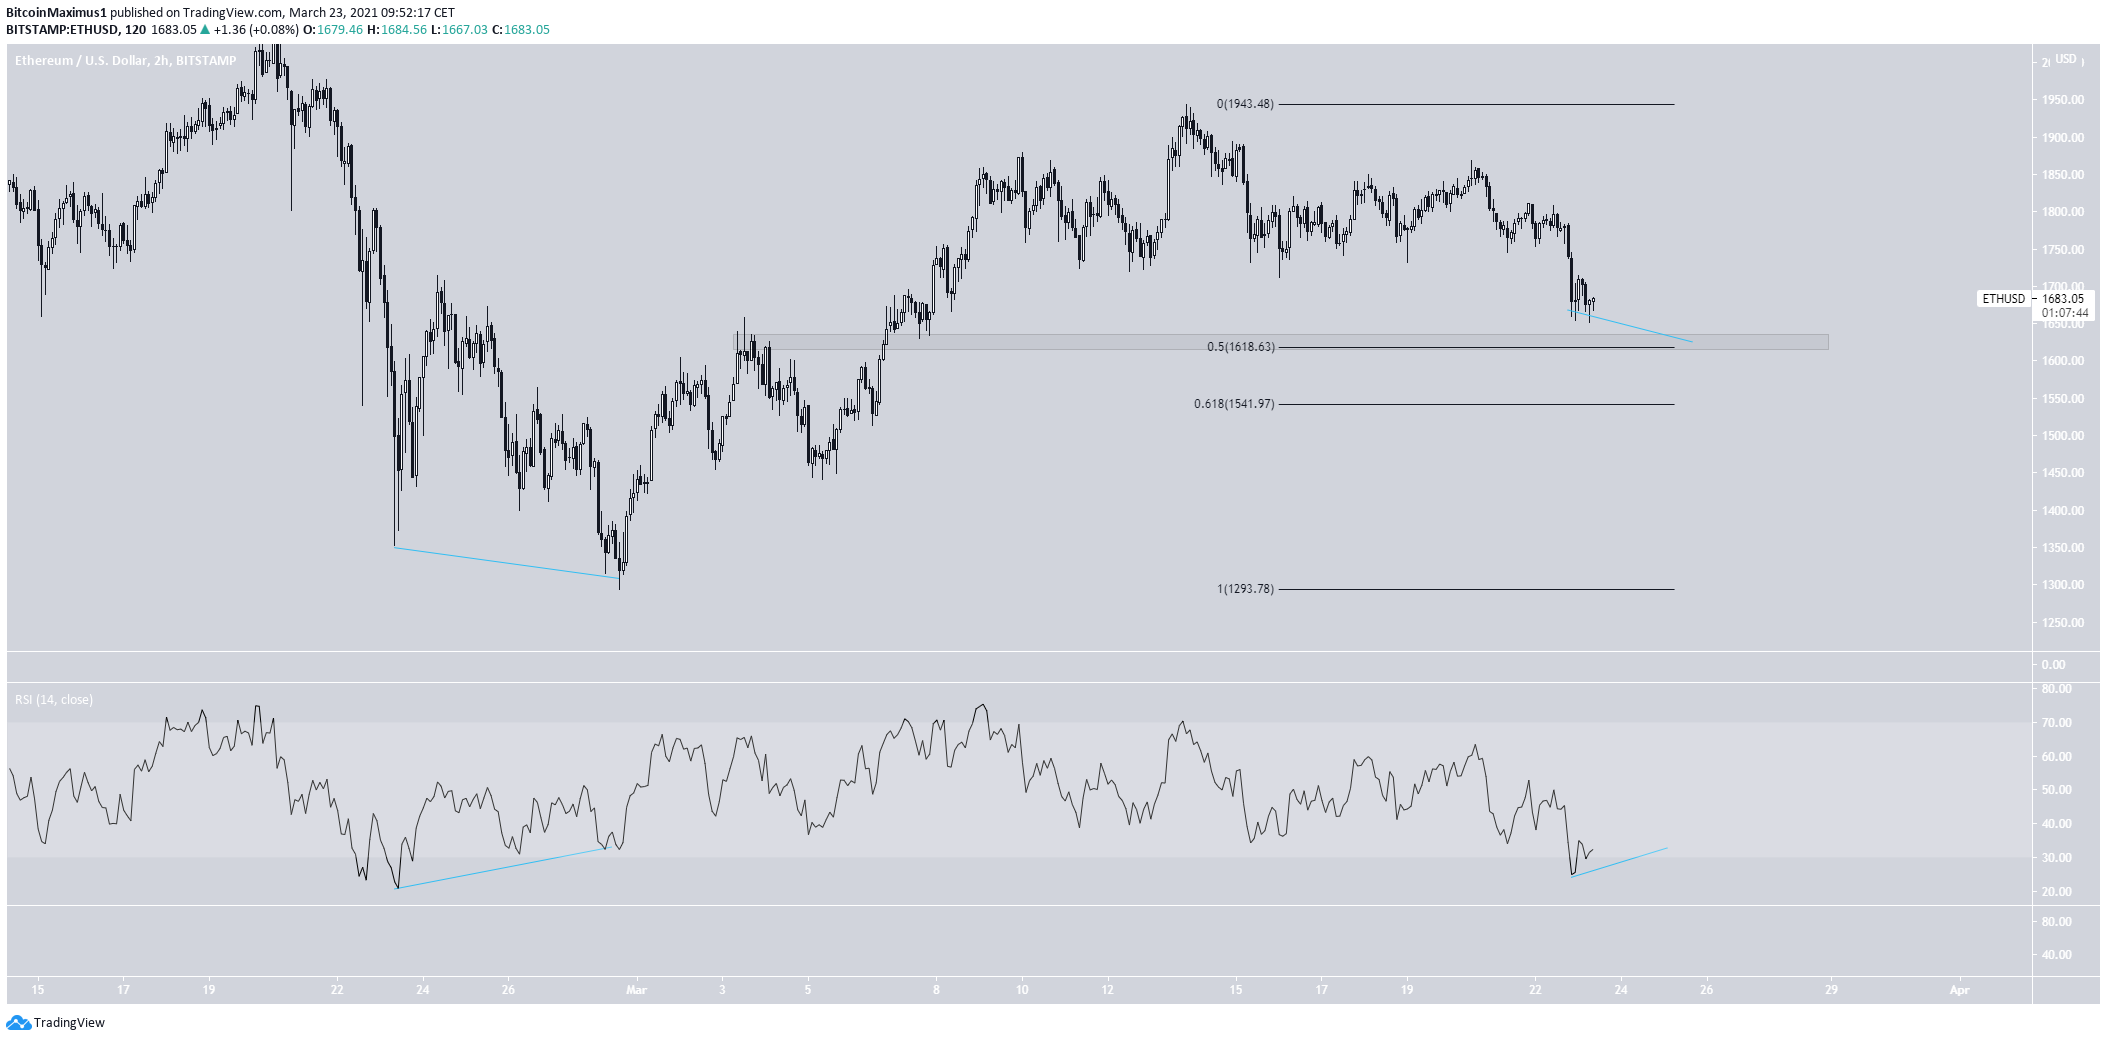
ETH has been moving downwards since March 13, when a high of $1,943 was reached.
Currently, ETH is approaching the main support area found at $1,618. Besides being a horizontal support level, this is the 0.5 Fib retracement level of the entire upward movement.
While there are no definite reversal signs, the short-term RSI has reached oversold territory.
The previous time it did this, it generated a bullish divergence before a significant bounce.
Therefore, it’s possible that the same will occur this time.
XRP (XRP)
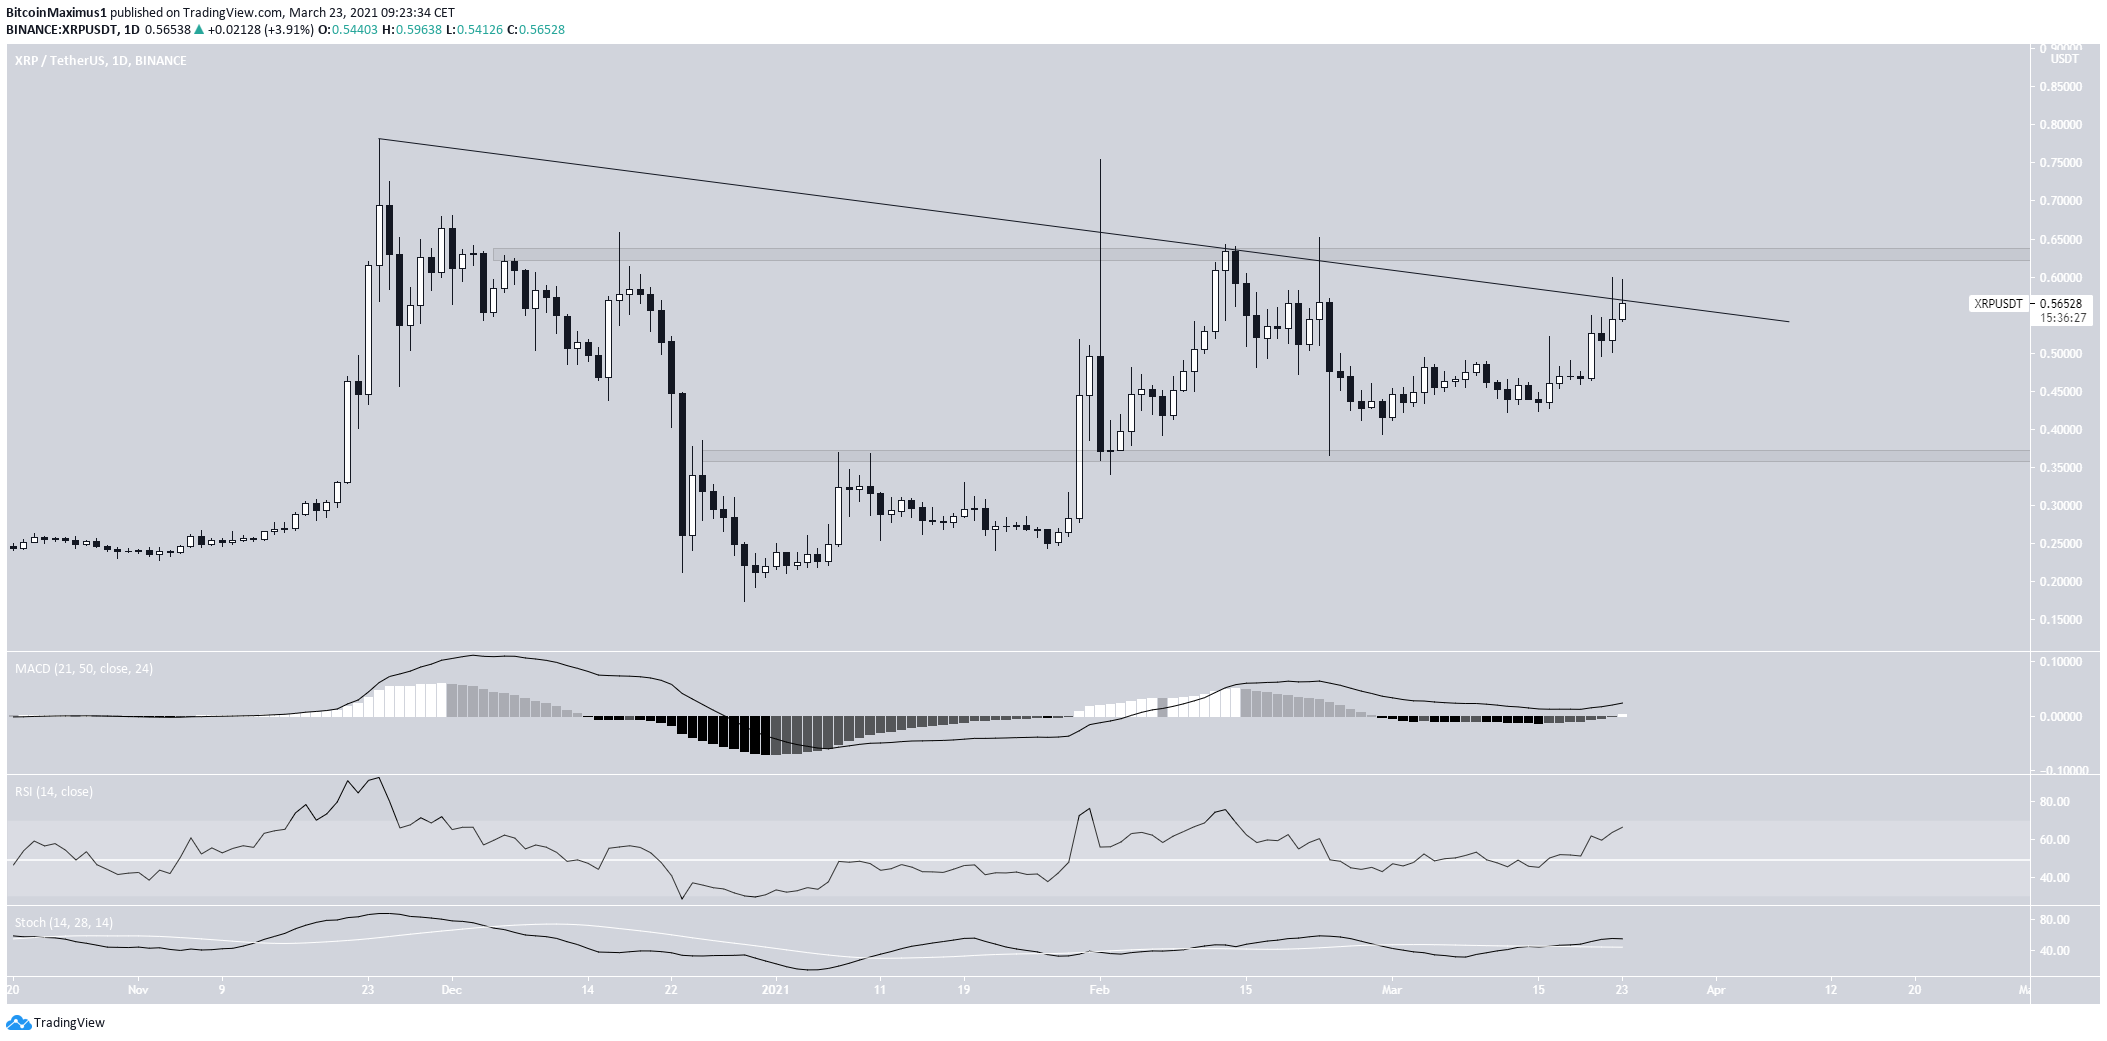
XRP has been increasing since Feb. 23, when it reached a low of $0.365. So far, it has reached a local high of $0.591.
XRP is following a descending resistance line and is currently trading just below it.
Technical indicators are bullish. The Stochastic oscillator has made a bullish cross, the MACD has turned positive, and the RSI has moved above 50.
Therefore, XRP is expected to break out.
The next closest resistance area is found at $0.63.
TRON (TRX)
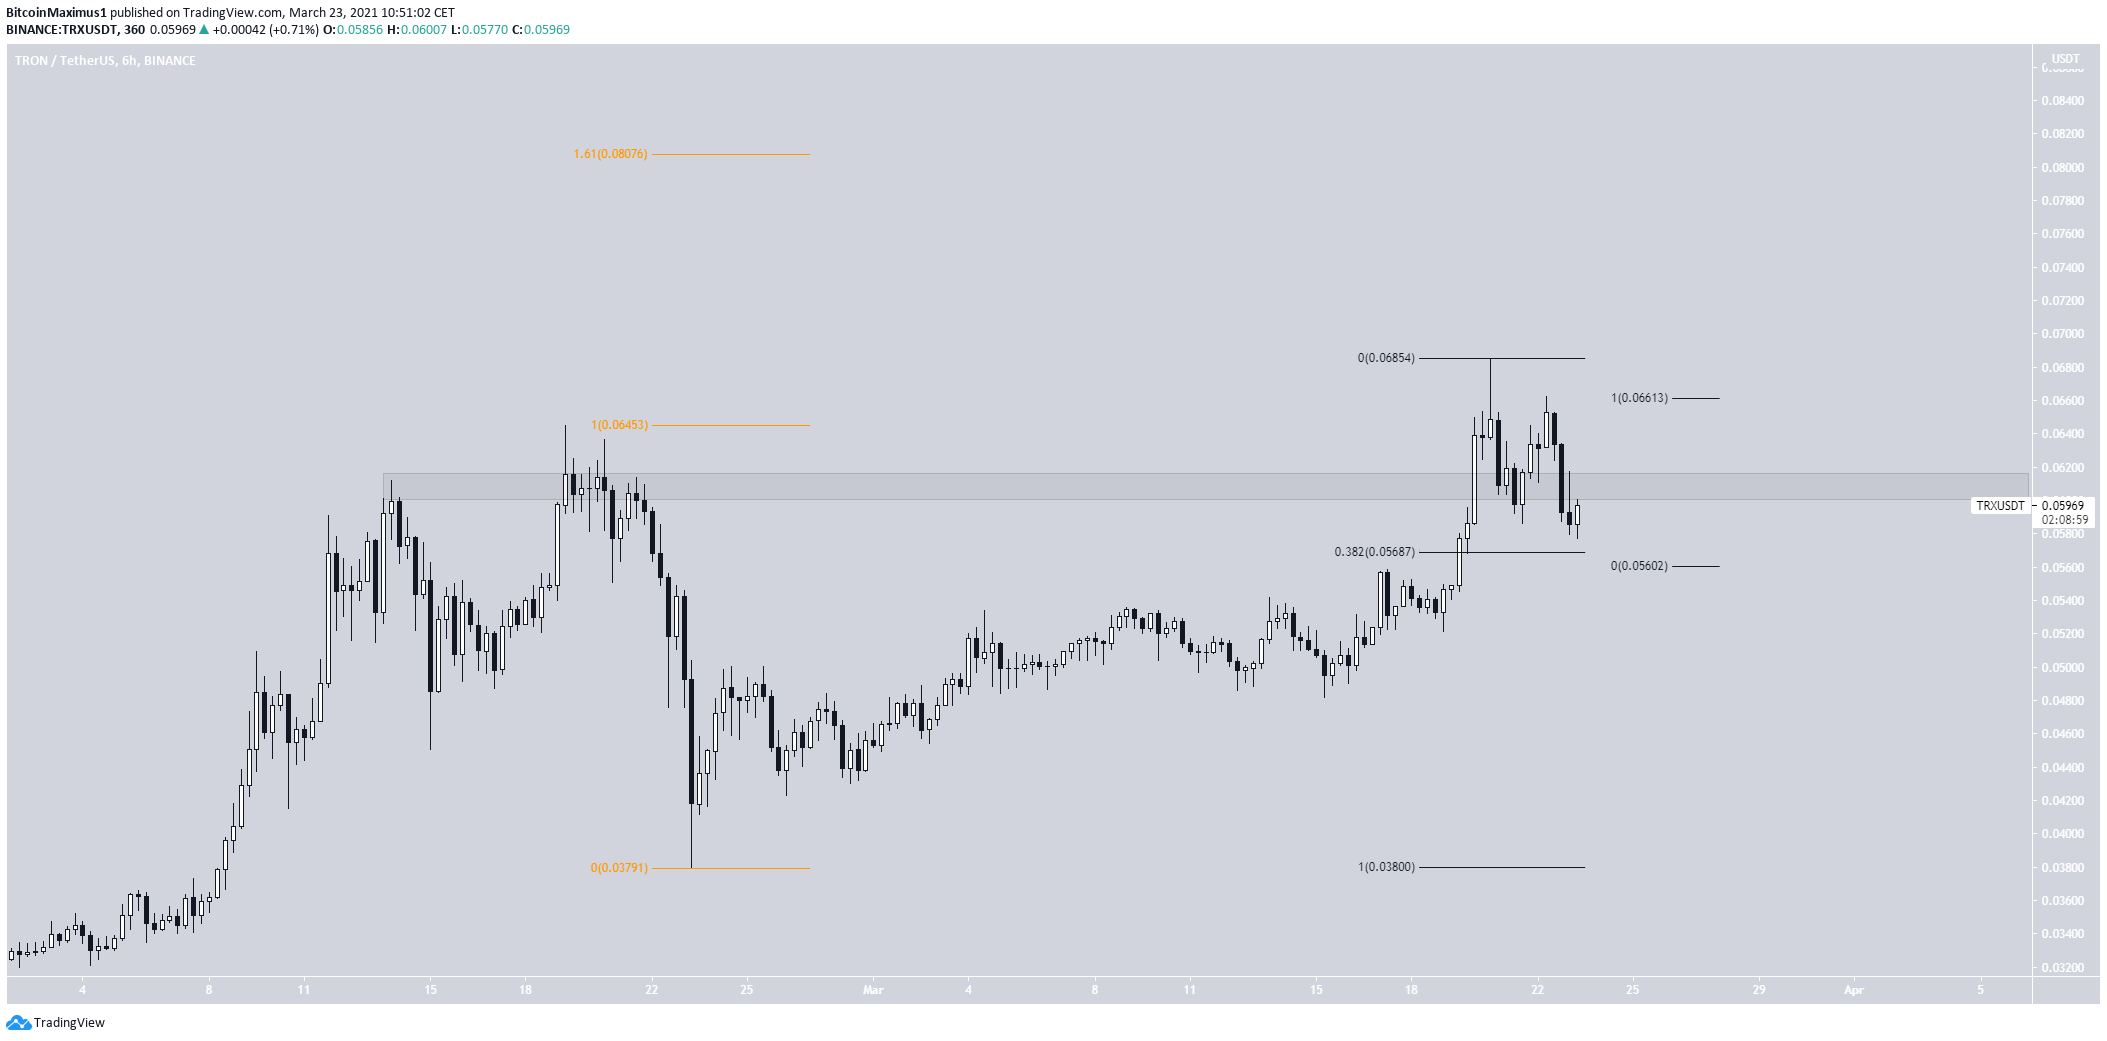
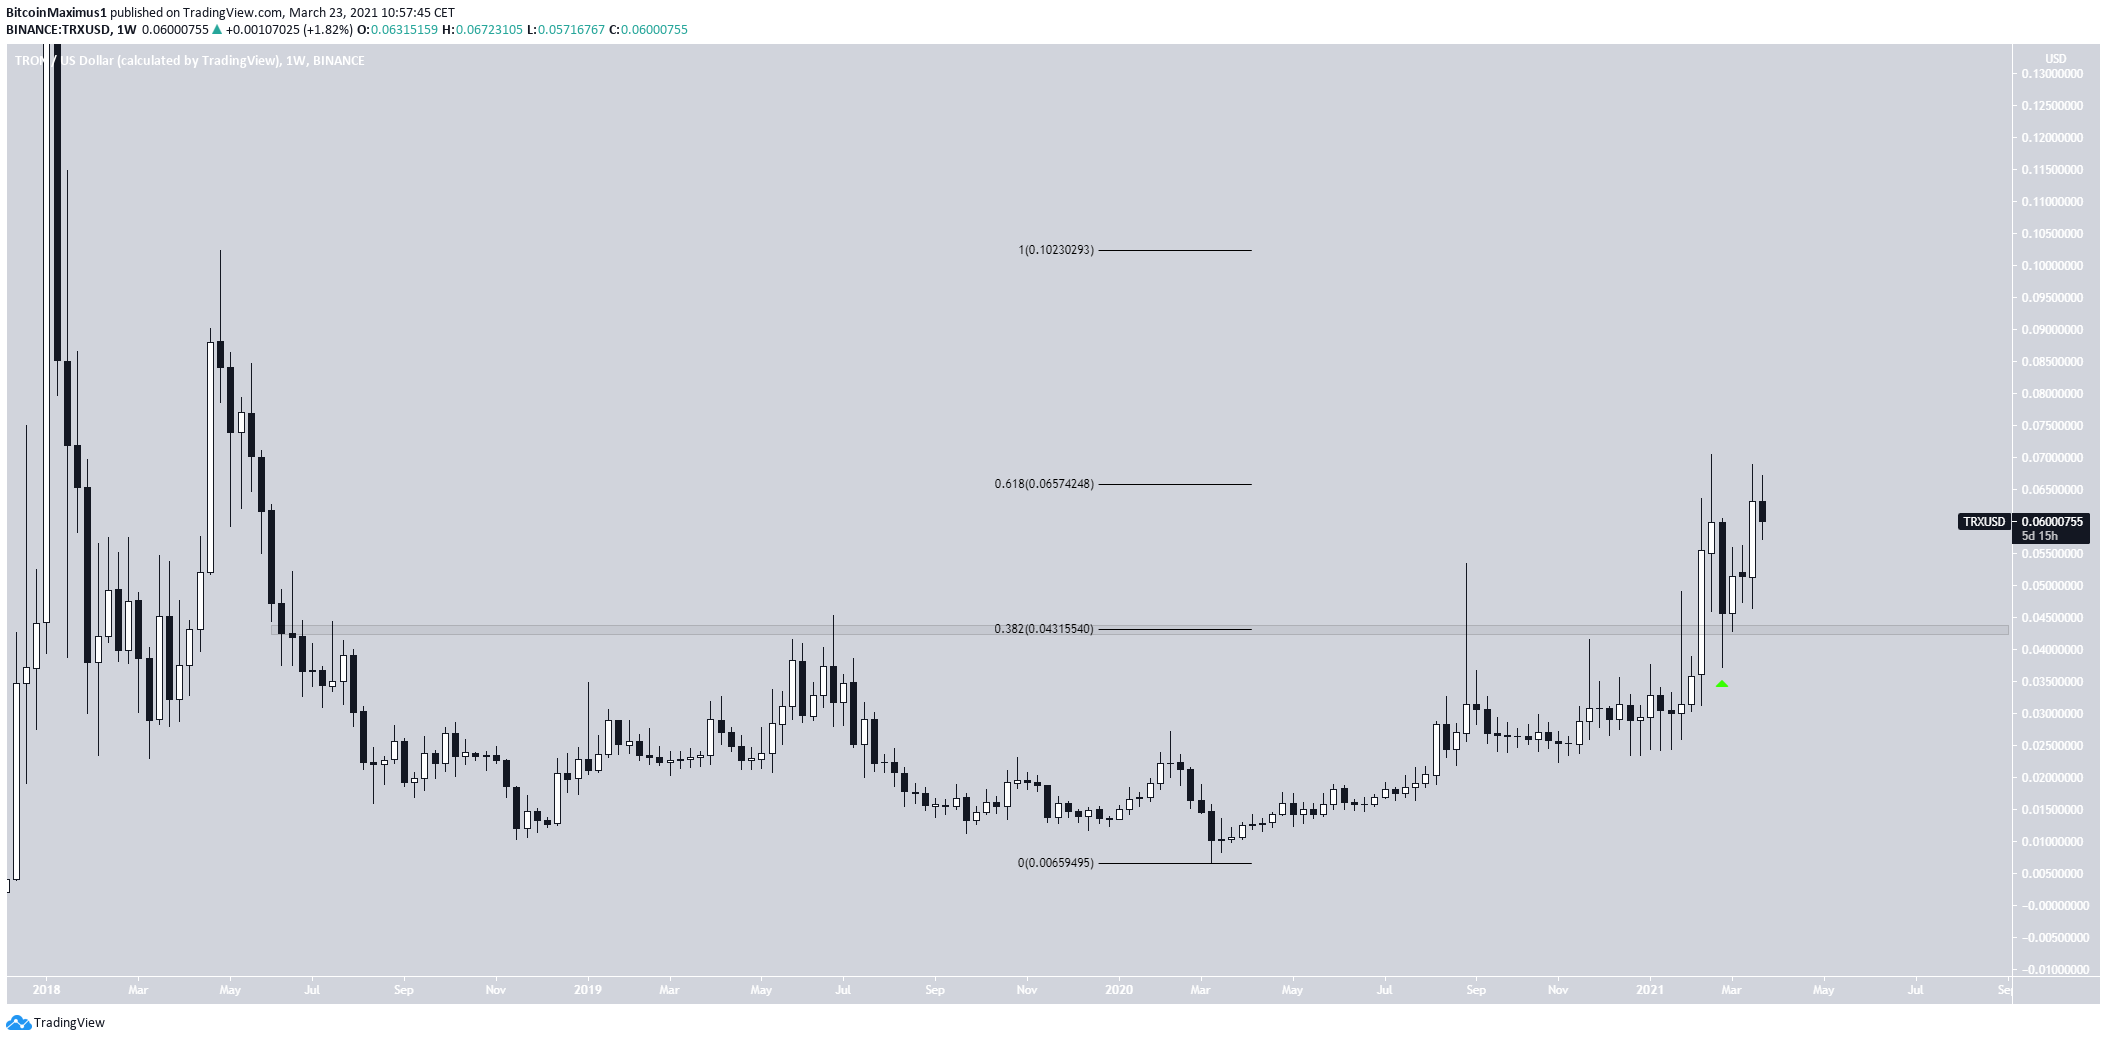
On March 20, TRX reached a high of $0.06850. This seemed to have caused a breakout above the $0.06 resistance area.
However, TRX has fallen back below this level since.
Nevertheless, there is a confluence of Fib support levels near $0.054.
It’s likely that TRX bounces near these levels and moves upwards. If so, the next resistance would be found at $0.08.
The long-term trend still remains bullish.
If TRX can clear the 0.618 Fib retracement resistance, it could eventually move all the way to $0.10.
IOTA (IOTA)
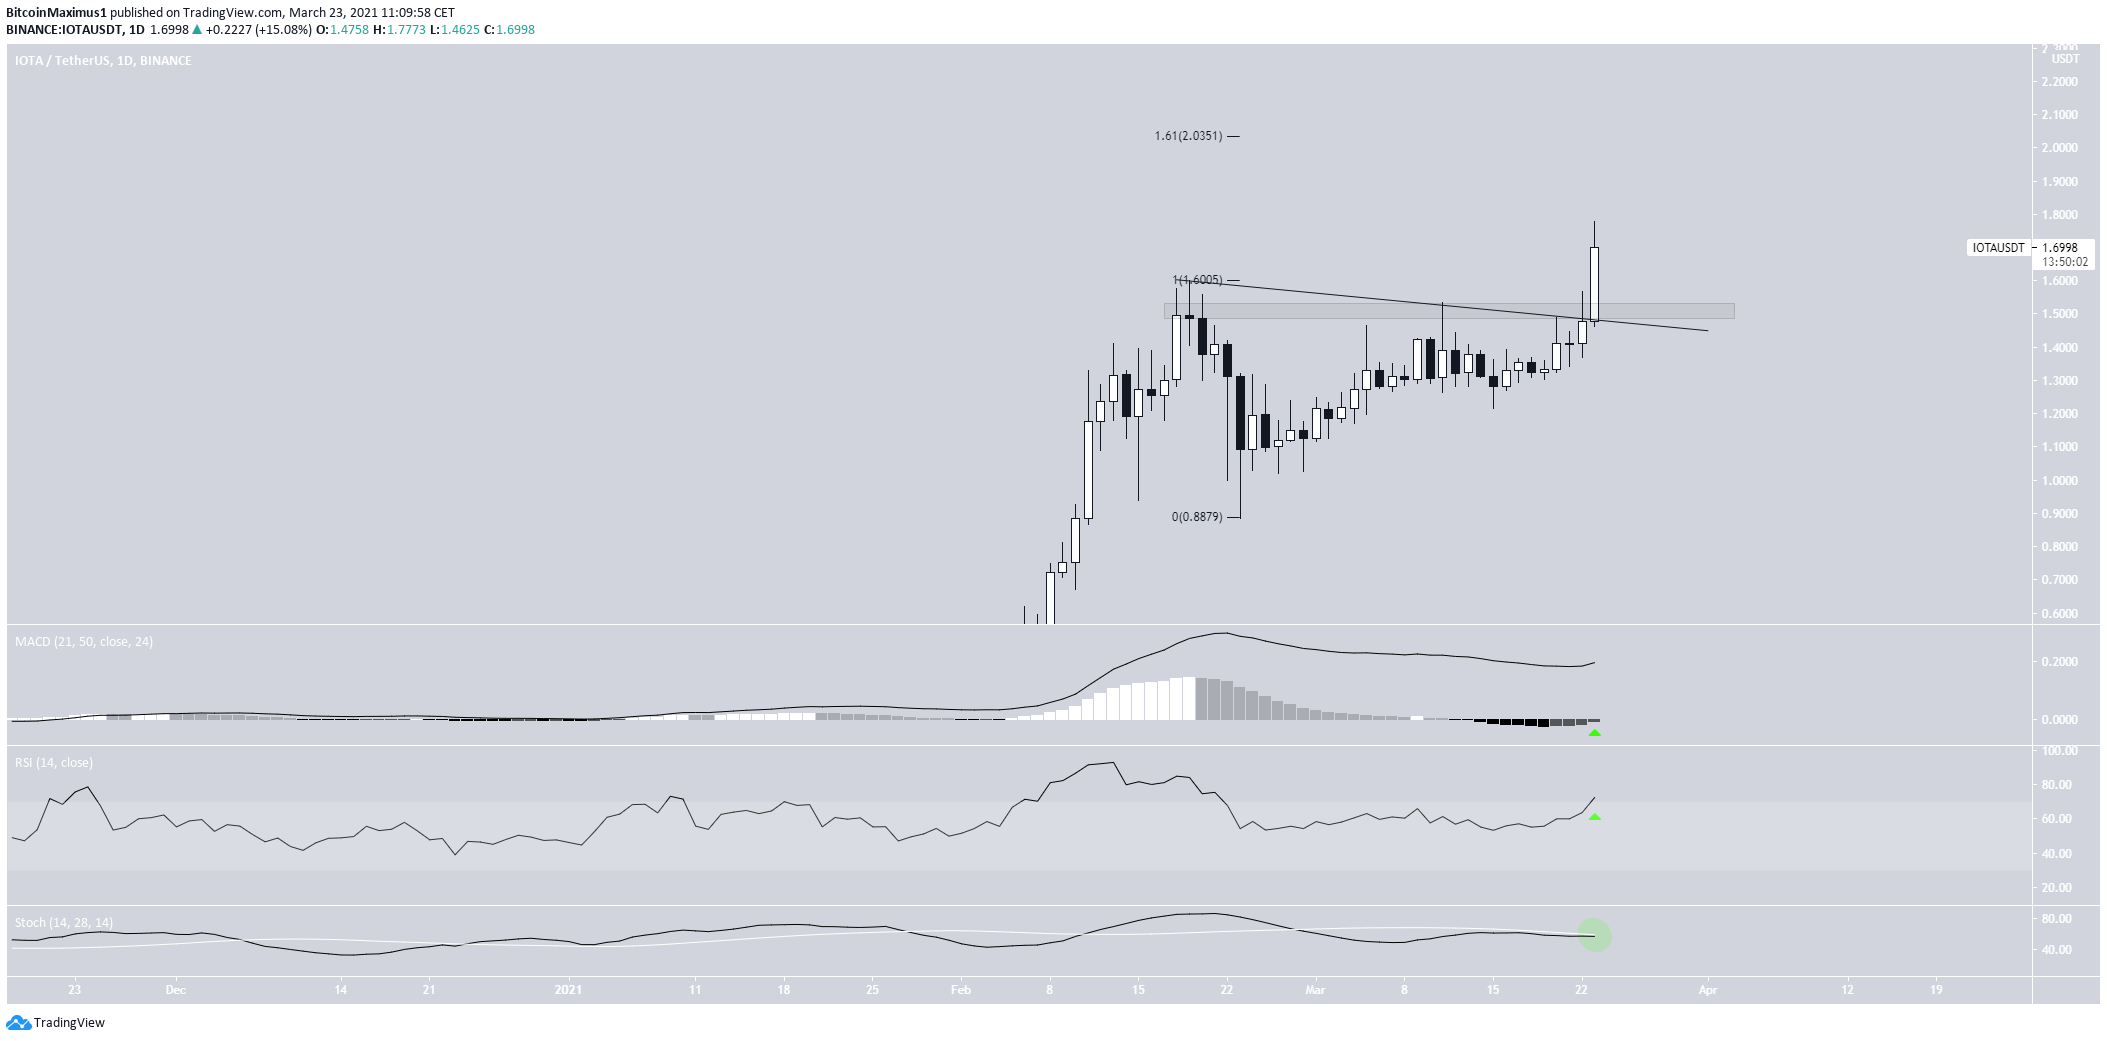
IOTA has broken out from a descending resistance line that had been in place since Feb. 19. In addition, it managed to move above the $1.55 horizontal resistance area.
Technical indicators support the continuation of the upward movement. Both the MACD and RSI are close to making important crosses. The former is crossing into positive territory while the latter has crossed above 70.
The next closest resistance area is found at $2. A retest of the $1.55 area is eventually expected.
Neo (NEO)
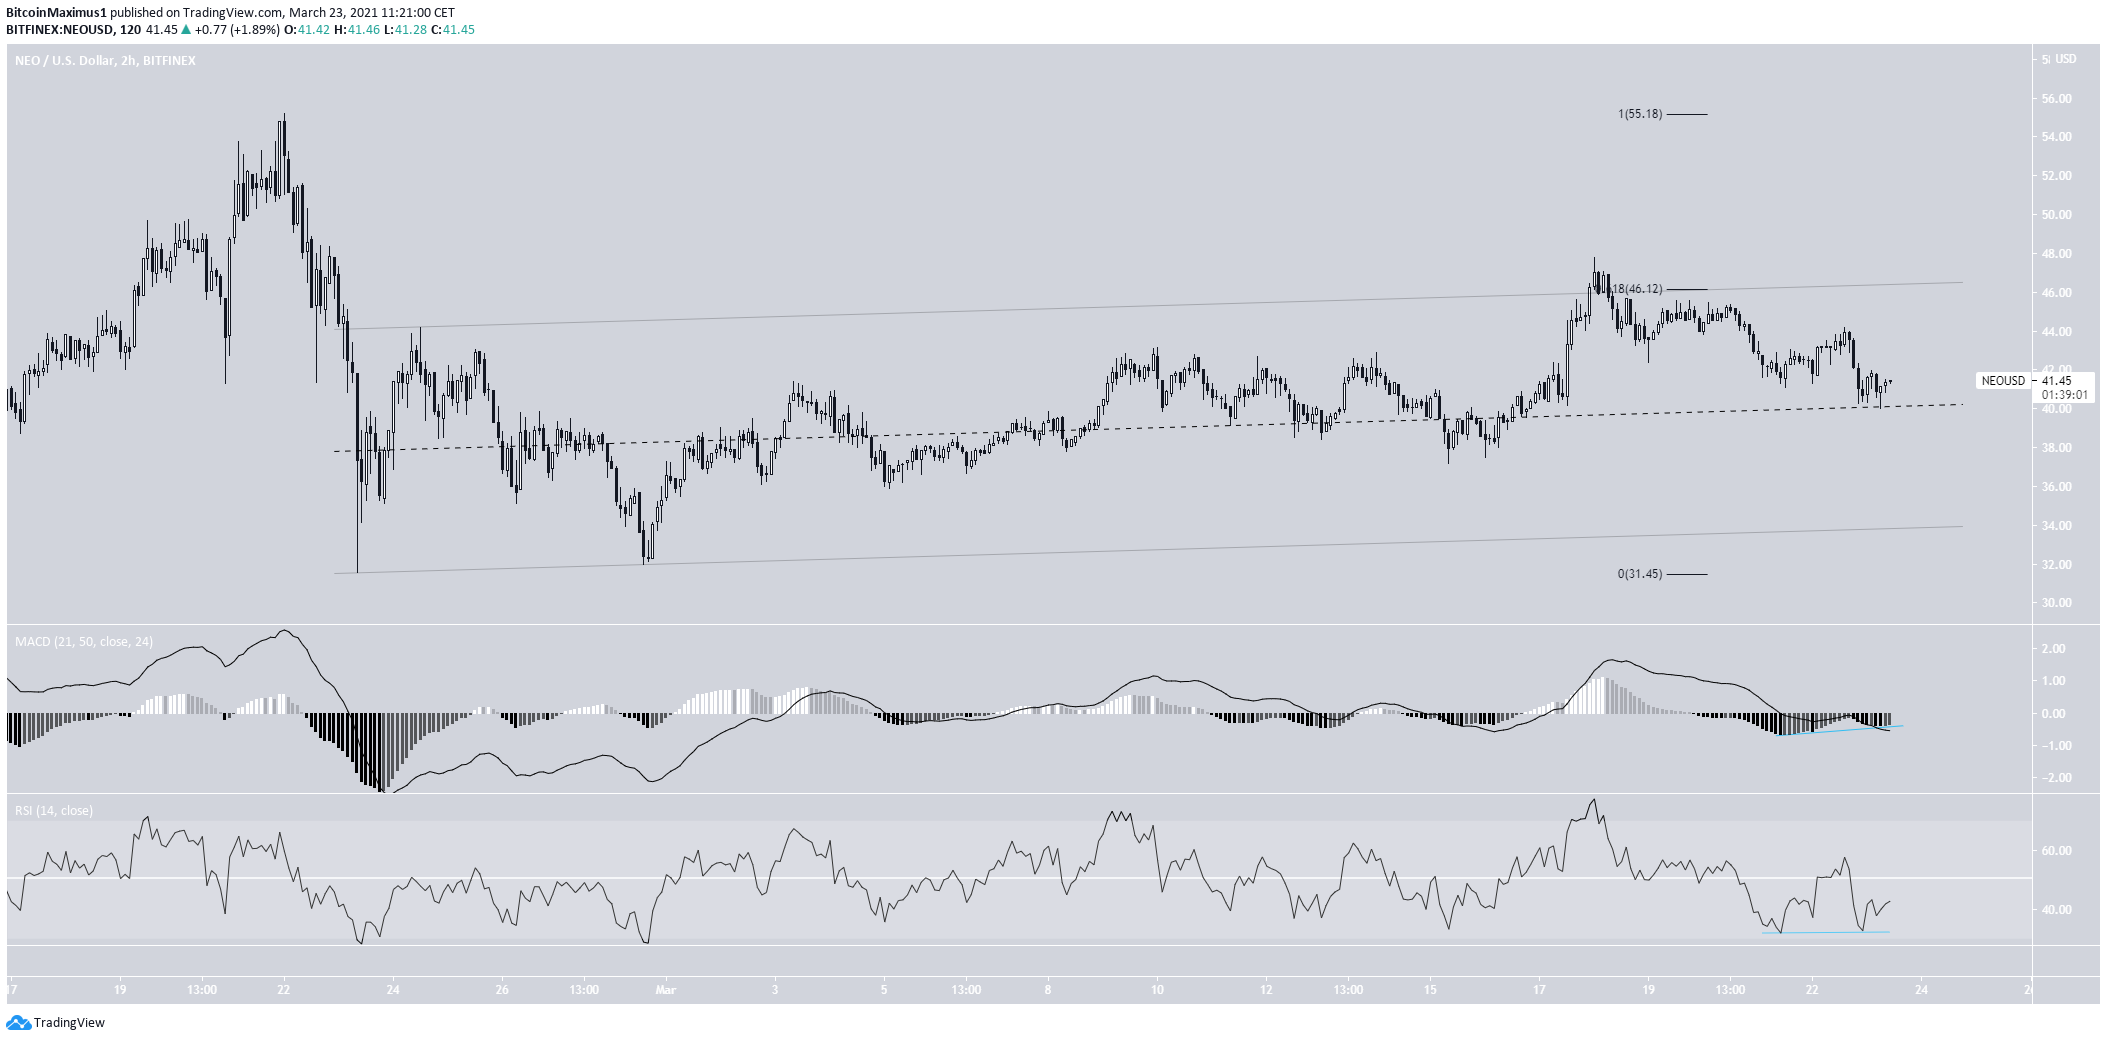
NEO has been increasing since Feb. 22. Throughout the increase, it has been following an ascending parallel channel.
This is often a corrective movement. Furthermore, NEO failed to move above the 0.618 Fib retracement resistance at $46.
Currently, NEO is trading just above the middle of this channel.
There is bullish divergence developing in the short-term, thus a bounce is expected.
However, the trend cannot be considered bullish until NEO breaks out from the channel.
Cosmos (ATOM)
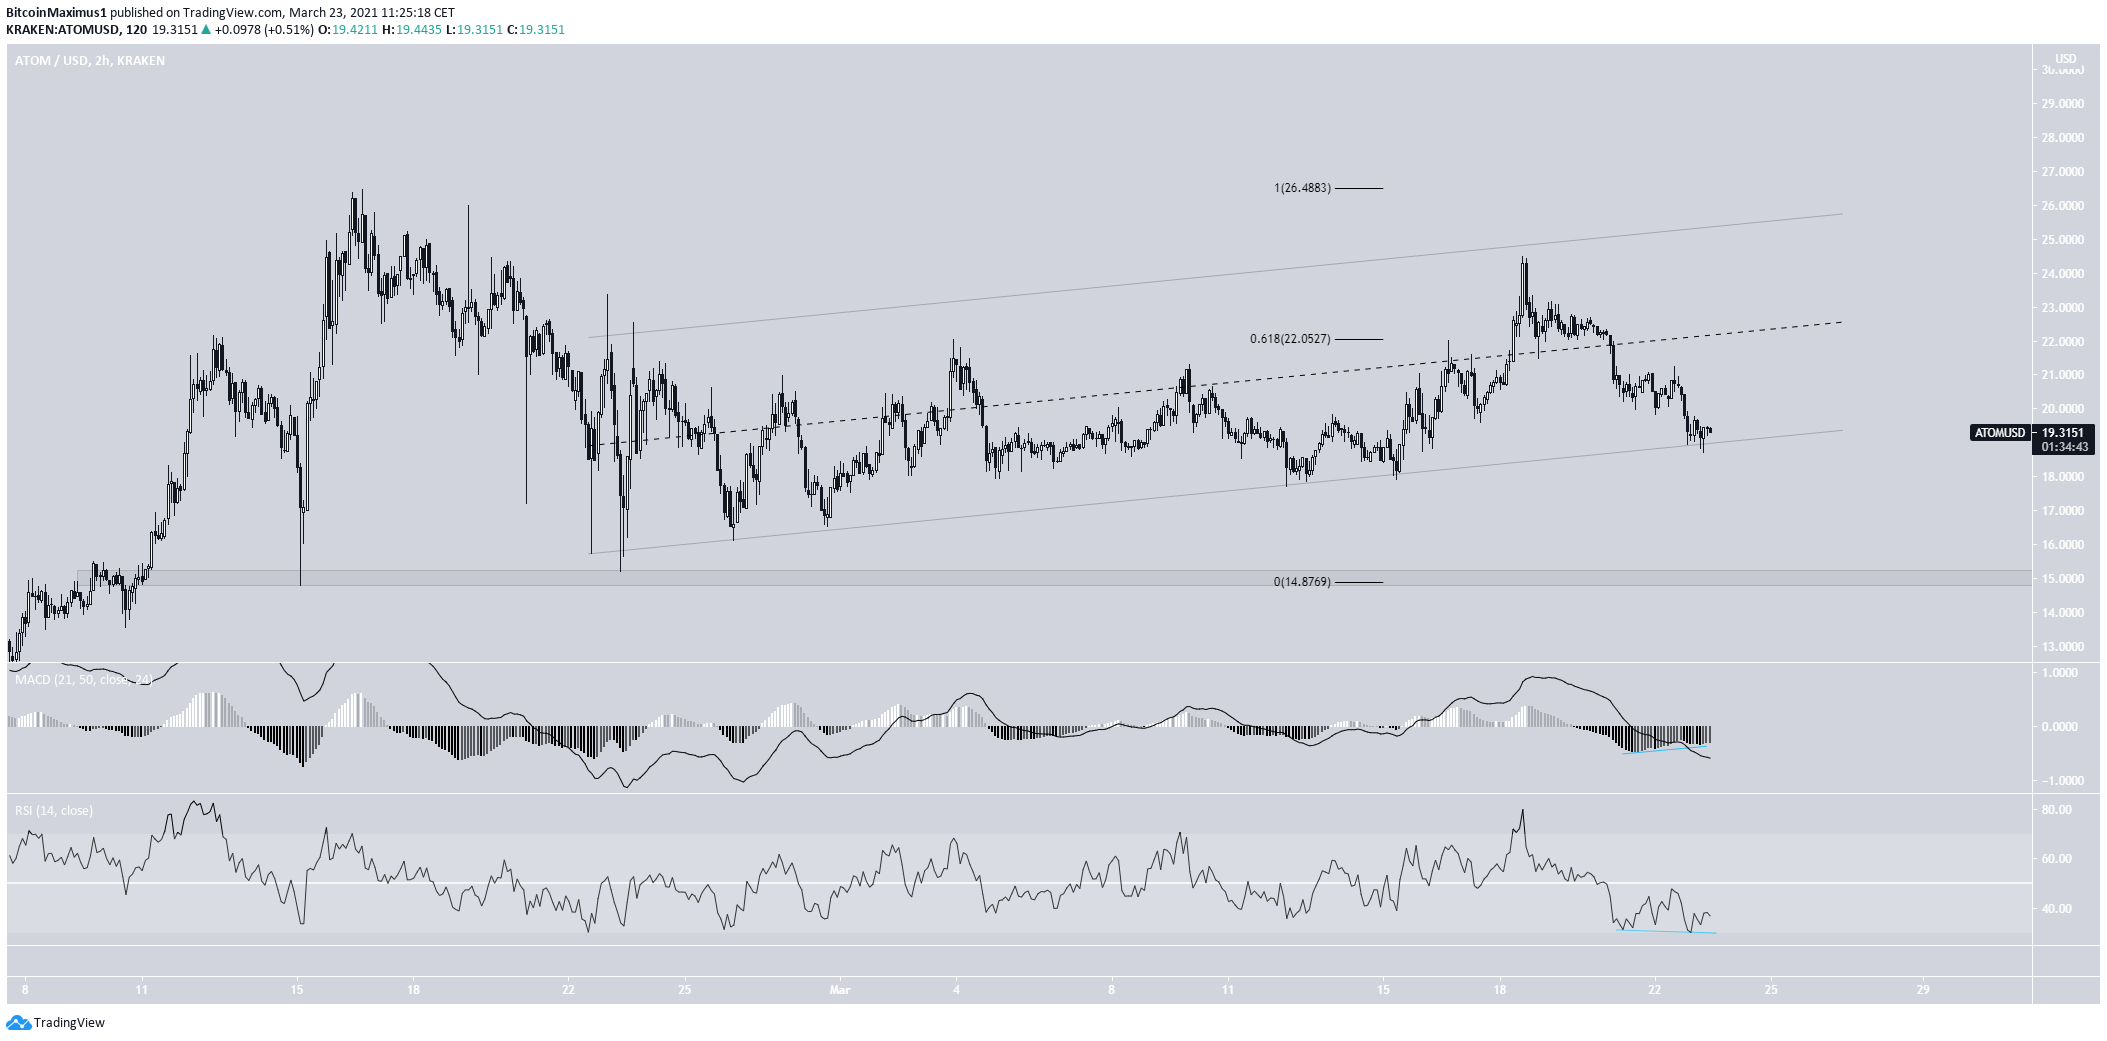
Similar to NEO, ATOM is trading inside a parallel ascending channel.
Unlike NEO, it has fallen all the way to its support line. This is a sign of weakness.
There are short-term divergences in place, indicating that a bounce is likely. However, ATOM is expected to eventually break down from the channel.
If so, the next support would be found at $15.
For BeInCrypto’s latest BTC (BTC) analysis, click here.
The post BTC, ETH, XRP, TRX, IOTA, NEO, ATOM: Technical Analysis March 23 appeared first on BeInCrypto.


![Decentraland: Review & Beginner's Guide [current_date format=Y] 40 Decentraland: Review & Beginner's Guide](https://cryptheory.org/wp-content/uploads/2020/11/decentraland-02-gID_7-300x150.jpg)