BTC drops 14% and records worst drop for the month since 2015
2 min read
The price of BTC ended the month of August down by 13.88%, according to data from the Coinglass platform. The fall is the worst recorded in August since 2015, the year in which BTC lost 18.67% of its value.
Worst drop for the month since 2015
In terms of price, BTC opened the month quoted at US$23,390. However, the fall made the cryptocurrency close at $19,998.
Out of the eight months of 2022 so far, BTC has recorded negative performance in five of them. In this sense, the month of August had the fifth worst monthly performance of the year.
BTC performance between August 1st and 31st. Source: CoinMarketCap.
Weekly chart raises concerns
According to data from TradingView, the BTC/USD pair ended the month at $19,990. Since late 2020, this is only the second time that BTC has had a monthly close below $20K.
Last month’s drop deals a blow to bulls’ efforts to stabilize the spot price. June remains the macro bearish on the monthly chart, but the performance has taken traders into firmly bearish territory.
Caleb Franzen, senior market analyst at Cubic Analytics, added that the first weekly candle for September is not encouraging. That is, this month is already preparing to take BTC to further devaluations.
“BTC’s weekly candle doesn’t look good, although it’s still very early in the week,” warned the trader alongside a explanatory chart. “The long fuse and the sell-off is objectively a bad sign if it closes this way. Especially if it turns into a red candle. Something to watch for the rest of the week.”

This assessment makes sense as the month of September is historically negative for BTC. However, the analyst known as Dave the Wave is more optimistic.
In his assessment, Dave highlighted the Moving Average Convergence/Divergence (MACD) as predicting the fall of local highs above $25K. Now, however, the trader sees the average going in the opposite direction, favoring a sign of relief for buyers.
New “historical minimums” for the hodl metric
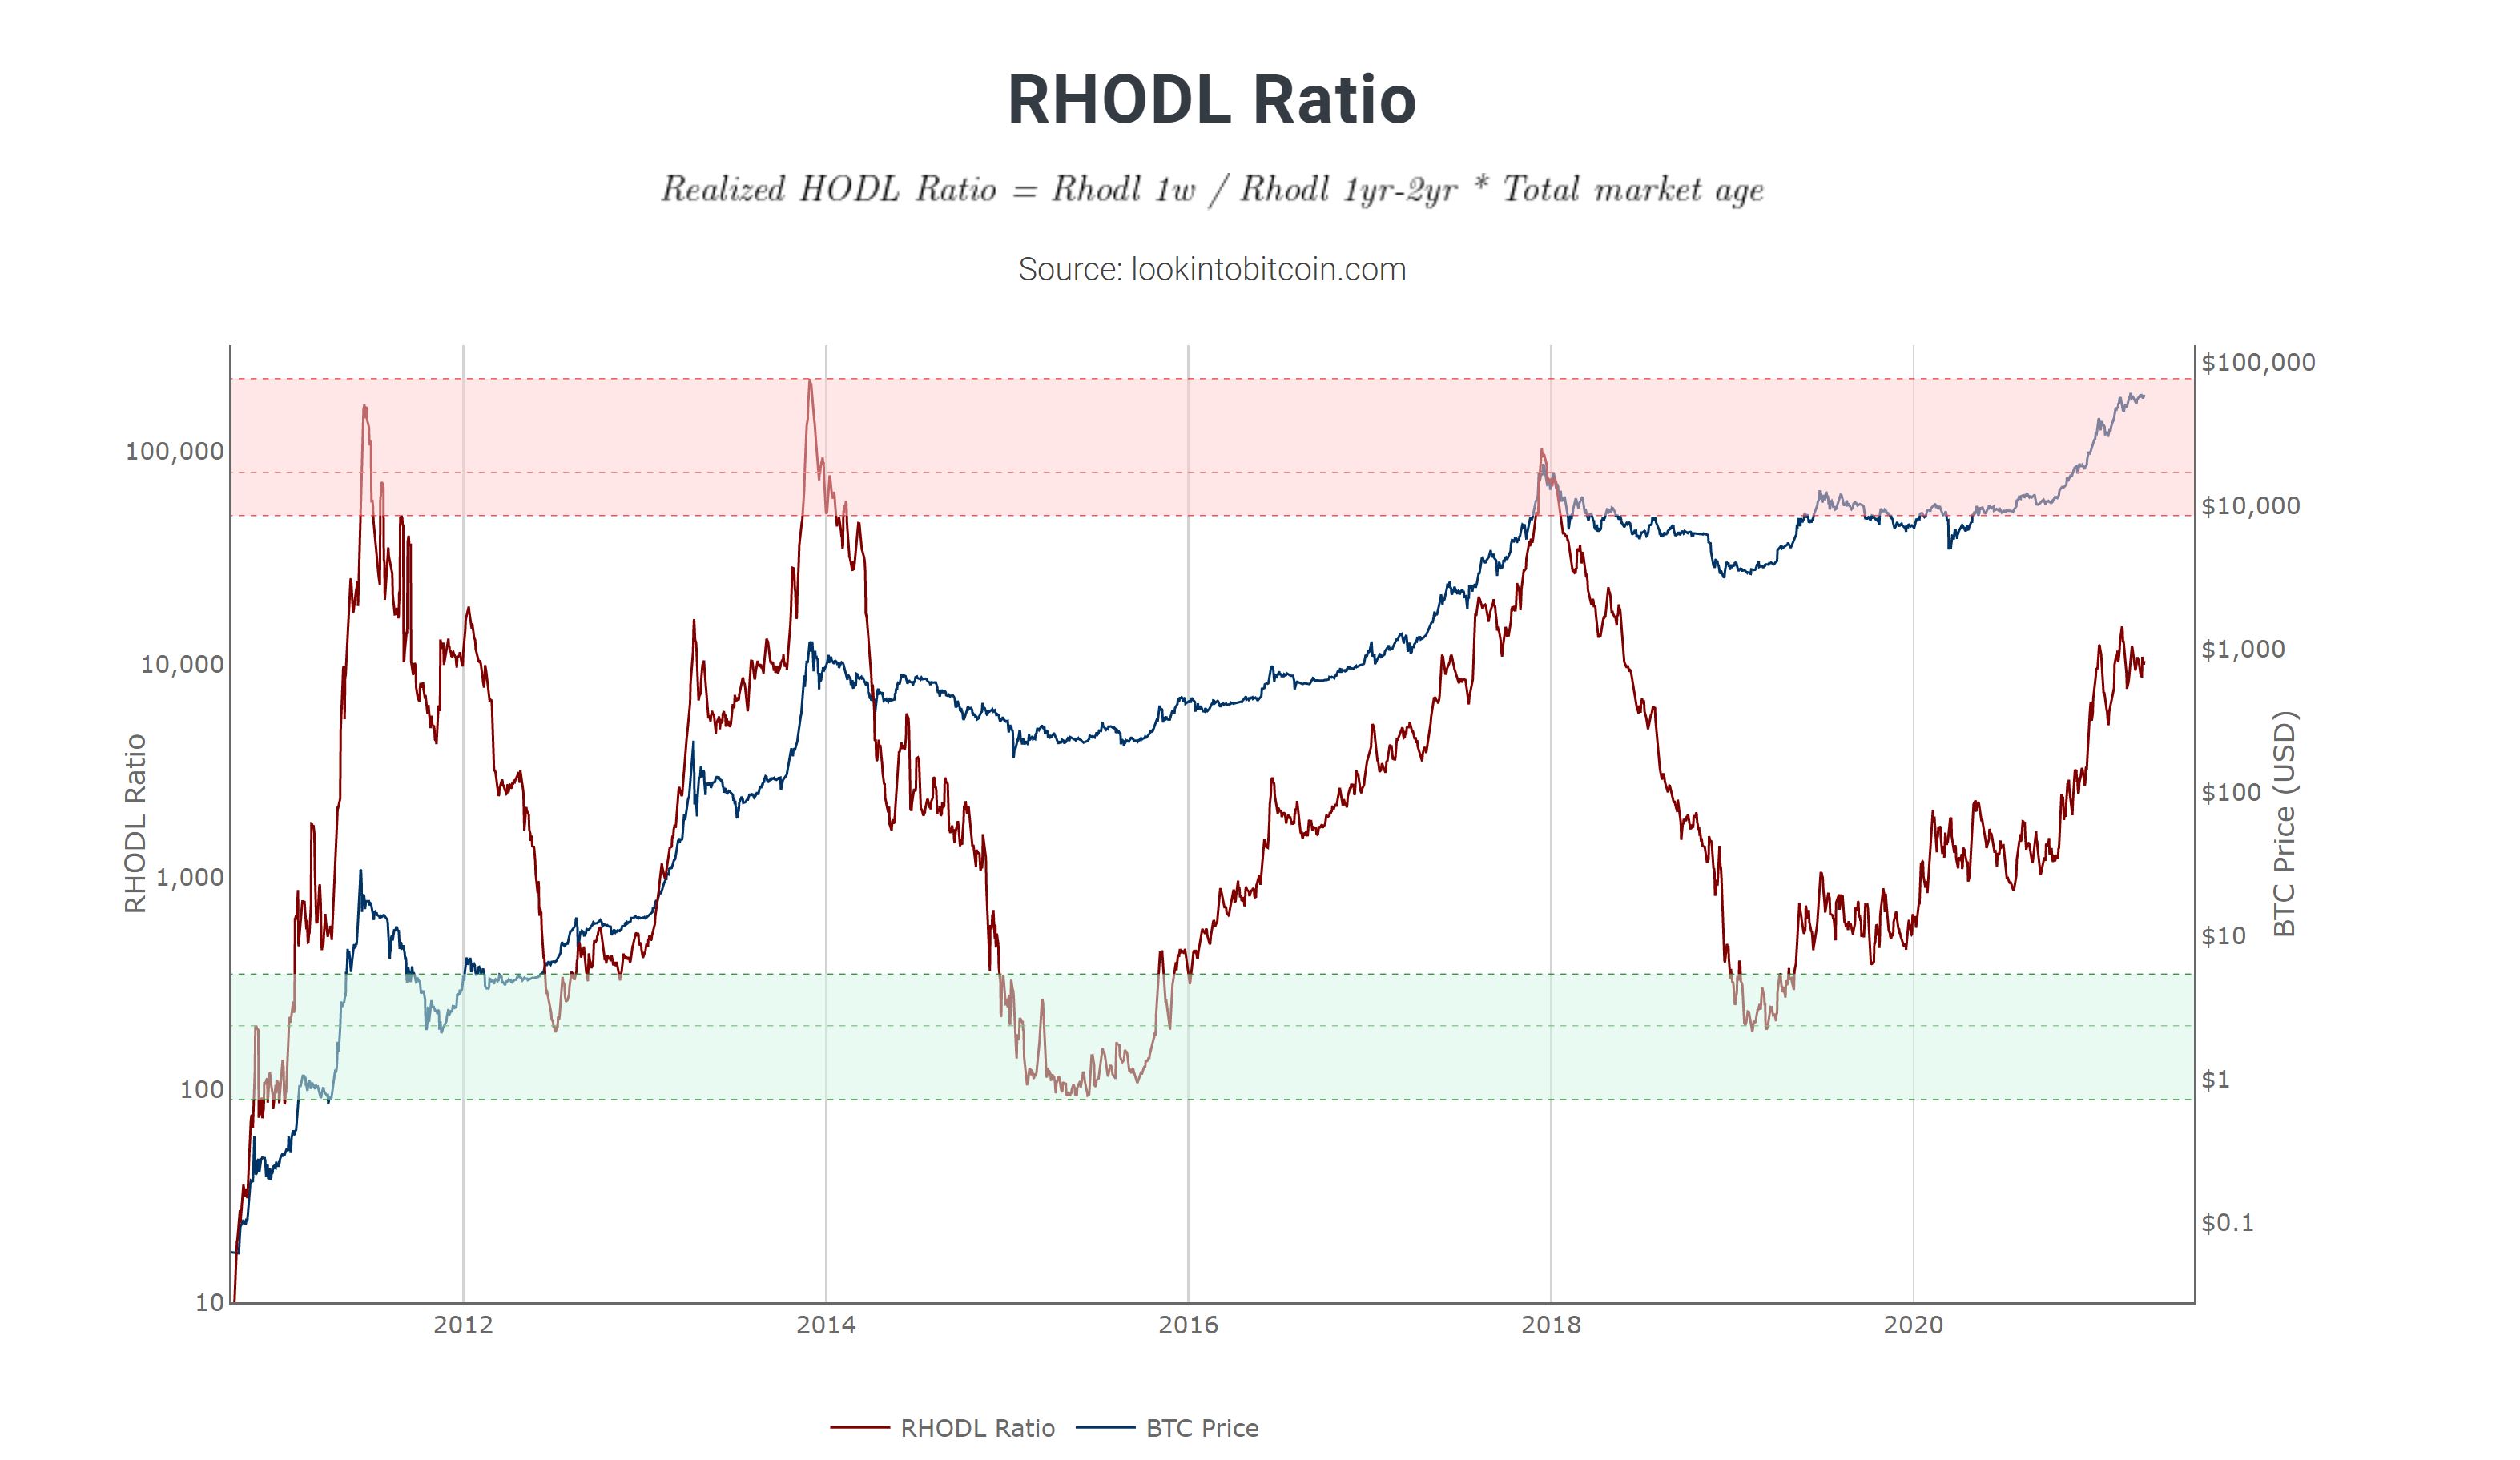
Meanwhile, one on-chain indicator in particular reinforced the feeling that current BTC price levels reflect a momentum of accumulation, not selling. This indicator is the BTC Hodl Realized Value Index (RHODL).
The RHODL measures the relative value of currencies moving over the past few weeks compared to a year or two earlier. This index is now at an all-time low, which indicates undervaluation in the price of BTC.

“The average RHODL is now at historic lows. It shows that the short-term prices paid for BTC are relatively low compared to those paid a year or two ago. It shows that the market is down and it’s time to accumulate,” explained Philip Swift, creator of the LookIntoBitcoin platform.


