BTC Shows Weakness After Breaking Past $60,000
2 min readTable of Contents
The BTC (BTC) price broke out and reached a new all-time high price of $61,781 on March 13.
While a short-term decrease could occur, it’s likely that BTC could begin another upward movement after.
BTC Weekly Outlook
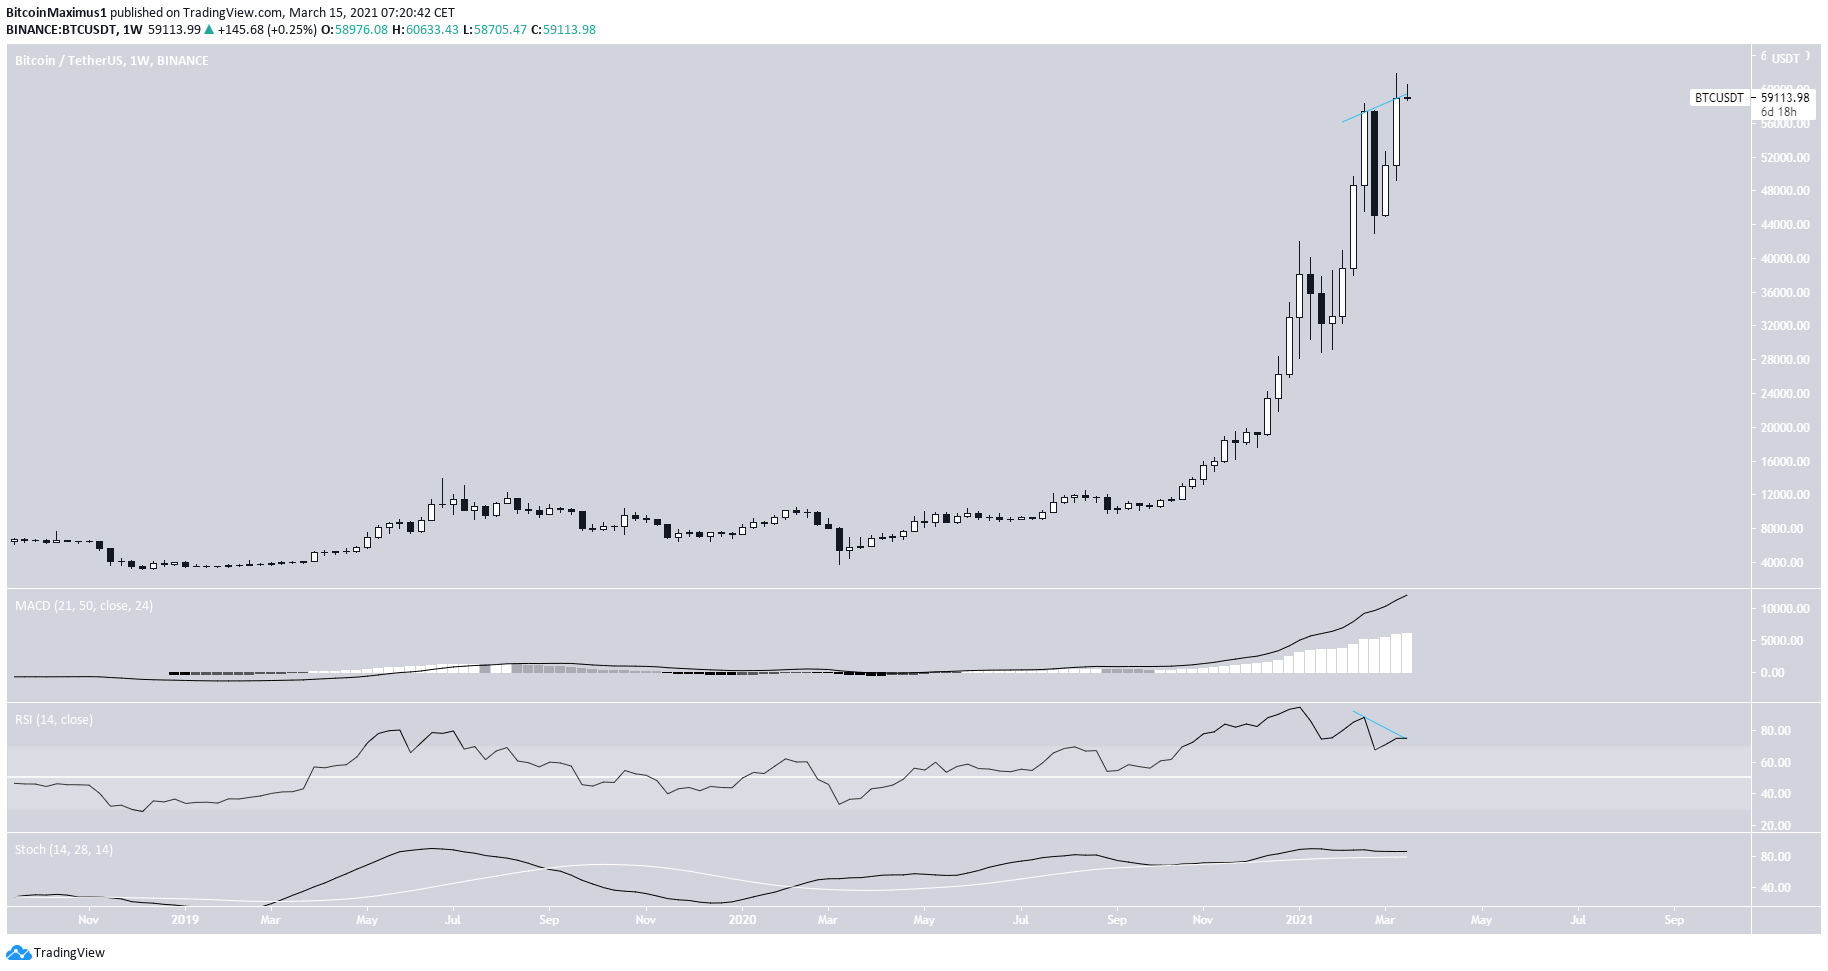
BTC increased considerably last week, reaching a new all-time high price of $61,844. The weekly candlestick close was bullish, even though there is a small upper wick in place.
The RSI has generated some bearish divergence — a potential reversal sign.
However, both the MACD and Stochastic oscillator are still increasing.
BTC Daily
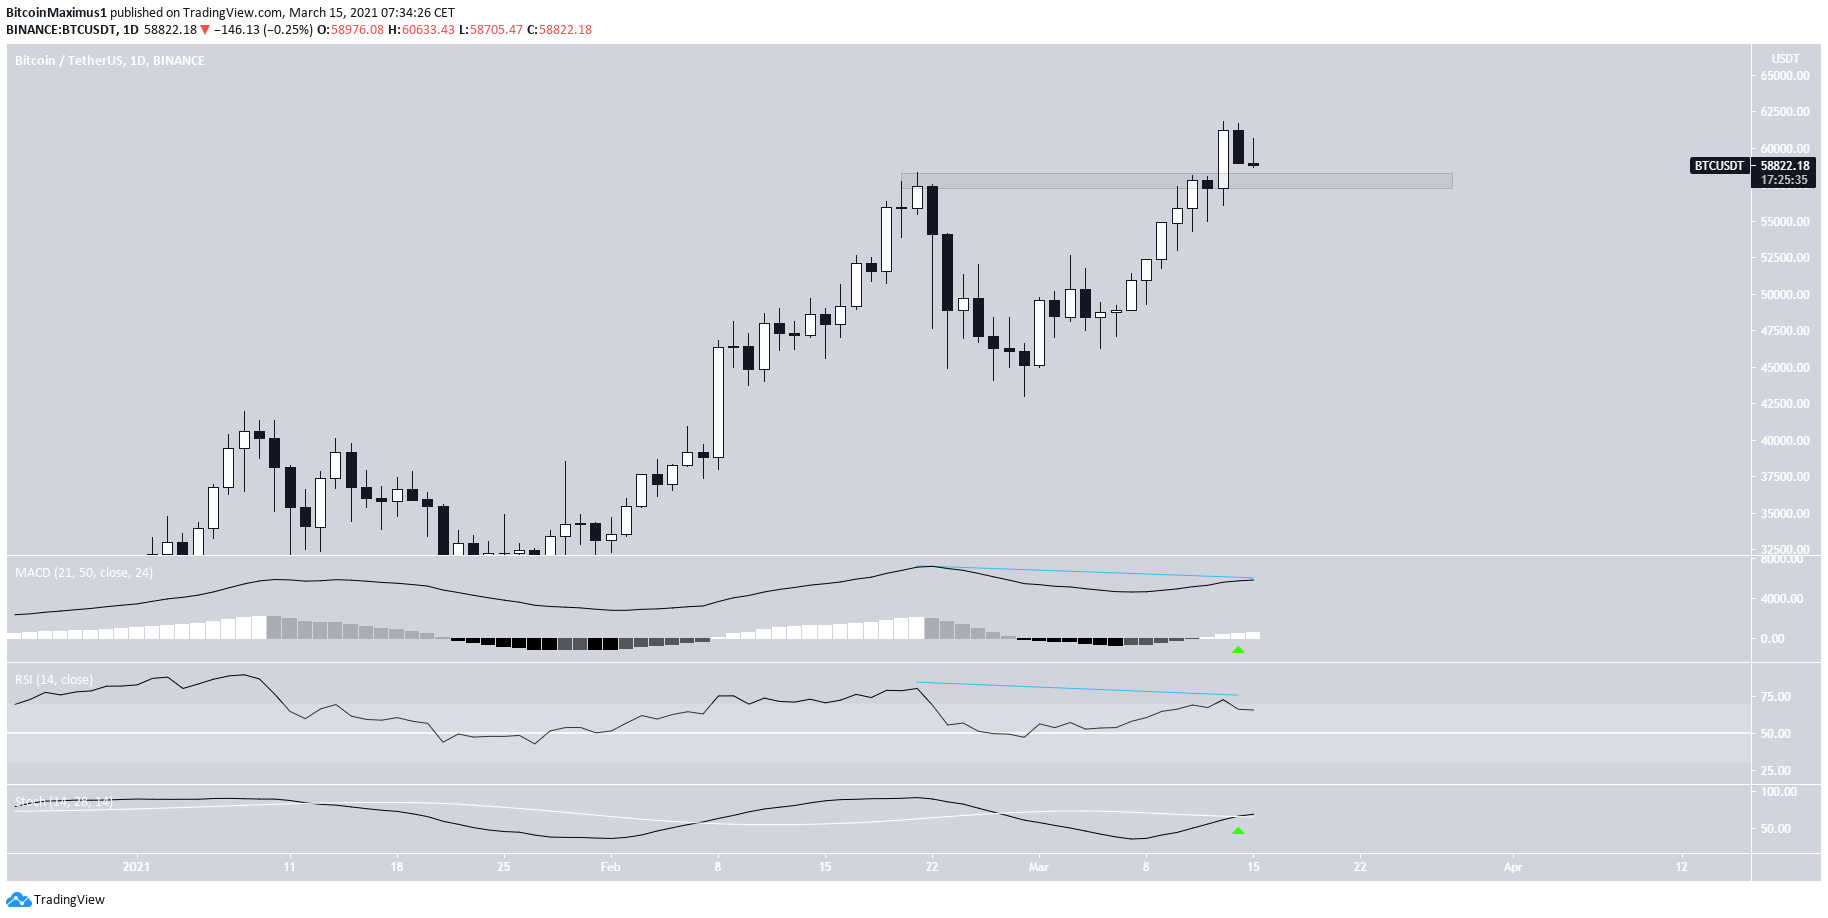
The daily chart provides a similar outlook.
The $58,000 area that BTC initially broke out from is now expected to act as support.
In another bullish sign, the Stochastic oscillator has made a bullish cross and the MACD has just turned positive.
However, similar to the weekly time-frame, both the RSI and MACD have generated a bearish divergence — a potential signal of a top.
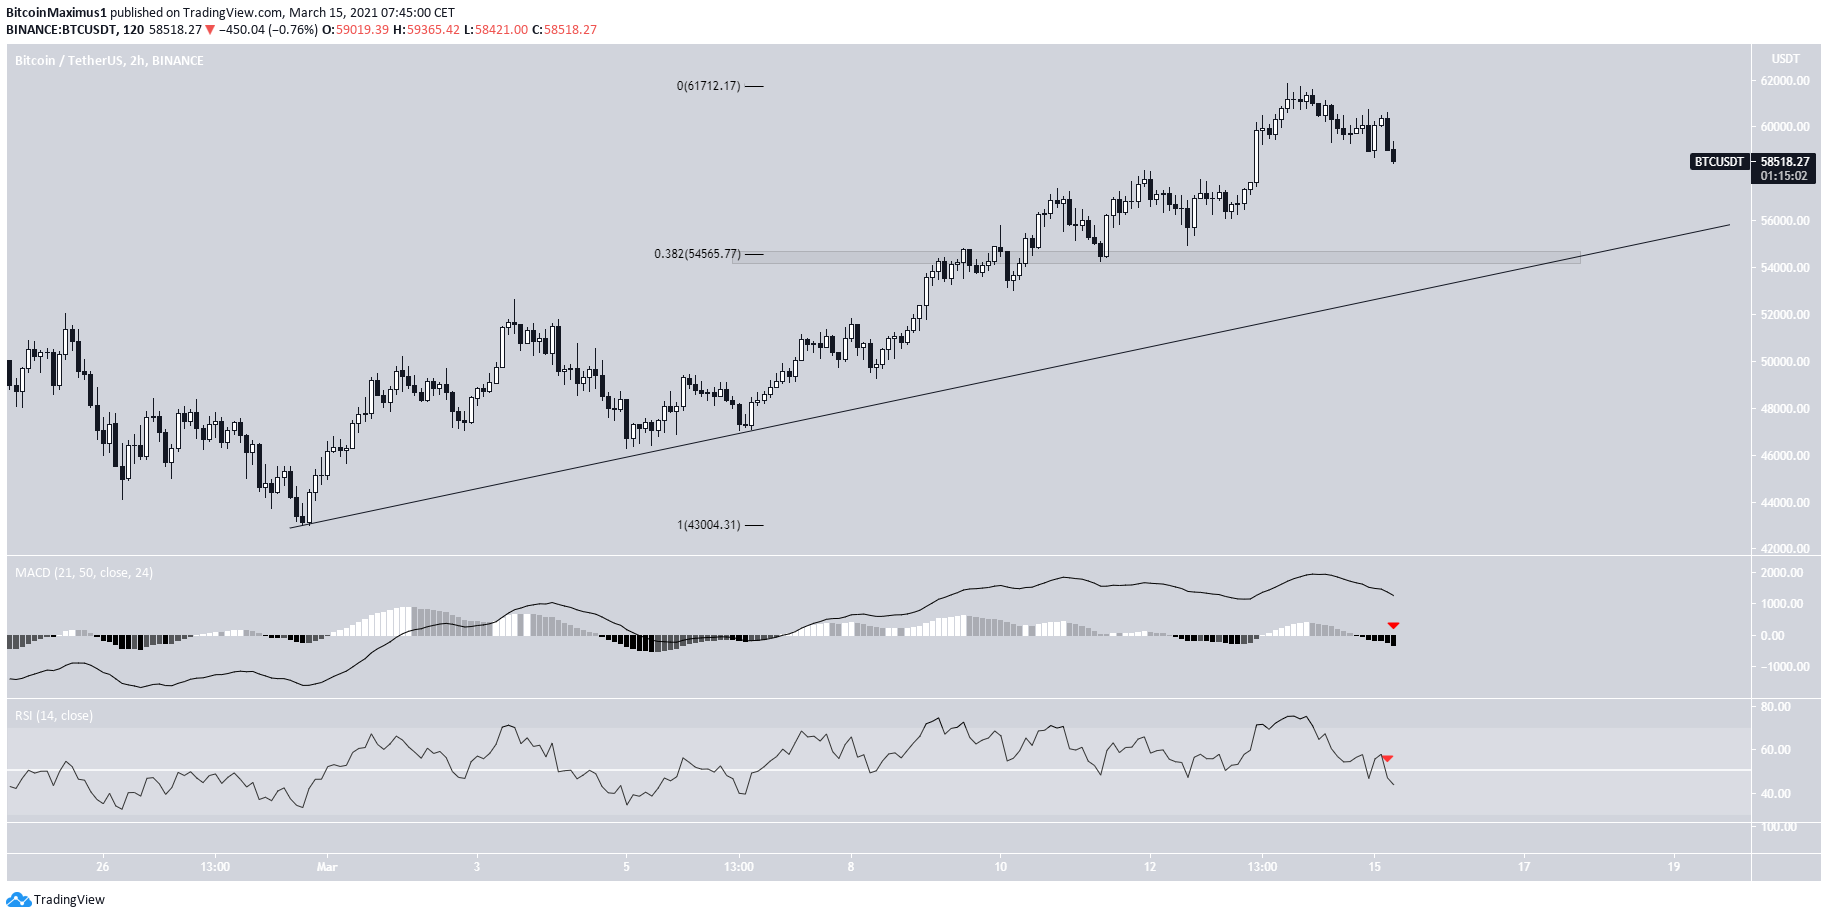
The two-hour chart also shows signs of weakness.
The MACD has crossed into negative territory while the RSI has crossed below 50. This suggests that a short-term decrease may occur. This is also supported by the bearish divergences in the weekly and daily charts.
If a decrease occurs, it’s possible that BTC could find support at $54,650. This is the 0.382 Fib retracement level and a short-term ascending support line.
Wave Count
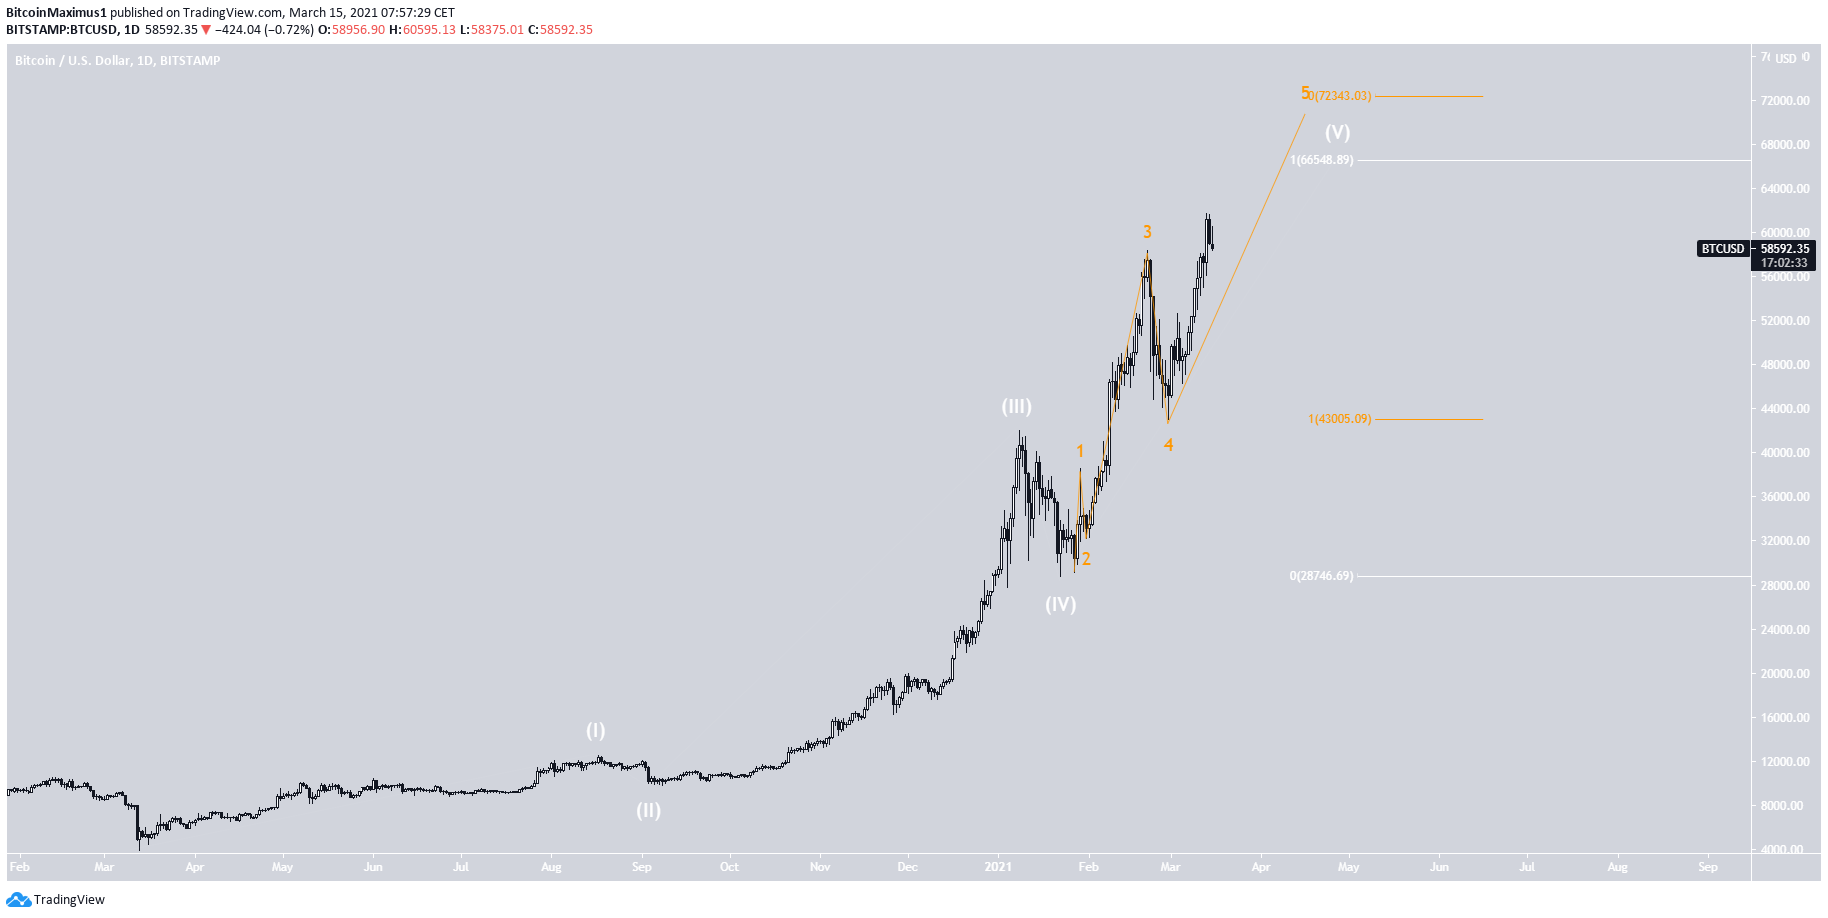
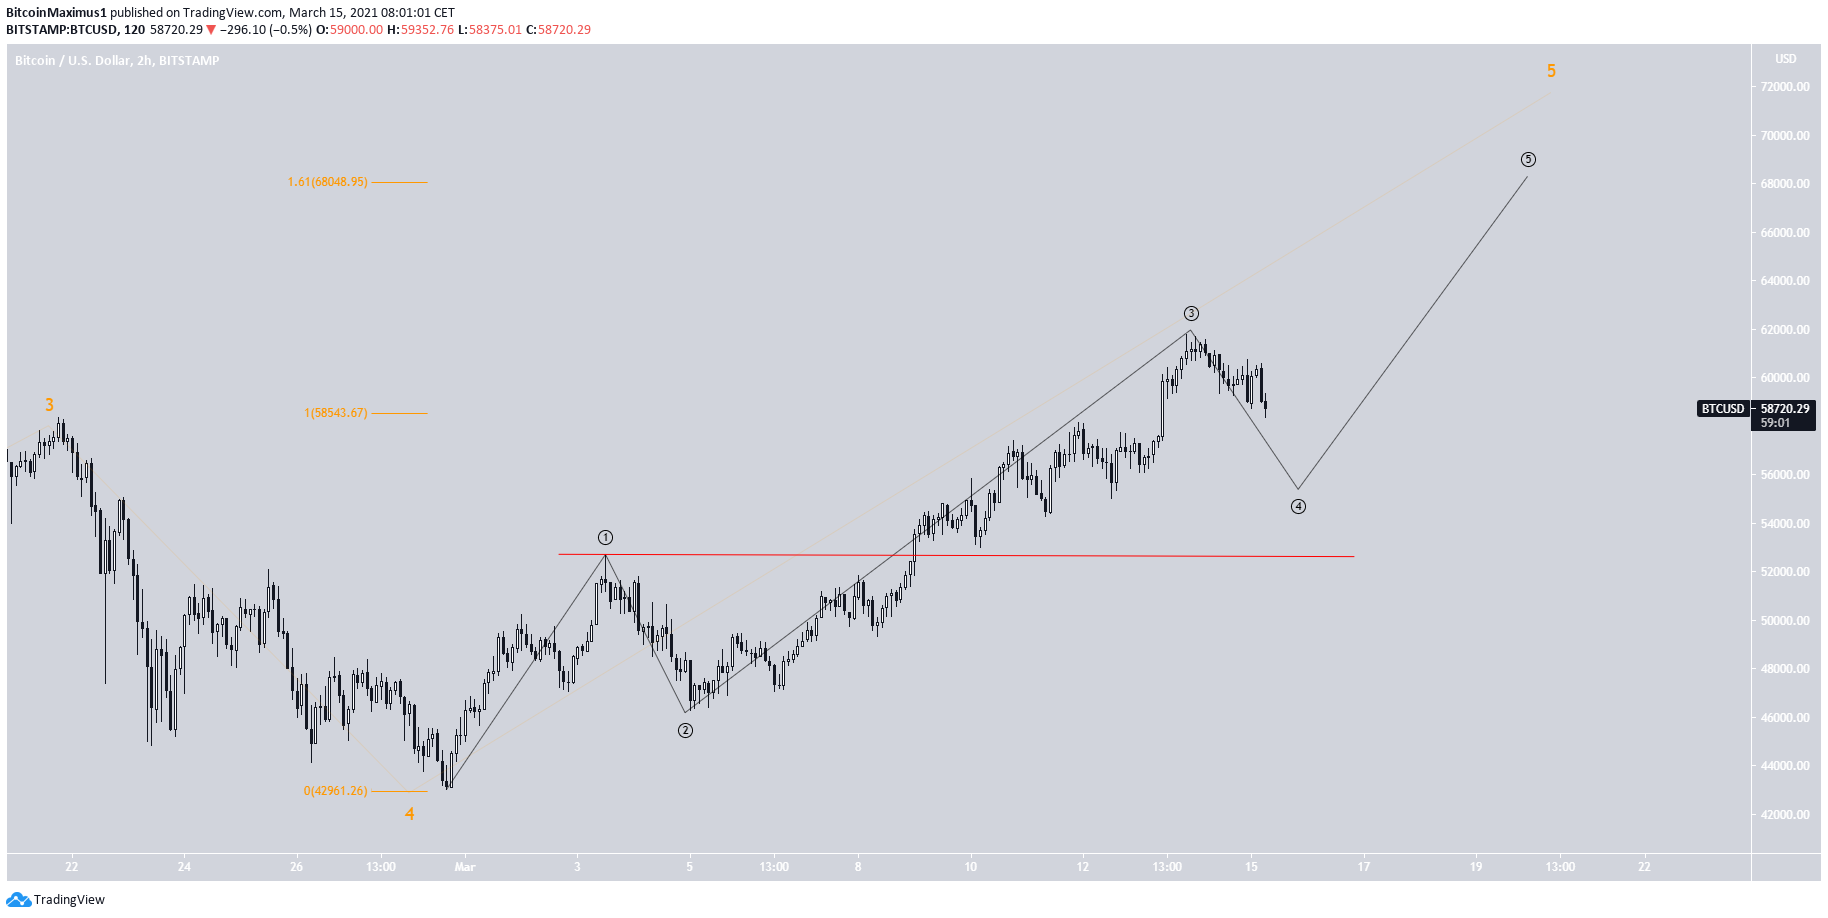
The wave count suggests that BTC is nearing the top of a bullish impulse (white) that began in March 2020. Currently, it’s in sub-wave five (orange).
A potential target for the top of the movement is found between $66,500-$72,300.
The latter target is found using a Fib projection on the sub-wave movement (orange). The former is found using a Fib projection on the movement of the entire wave (white).
An even closer look shows that BTC is in minor sub-wave four (black). This fits with the previous readings that indicate another decrease is likely before bullish continuation.
A decrease below the minor sub-wave one high of $52,652 would likely mean that the move is finished.
Conclusion
BTC is expected to decrease towards $58,000 and potentially $54,500. Afterward, another upward movement is expected.
For BeInCrypto’s previous BTC (BTC) analysis, click here.
The post BTC Shows Weakness After Breaking Past $60,000 appeared first on BeInCrypto.


![Decentraland: Review & Beginner's Guide [current_date format=Y] 32 Decentraland: Review & Beginner's Guide](https://cryptheory.org/wp-content/uploads/2020/11/decentraland-02-gID_7-300x150.jpg)