BTCD Continues Descent As Altcoins Increase
2 min readTable of Contents
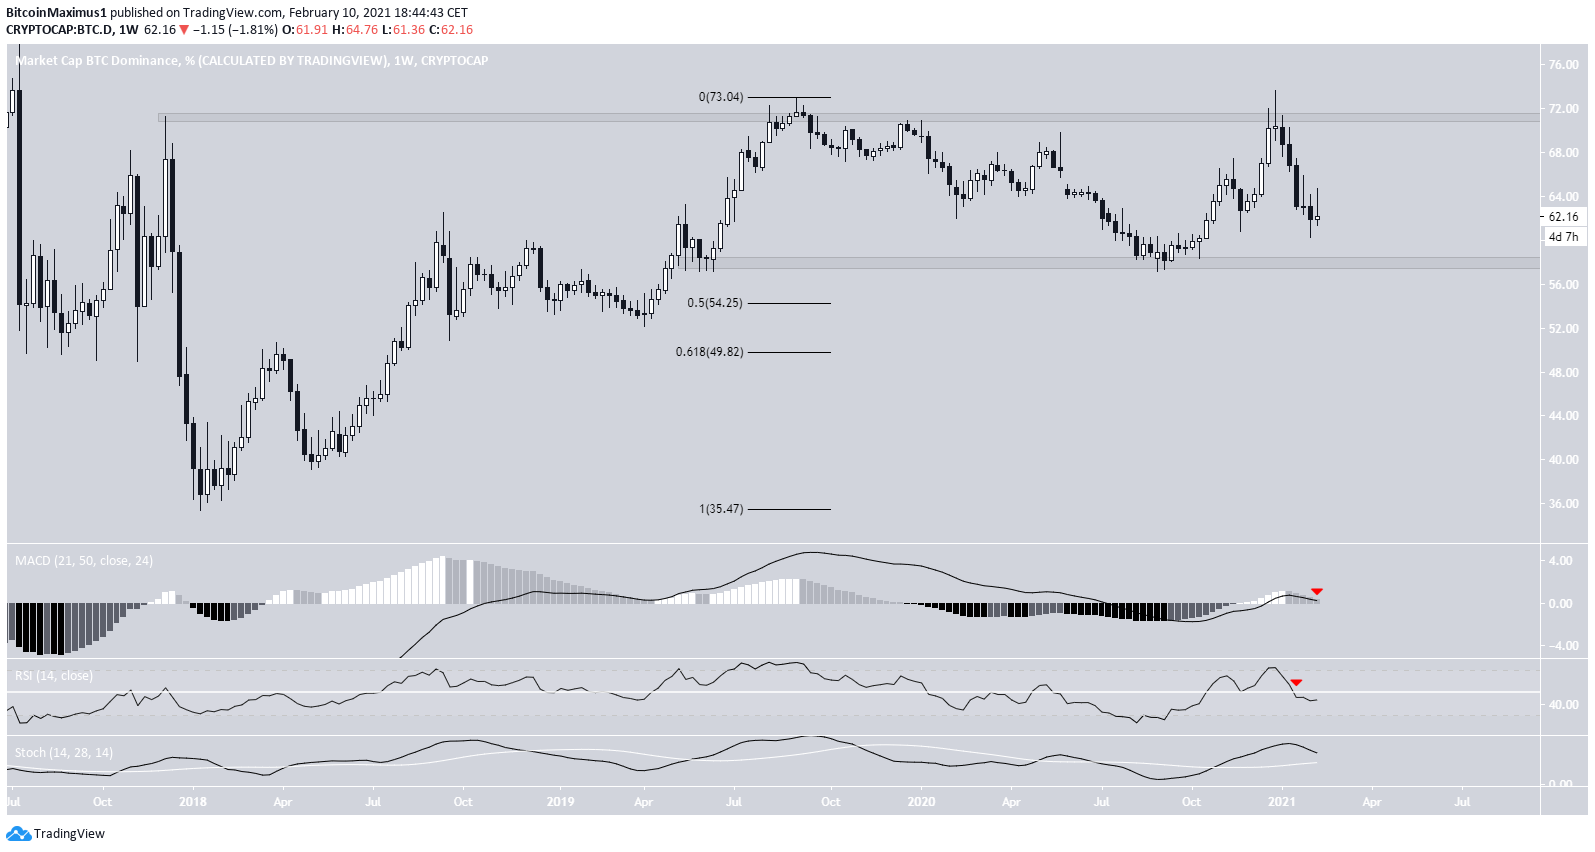
The Bitcoin Dominance Rate (BTCD) has been decreasing since the beginning of the year and is approaching a long-term support area at 58%.
Technical indicators and the wave count suggest that BTCD will continue its descent until it possibly breaks down.
Long-Term Levels
BTCD has been moving downwards since being rejected by the 71.5% resistance area in Jan. 2021. The decrease has been swift, and BTCD has nearly reached the long-term 58% support area.
BTCD has not traded below this level since Apr. 2020.
If it breaks down, the next closest support areas are found at 54% and 50%, respectively. These are the 0.5 & 0.618 Fib retracement levels of the entire upward movement, starting from 2018.
Technical indicators are bearish, supporting the possibility that BTCD will fall to the 58% area and potentially break down.
Current Movement
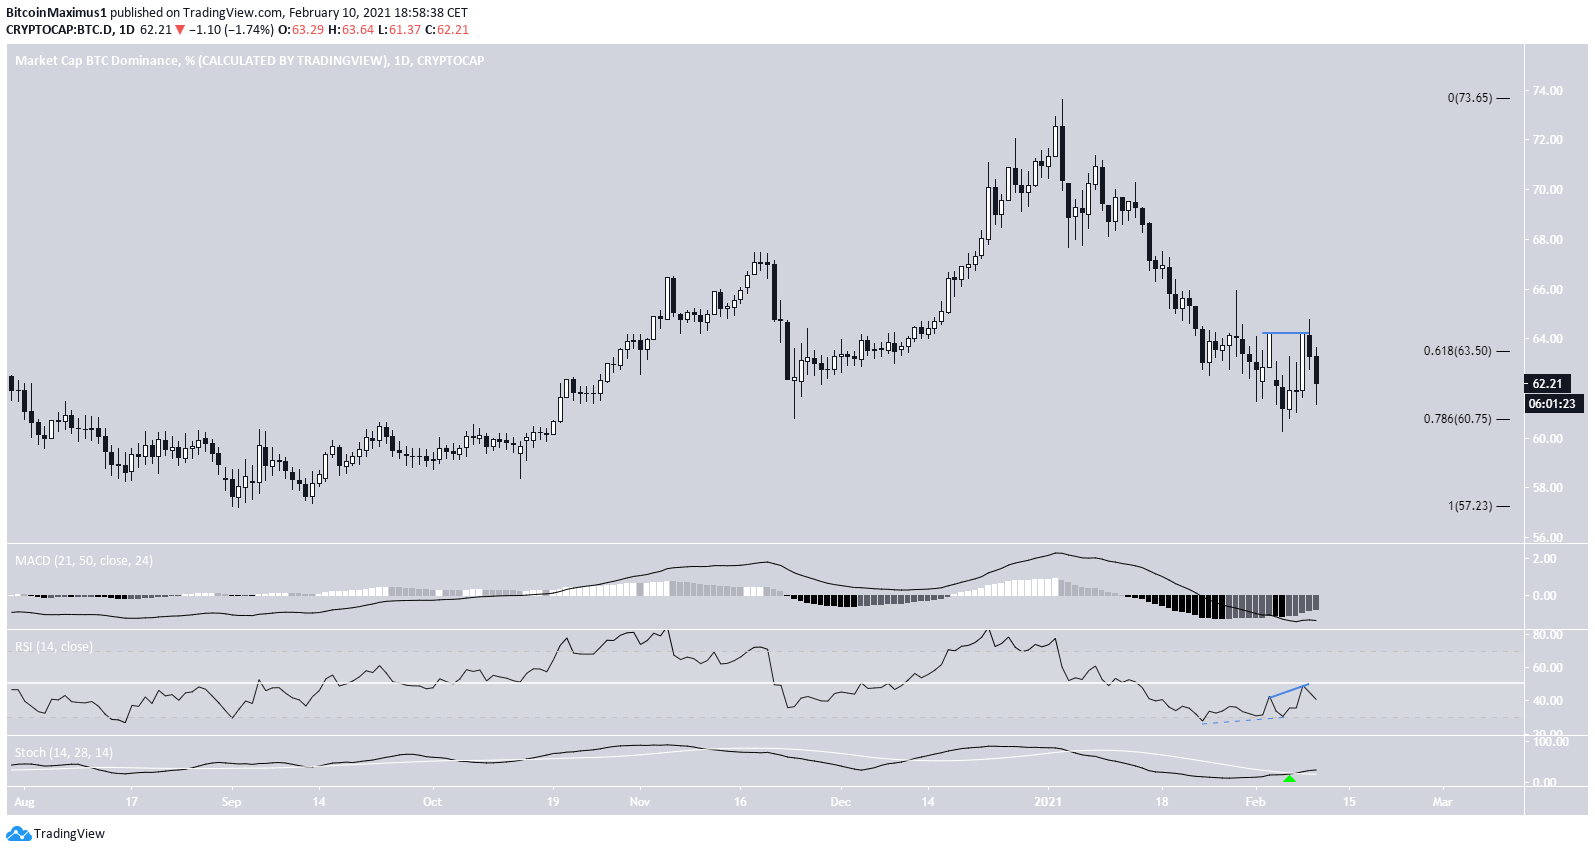
The daily chart provides some mixed signals. BTCD is currently trading between the 0.618-0.786 Fib retracement levels, which is a likely area for a reversal to occur. However, the ongoing bounce has been weak.
While there was a bullish divergence in the RSI which preceded the minor bounce, the RSI has now generated hidden bearish divergence, invalidating the previous bullish one.
While the Stochastic Oscillator has made a bullish cross, the MACD line is considerably below 0.
Therefore, while there are some bullish reversal signs, they are not sufficient to invalidate the bearishness in the weekly time-frame.
Wave Count
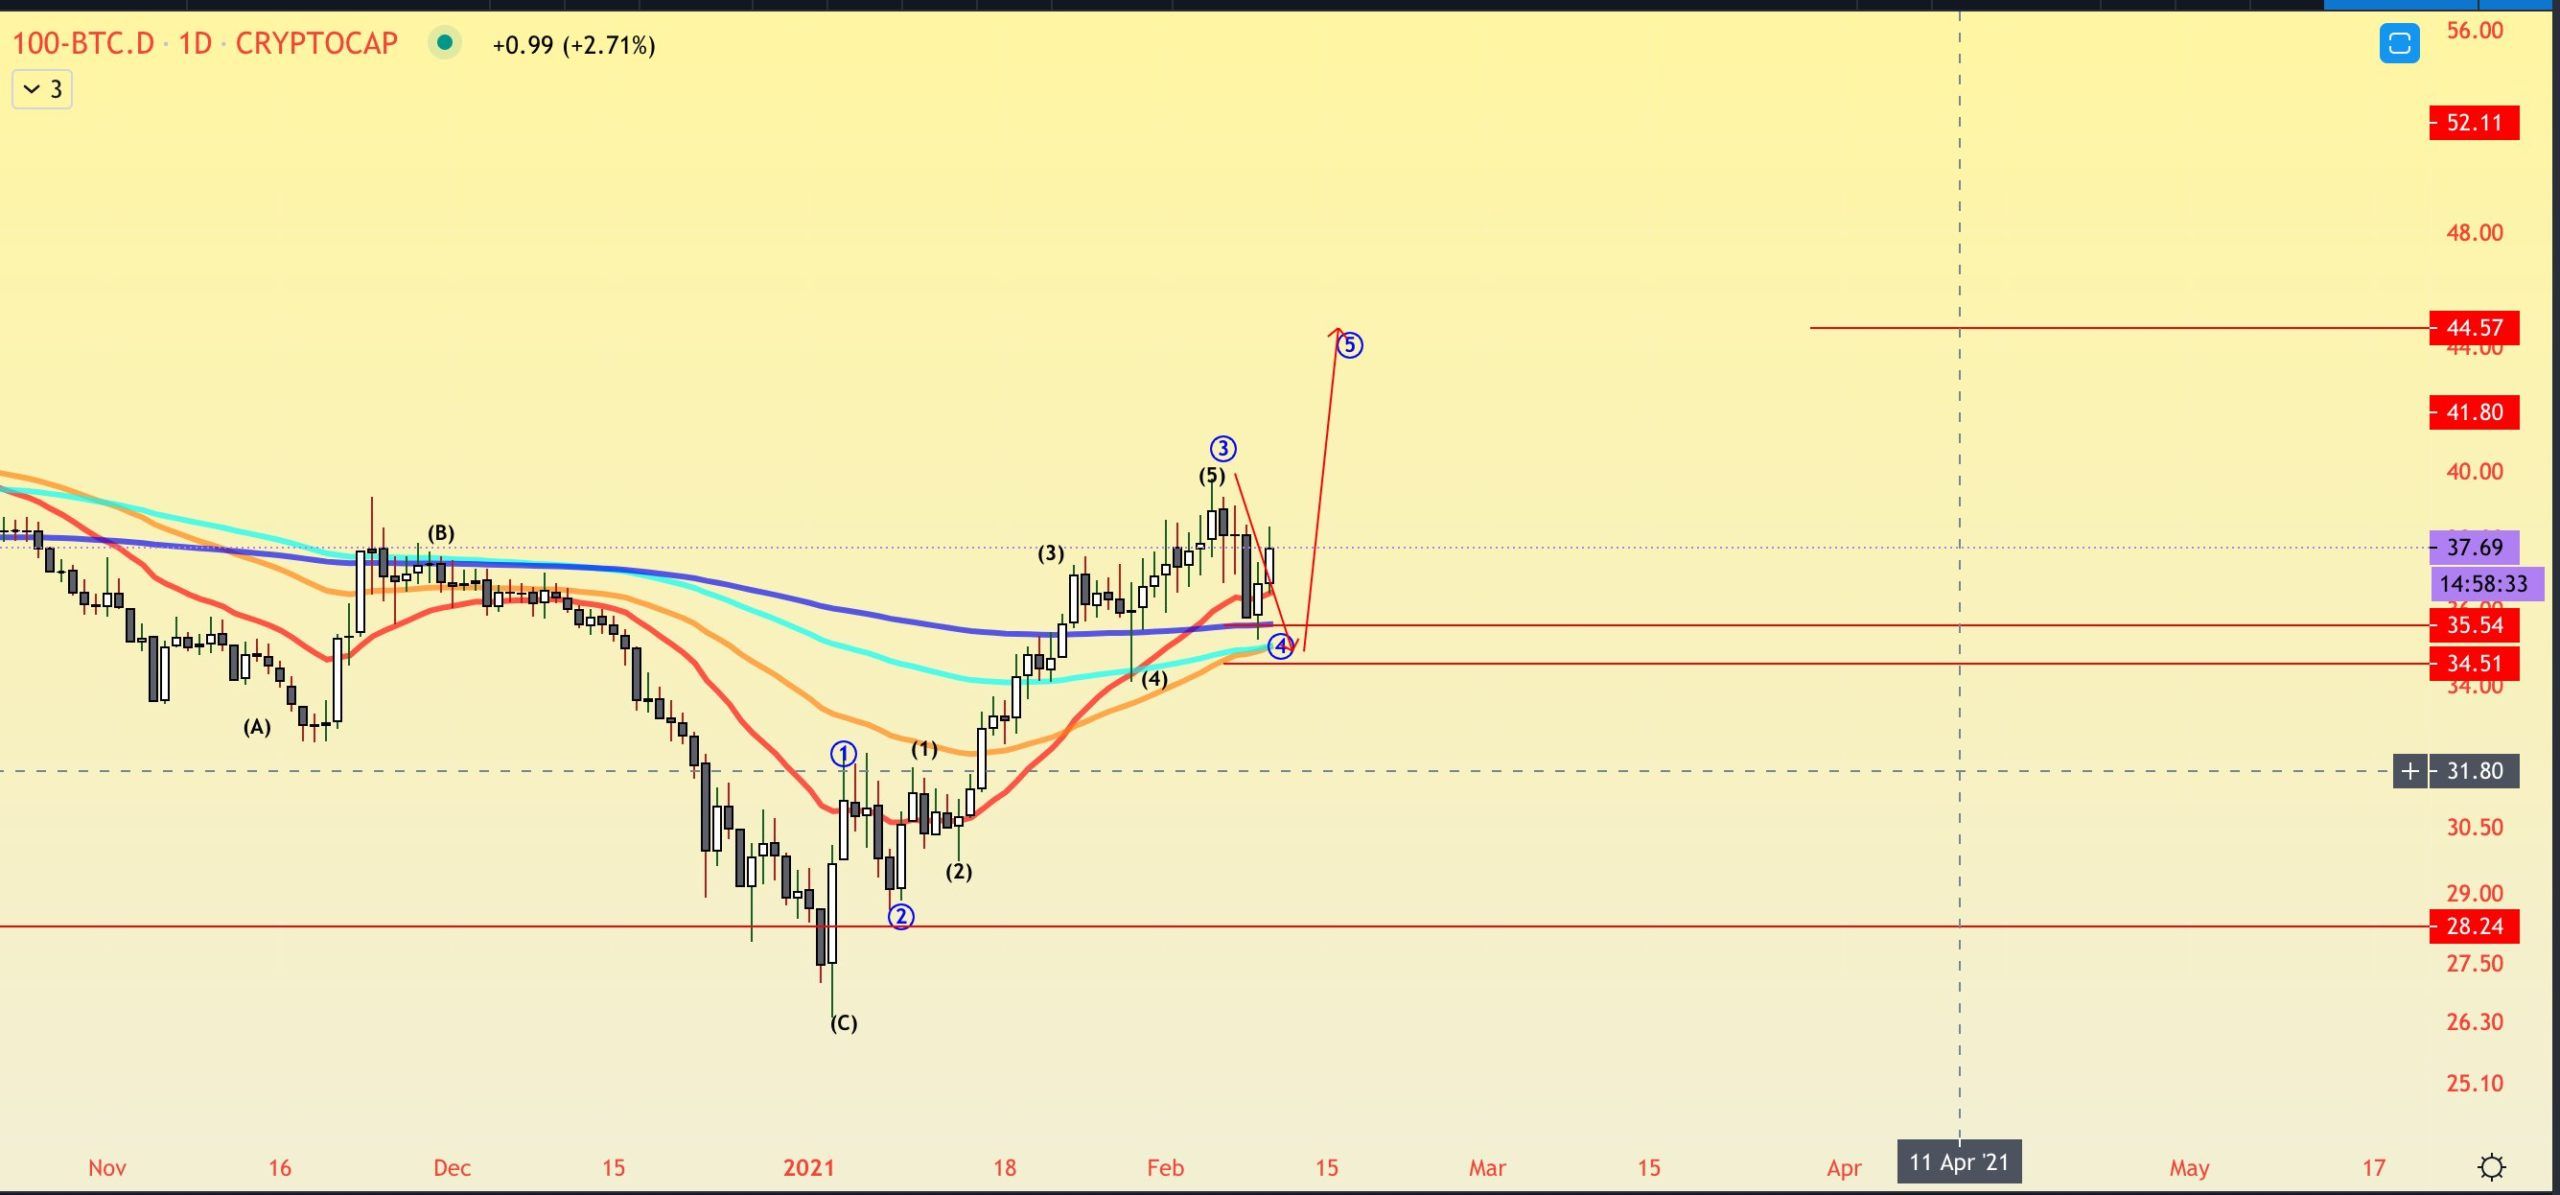
Cryptocurrency trader Altstreet Bets, @Altstreetbet, outlined a BTC dominance chart, stating that the pullback is complete and alts will now move upwards.
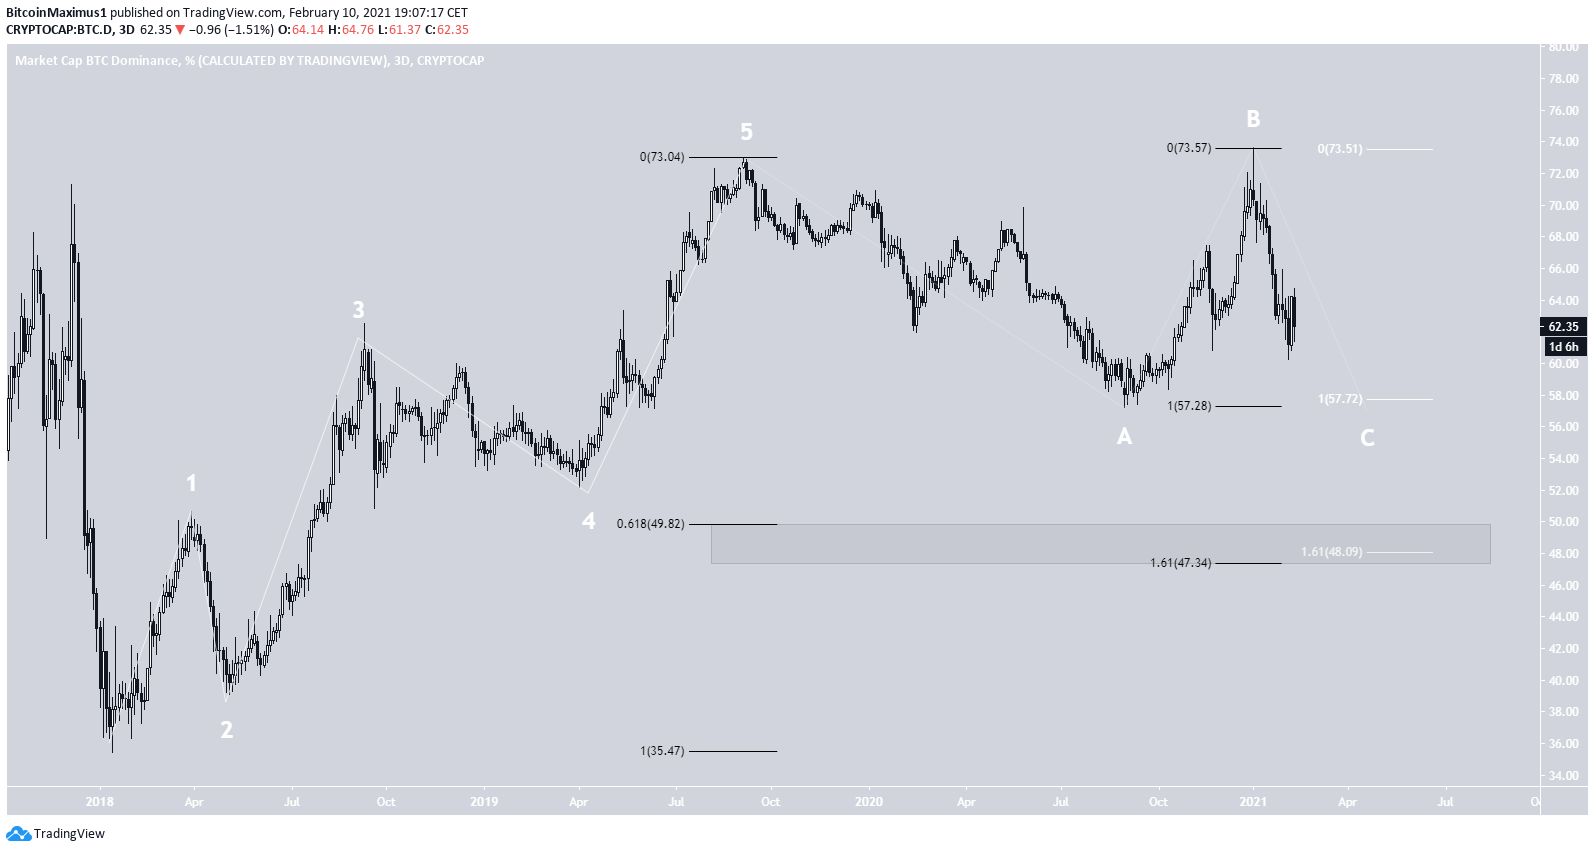
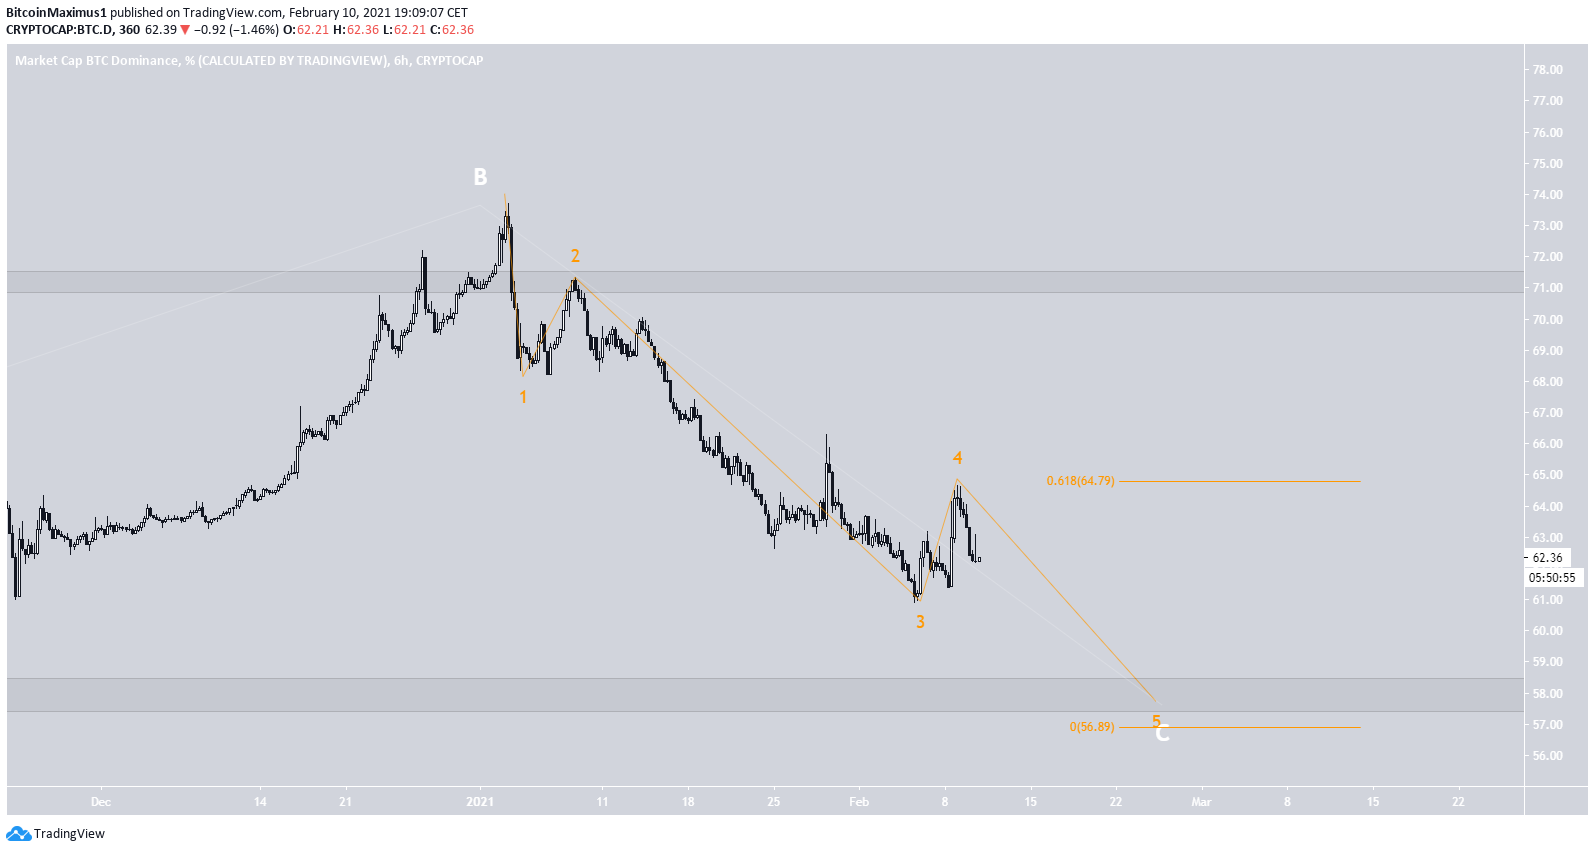
The long-term wave count suggests that BTCD is in the C wave of an A-B-C corrective structure (white).
The two most likely levels for the wave to end are found at 58% and 48% respectively.
The 58% level is a long-term support area and would give waves A:C a 1:1 ratio.
The 48% area is a confluence of levels, being the 1.61 external retracement of wave B, the 0.618 Fib retracement of the entire upward move and would give waves A:C a 1:1.61 ratio.
At the time of writing, we cannot determine which is more likely.
The sub-wave count (orange) suggests that BTCD is in the final portion of the downward move which would complete the C wave.
The Fib projection on sub-waves 1-3 gives a target near 57%, aligning with the first target from the previous image.
If BTCD extends, it could reach the 48% area, but as it stands, 58% seems more likely.
Conclusion
To conclude, BTCD is expected to resume its downward movement towards 58% and potentially lower towards 48%.
For BeInCrypto’s latest Bitcoin (BTC) analysis, click here
The post BTCD Continues Descent As Altcoins Increase appeared first on BeInCrypto.


![Decentraland: Review & Beginner's Guide [current_date format=Y] 31 Decentraland: Review & Beginner's Guide](https://cryptheory.org/wp-content/uploads/2020/11/decentraland-02-gID_7-300x150.jpg)