BTCD Falls Back From Resistance But Manages to Hold on Above Support
3 min readTable of Contents
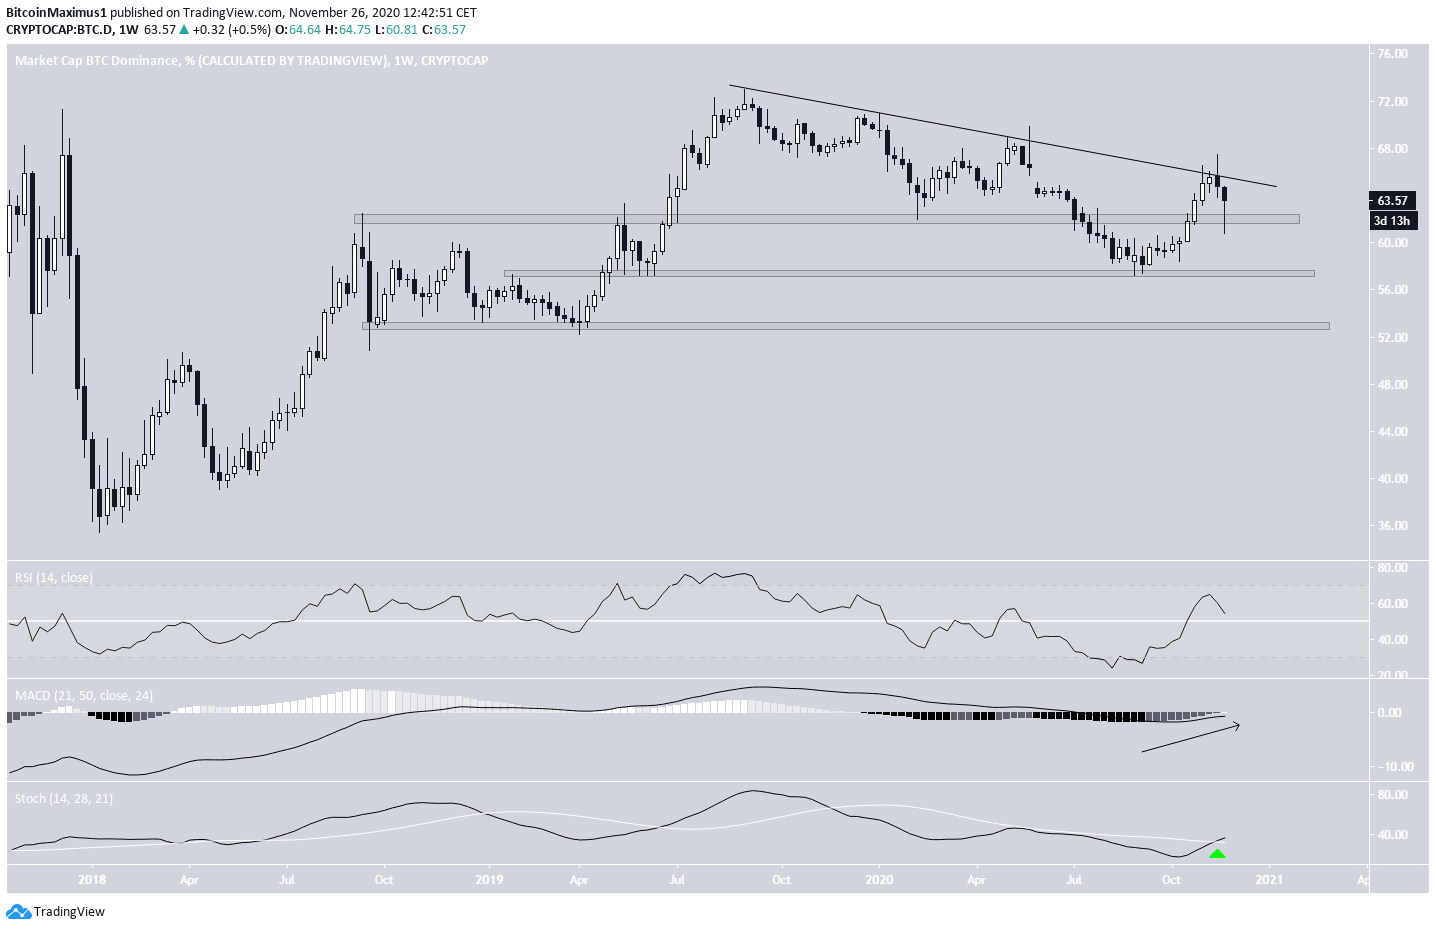
The Bitcoin Dominance Rate (BTCD) has been rejected by a long-term descending resistance line and has declined over the past week.
BTCD should continue decreasing until it reaches at least one of the support areas outlined below.
Long-Term Rejection
The BTCD has been increasing since it reached a low of 57.21% at the end of Aug. The rally continued until it reached a high of 67.41% on Nov 19.
This high served to validate a long-term descending resistance line for the fourth time and caused a sharp drop afterward. So far, BTCD has reached a low of 60.81%.
There are three main support areas, found at:
- 62.5%
- 57.5%
- 52.5%.
The rate has not traded below the latter since Sept 2017.
Technical indicators are bullish. The MACD is increasing and has almost crossed into positive territory. The Stochastic Oscillator has just made a bullish cross. Even though the weekly RSI is decreasing, it’s still above 50.
Therefore, at least on the weekly chart, it looks like the price will bounce at one of these support levels and eventually break out from the descending resistance line.

Future Movement
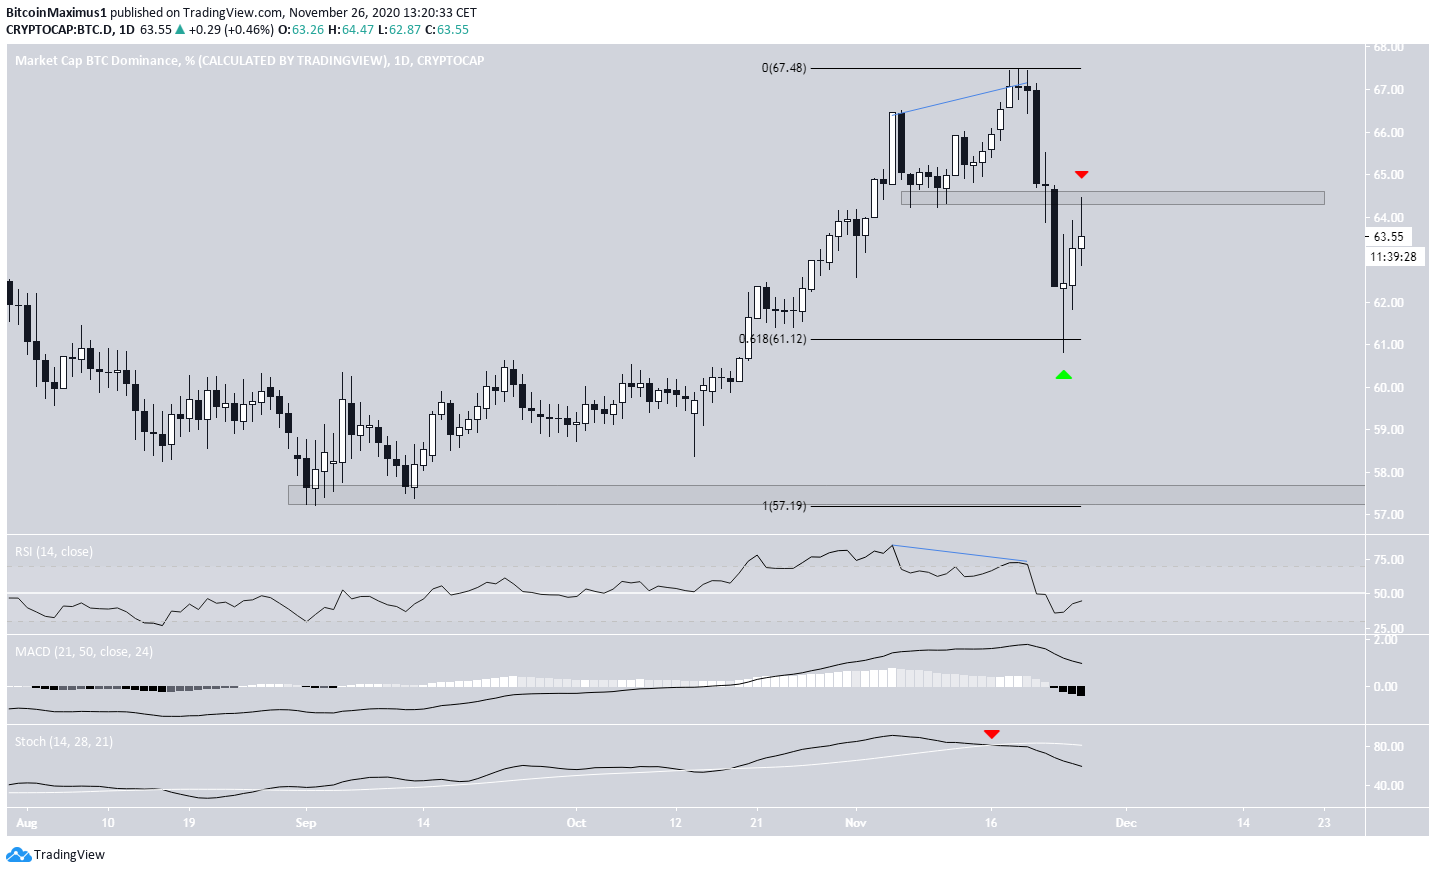
Cryptocurrency trader @CryptomobsterYT outlined a BTCD chart that shows how BTCD has fallen below the 62.5% area. They suggest that the rate will continue downwards in the foreseeable future.

The daily chart shows that the drop was preceded by a significant bearish divergence on the daily RSI, which has now dropped below 50. In addition, the Stochastic Oscillator has made a bearish cross and the MACD is decreasing, supporting the continuation of the downward move.
After the drop, BTCD bounced at the 0.618 Fib retracement level at 61.12% and is still increasing. However, the 64.5% area rejected it. This level previously acted as support and created a long upper wick.
Therefore, BTCD should continue falling towards the 57.5% support level.

ETH/BTC
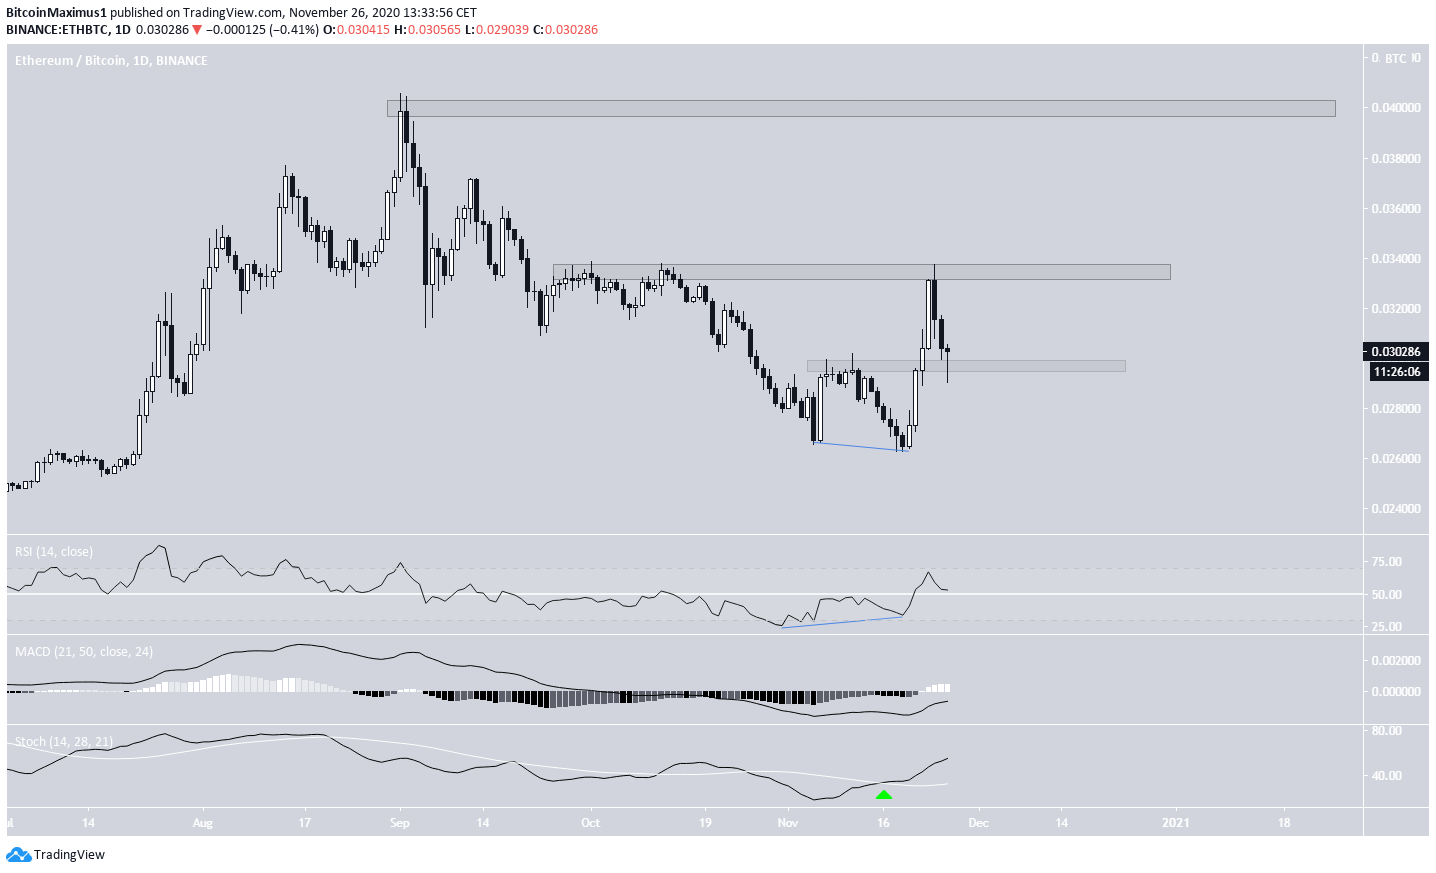
Since Ethereum (ETH) is the largest altcoin by market cap, the increase/decrease of the ETH/BTC pair is often a good predictor of BTCD movements.
ETH/BTC has been increasing since Nov 18, when it reached a low of ₿0.026, a move that was preceded by significant bullish divergence on the RSI.
Currently, the price is in the process of re-testing the ₿0.0295 area as support. A continued price rally and a breakout from the ₿0.033 area would likely trigger a sharp upward move towards ₿0.04.
Technical indicators are bullish and support the possibility of this breakout, which would also fit with the BTCD projection.

Conclusion
To conclude, while BTCD is likely to fall towards 57.5%, the long-term trend could still be bullish and a bounce is likely after BTCD reaches its target. On the other hand, the ETH/BTC pair should continue moving upwards.
For BeInCrypto’s previous Bitcoin analysis, click here!
Disclaimer: Cryptocurrency trading carries a high level of risk and may not be suitable for all investors. The views expressed in this article do not reflect those of BeInCrypto
The post BTCD Falls Back From Resistance But Manages to Hold on Above Support appeared first on BeInCrypto.


![Decentraland: Review & Beginner's Guide [current_date format=Y] 29 Decentraland: Review & Beginner's Guide](https://cryptheory.org/wp-content/uploads/2020/11/decentraland-02-gID_7-300x150.jpg)