BTCD Gets Rejected at 48% – Will Alts Rally?
2 min readThe BTC dominance rate (BTCD) has been moving upwards since May 19, when it bounced at the long-term 39.50% support area.
However, it was rejected by a long-term descending resistance line and indicators are gradually turning bearish.
Bounce at long-term support
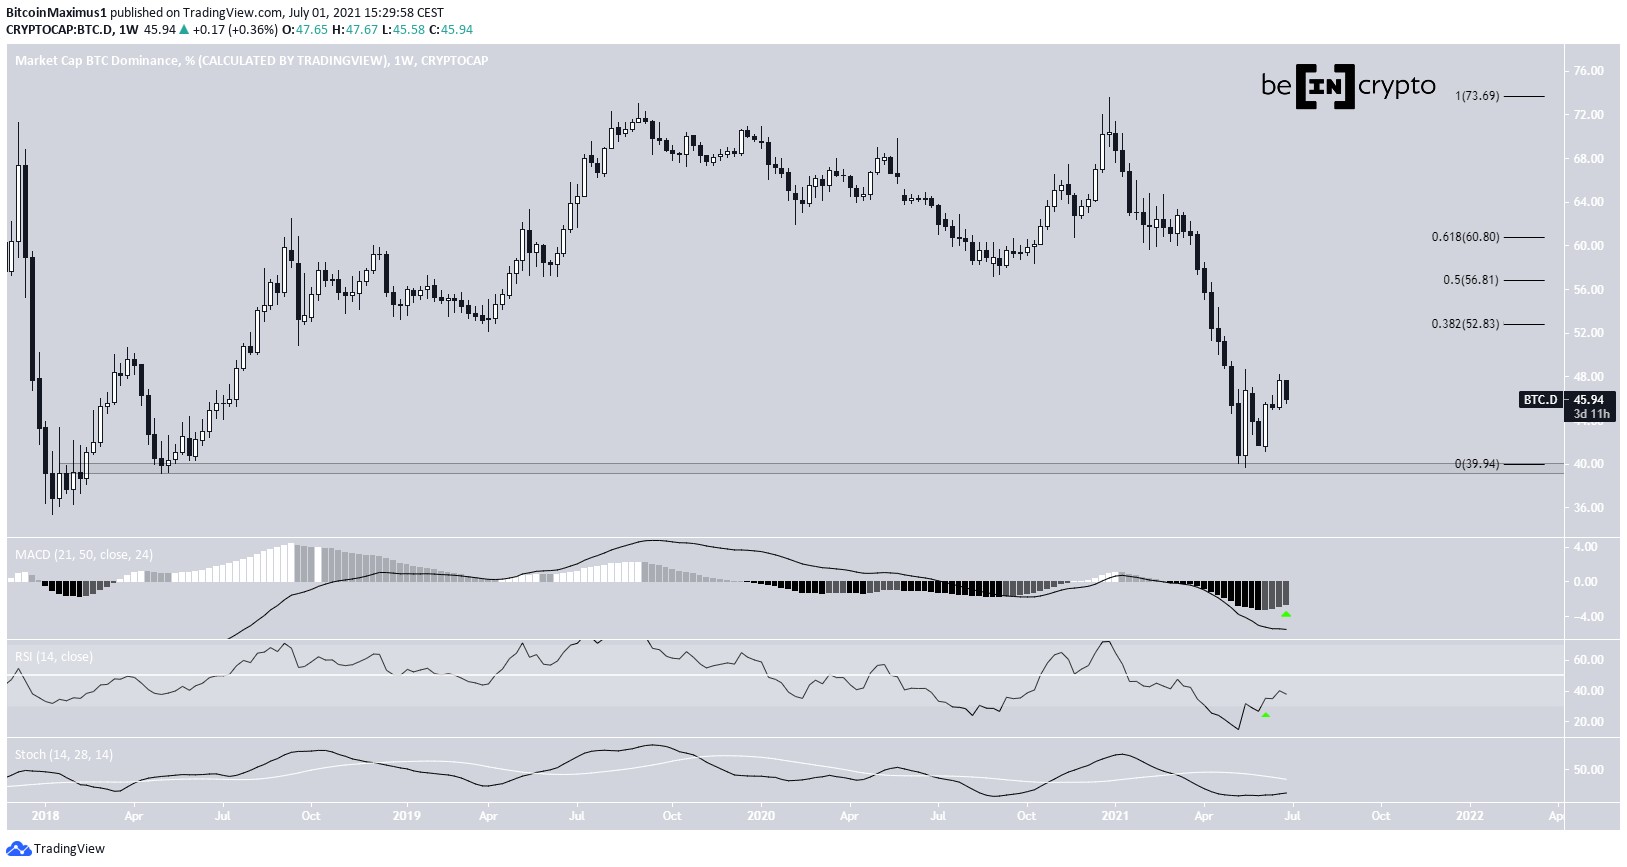
BTCD has been moving downwards since Dec. 2020, when it was trading at a high of 73.63%. The downward movement continued until May 2021, when a low of 39.66% was reached. The bounce occurred right at the 39.60% horizontal support area.
The next week, BTCD created a bullish engulfing candlestick. Technical indicators are showing some bullish signs. The MACD has given a bullish reversal signal and the RSI has crossed above 30 (green icons).
However, the MACD signal line is negative, the RSI is below 50 and the Stochastic oscillator has not yet made a bullish cross. Therefore, the trend cannot be considered bullish.
The closest resistance levels are at 52.8% and 56.8% respectively.
Future movement
However, the daily chart provides a more bearish outlook.
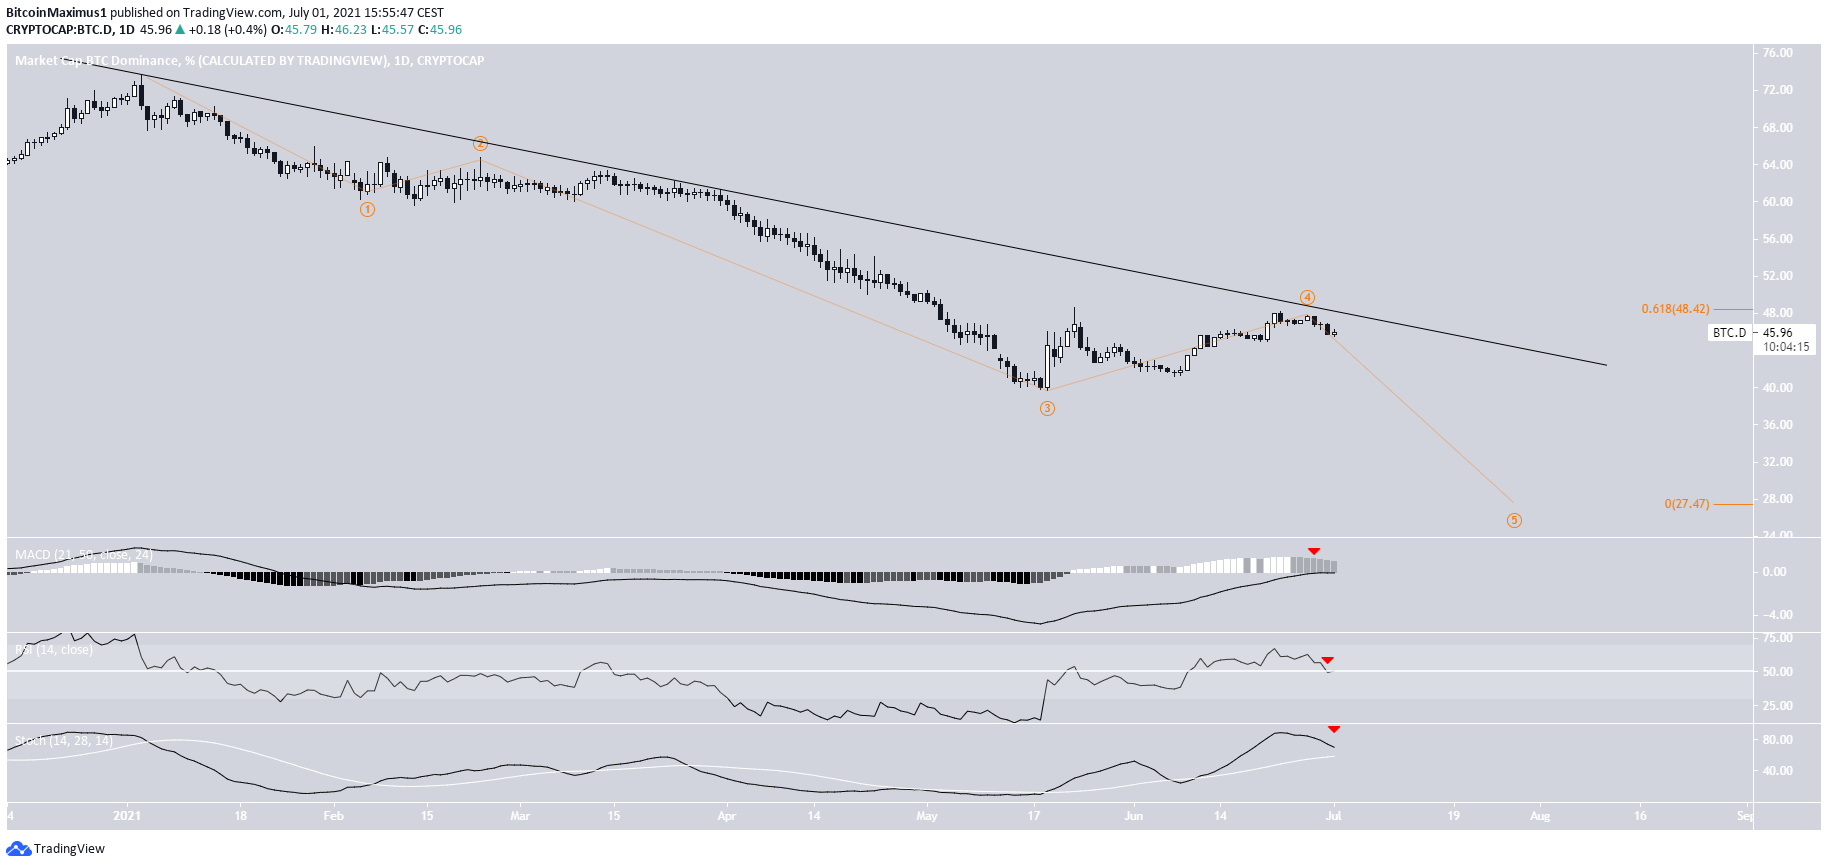
Since the aforementioned Dec. 2020 high, it seems that BTCD is in a five wave bearish impulse (orange). If so, it is currently in wave four. A potential target for the entire downward movement is found at 27.50%.
Technical indicators are turning bearish. The MACD has given a bearish reversal signal, the RSI is in the process of falling below 50 while the Stochastic oscillator is very close to making a bearish cross.
On top of this, BTCD is following a descending resistance line.
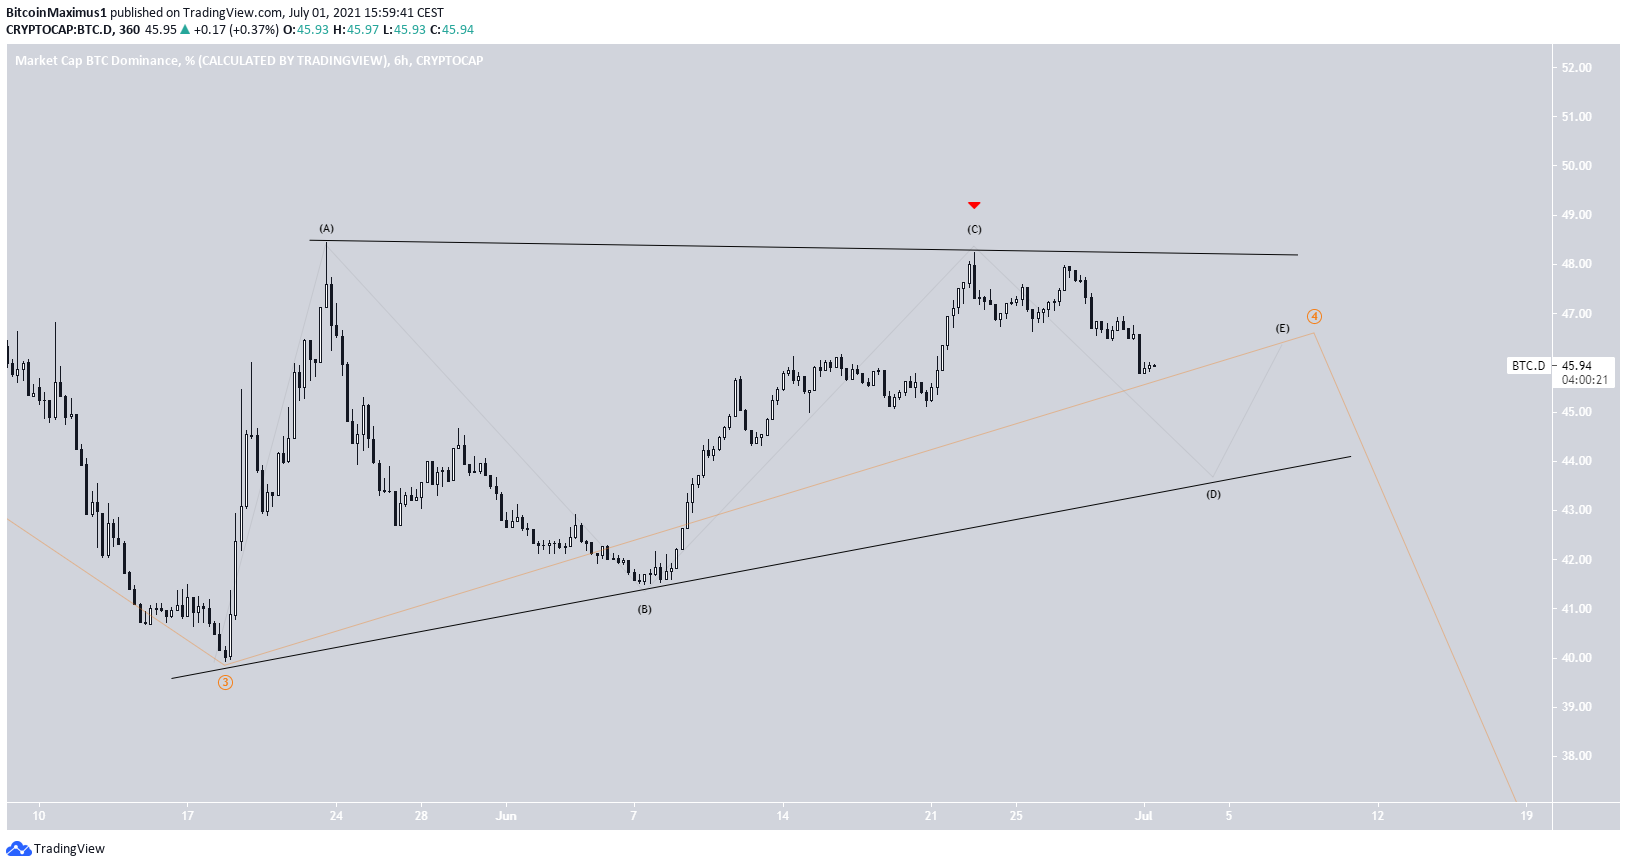
The exact sub-wave count (black) of wave four is not clear. While it is possible that it ended with the June 23 high (red icon), the count could also develop into a 4th wave triangle (black).
Both would have a very similar end result.
ETH/BTC
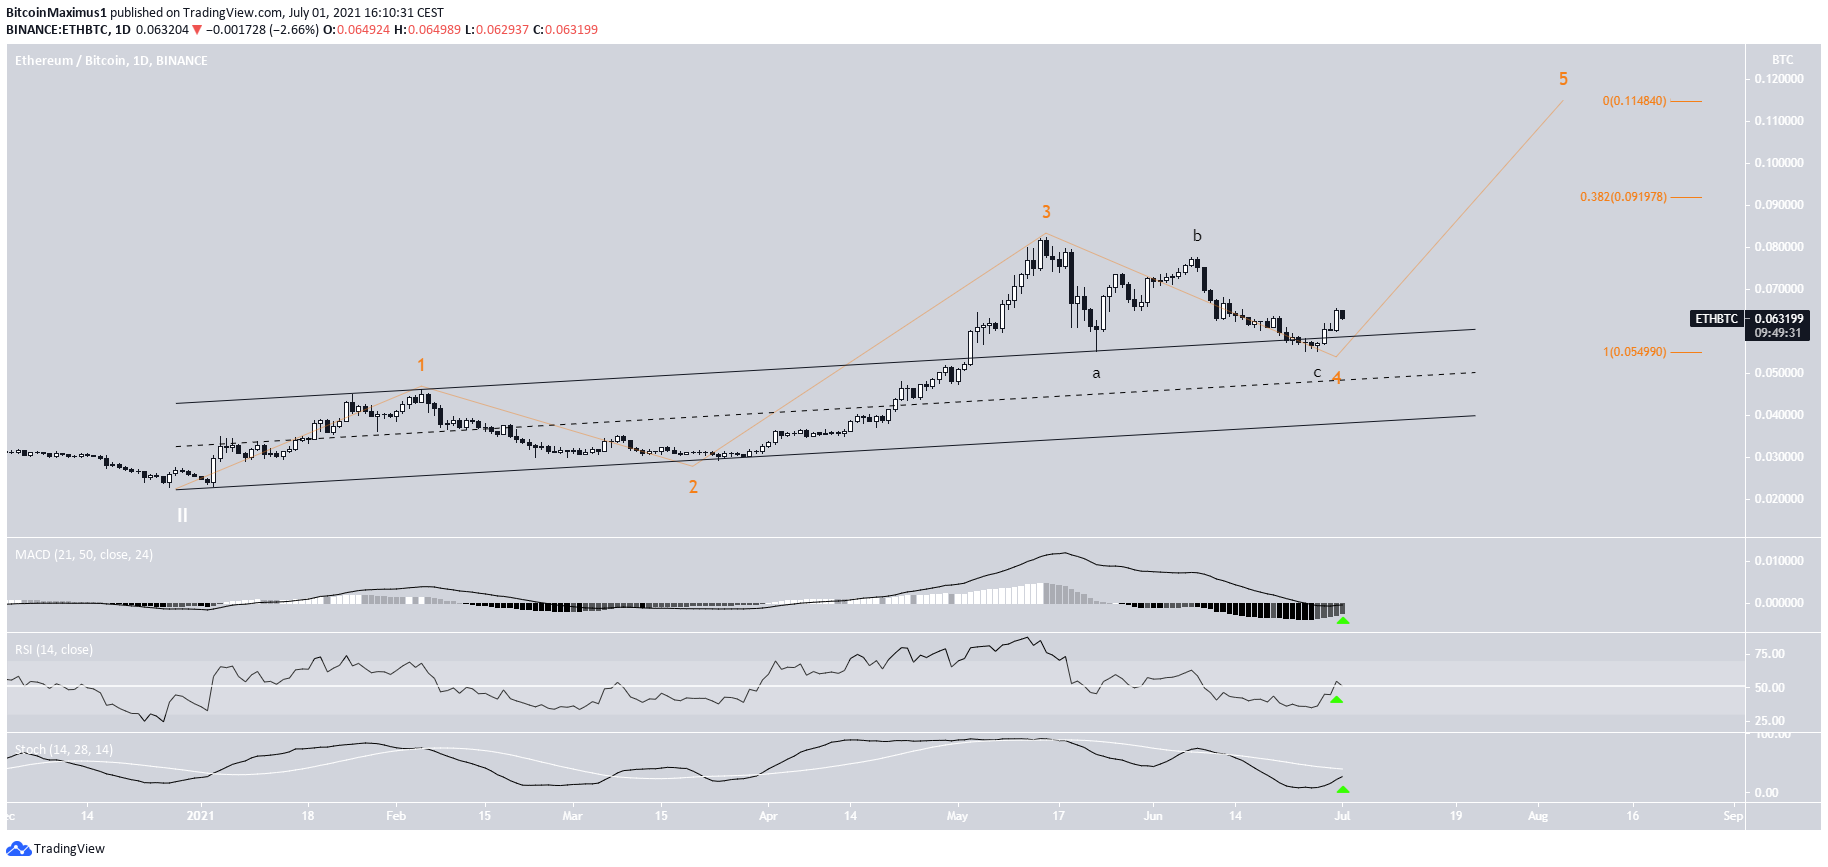
Cryptocurrency trader @DaanCrypto outlined an ETH/BTC chart, stating that whether it breaks out or down from ₿0.064 will be a crucial determinant of the future trend.
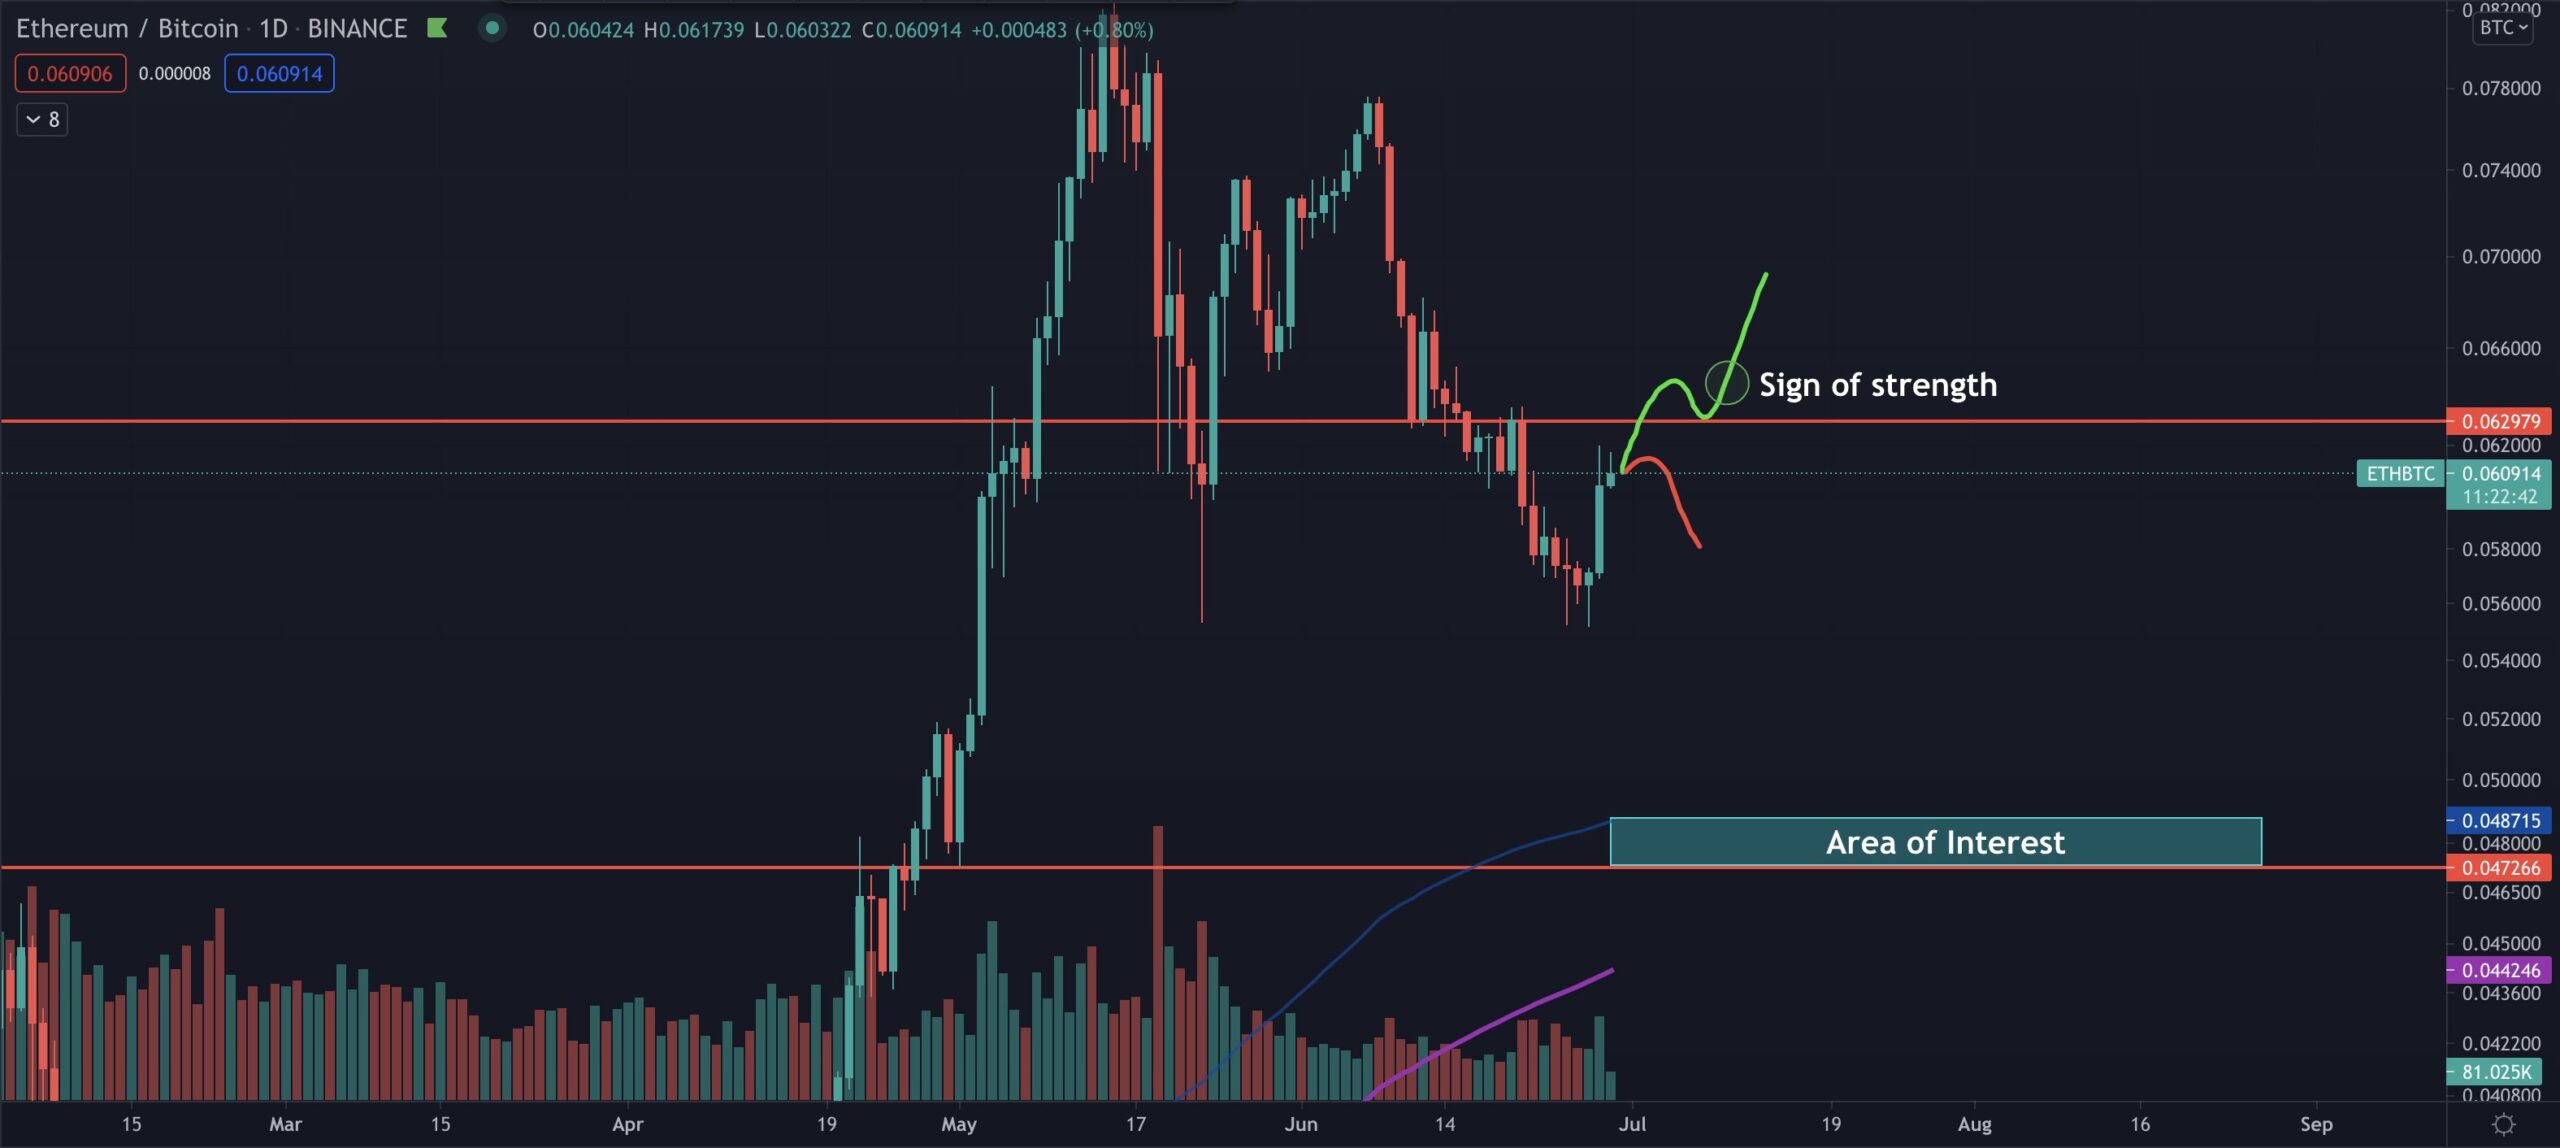
ETH/BTC has been moving upwards since June 27. Technical indicators have almost confirmed the bullish reversal.
The MACD is nearly positive, the RSI has moved above 50 and the Stochastic oscillator is very close to making a bullish cross.
It seems that ETH/BTC has completed a fourth wave pullback. If so, the two most likely targets for the top of the entire upward movement would be found at 0.092 and 0.115.
For BeInCrypto’s latest BTC (BTC) analysis, click here.
The post BTCD Gets Rejected at 48% – Will Alts Rally? appeared first on BeInCrypto.


![Decentraland: Review & Beginner's Guide [current_date format=Y] 31 Decentraland: Review & Beginner's Guide](https://cryptheory.org/wp-content/uploads/2020/11/decentraland-02-gID_7-300x150.jpg)