Chainlink (LINK) Reaches New All-Time High but Shows Signs of Weakness
2 min readTable of Contents
Chainlink (LINK) reached a new all-time high price of $28.64 on Feb. 10 but hasn’t moved much in either direction since.
Chainlink is showing bearish signs. A breakdown from the current pattern could cause a descent towards $22.80.
Chainlink Weekly Outlook
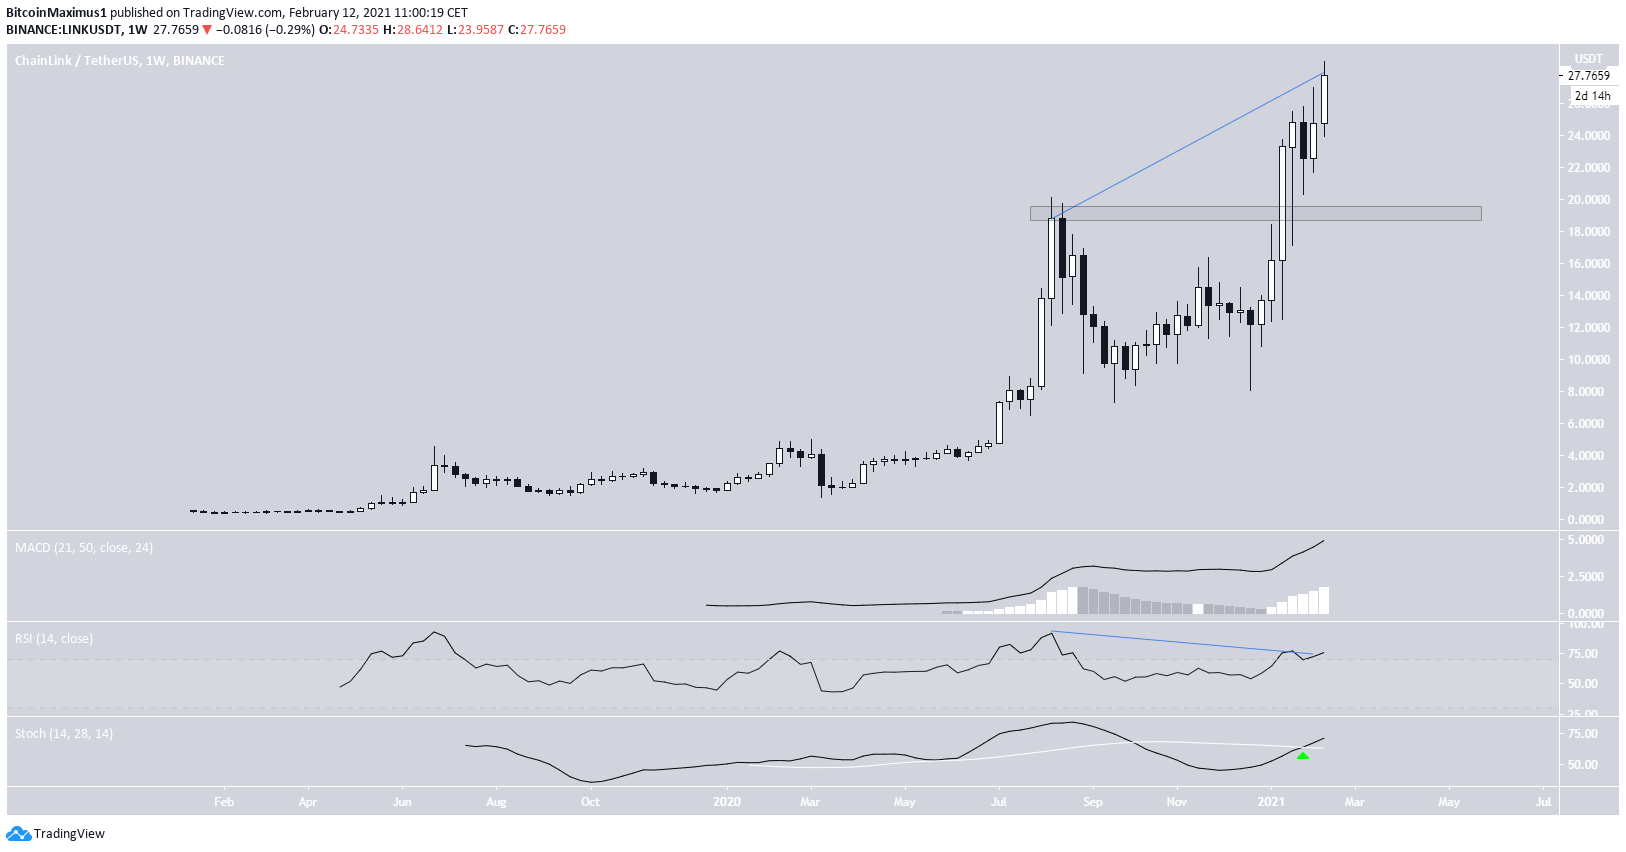
The weekly chart shows that LINK has been increasing since breaking out from and re-testing the previous all-time high resistance area at $19.
So far, LINK has reached a new all-time high price of $28.64 on Feb. 10
Technical indicators provide a mixed outlook. The MACD and Stochastic oscillator are increasing, indicating that the trend is likely bullish. However, the RSI has generated a considerable bearish divergence.
Therefore, a closer look at lower time-frames is required in order to predict where LINK is heading next.

New All-Time High?
Cryptocurrency trader @TheEuroSniper stated that LINK could go into a price discovery phase.
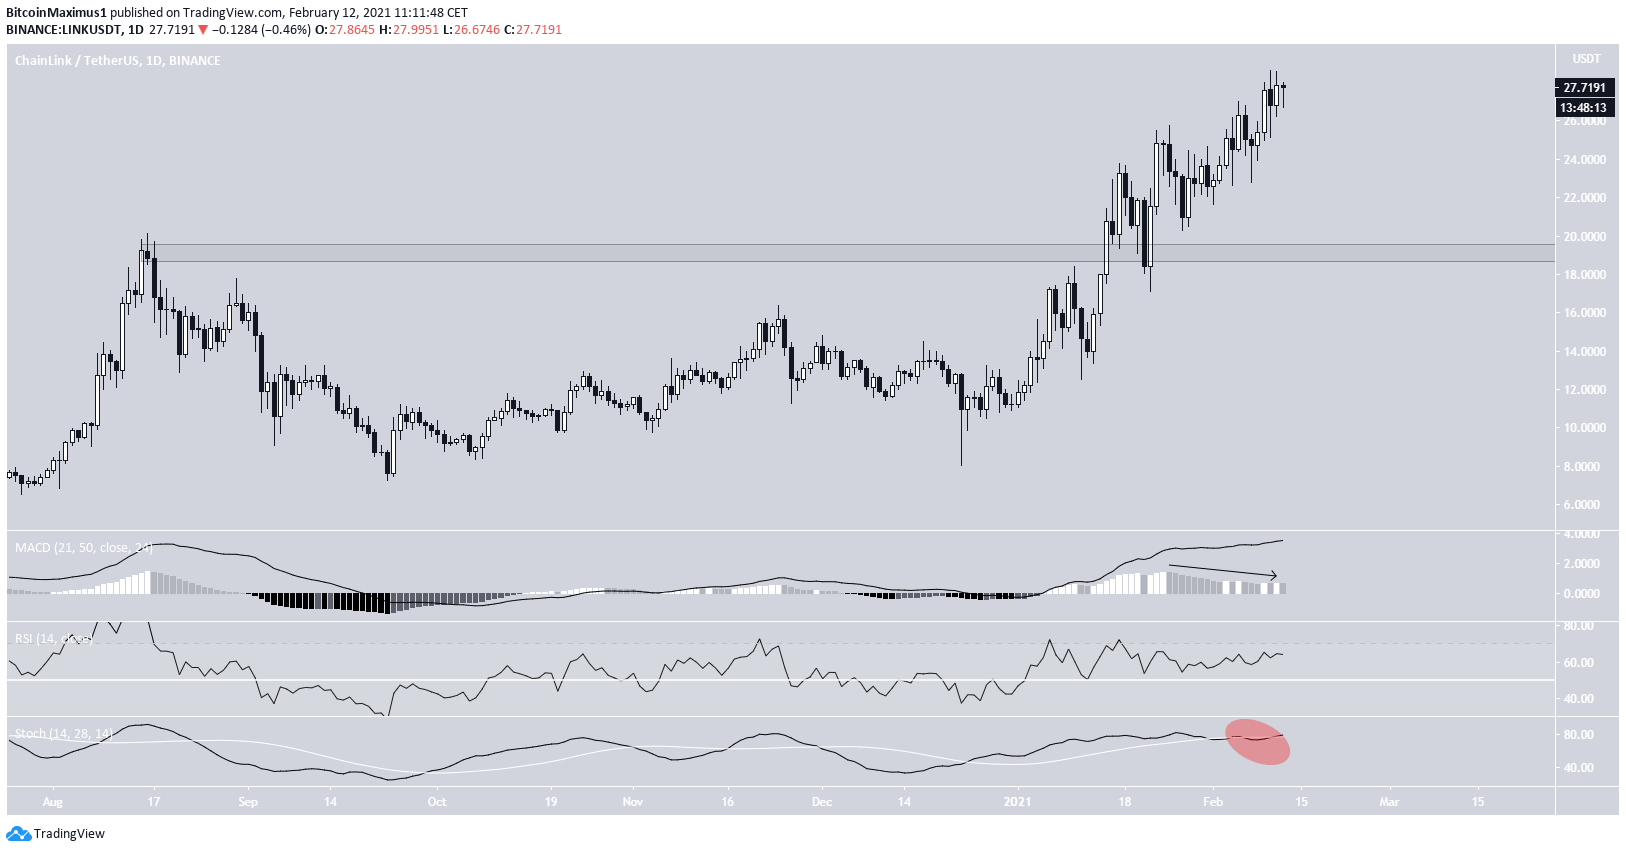
While LINK technically is already in price discovery, technical indicators in the daily time-frame also fail to provide a clear direction for the trend.
The MACD is decreasing, and both the RSI and Stochastic oscillator are neutral. The Stochastic oscillator has made numerous successive bullish and bearish crosses.

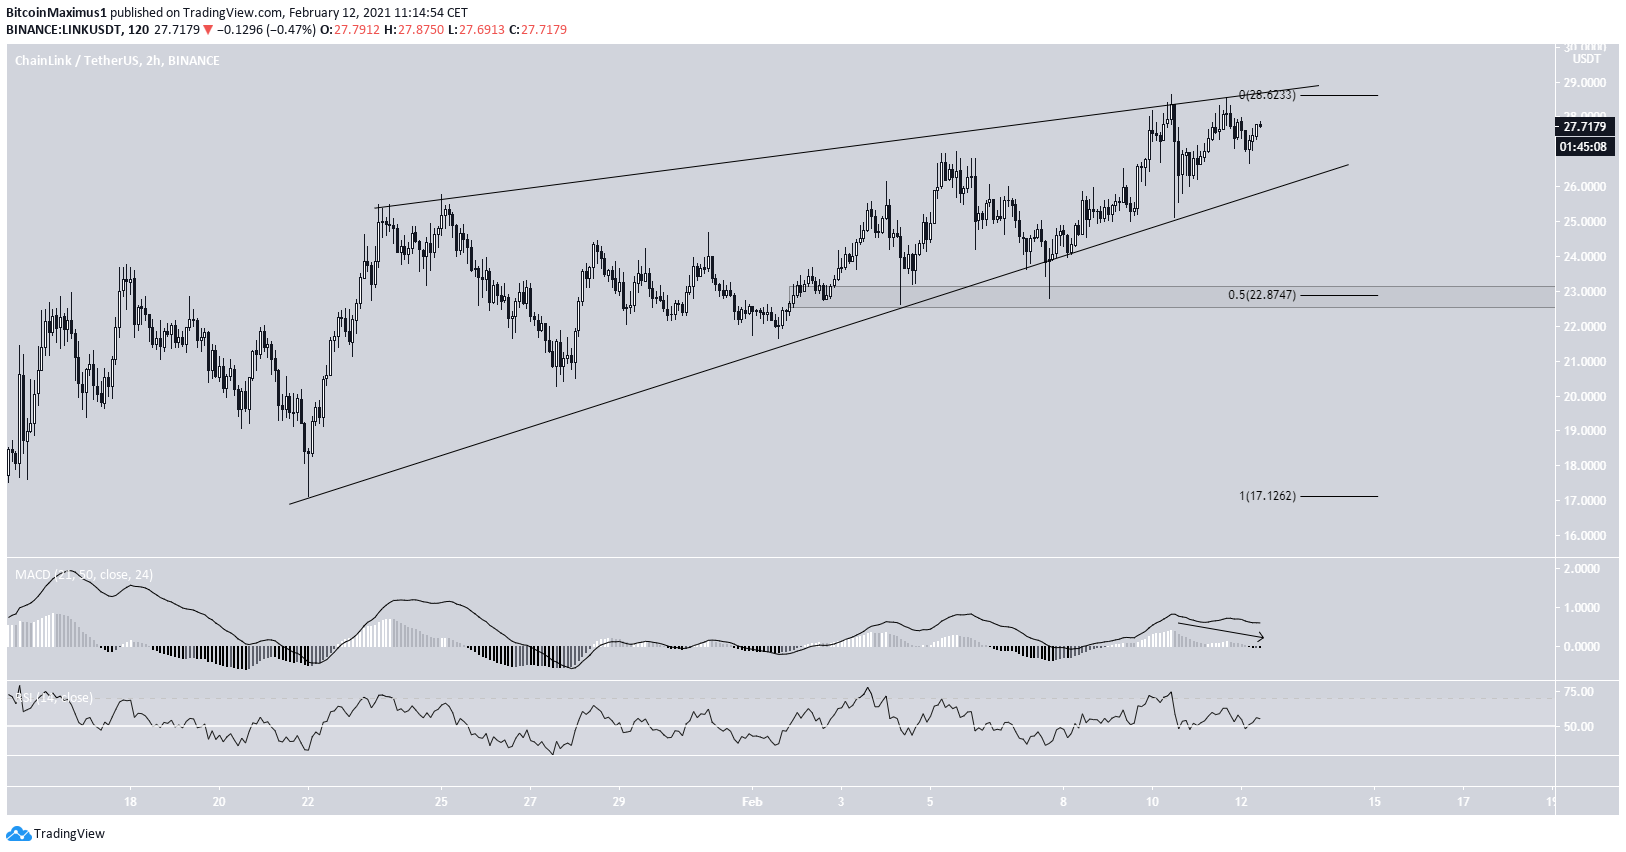
The two-hour chart shows an ascending wedge, which is considered a bearish reversal pattern. Furthermore, the MACD is decreasing and has crossed into negative territory.
If LINK were to break down, the closest support area would be found at $22.90 (0.5 Fib retracement level).

LINK/BTC
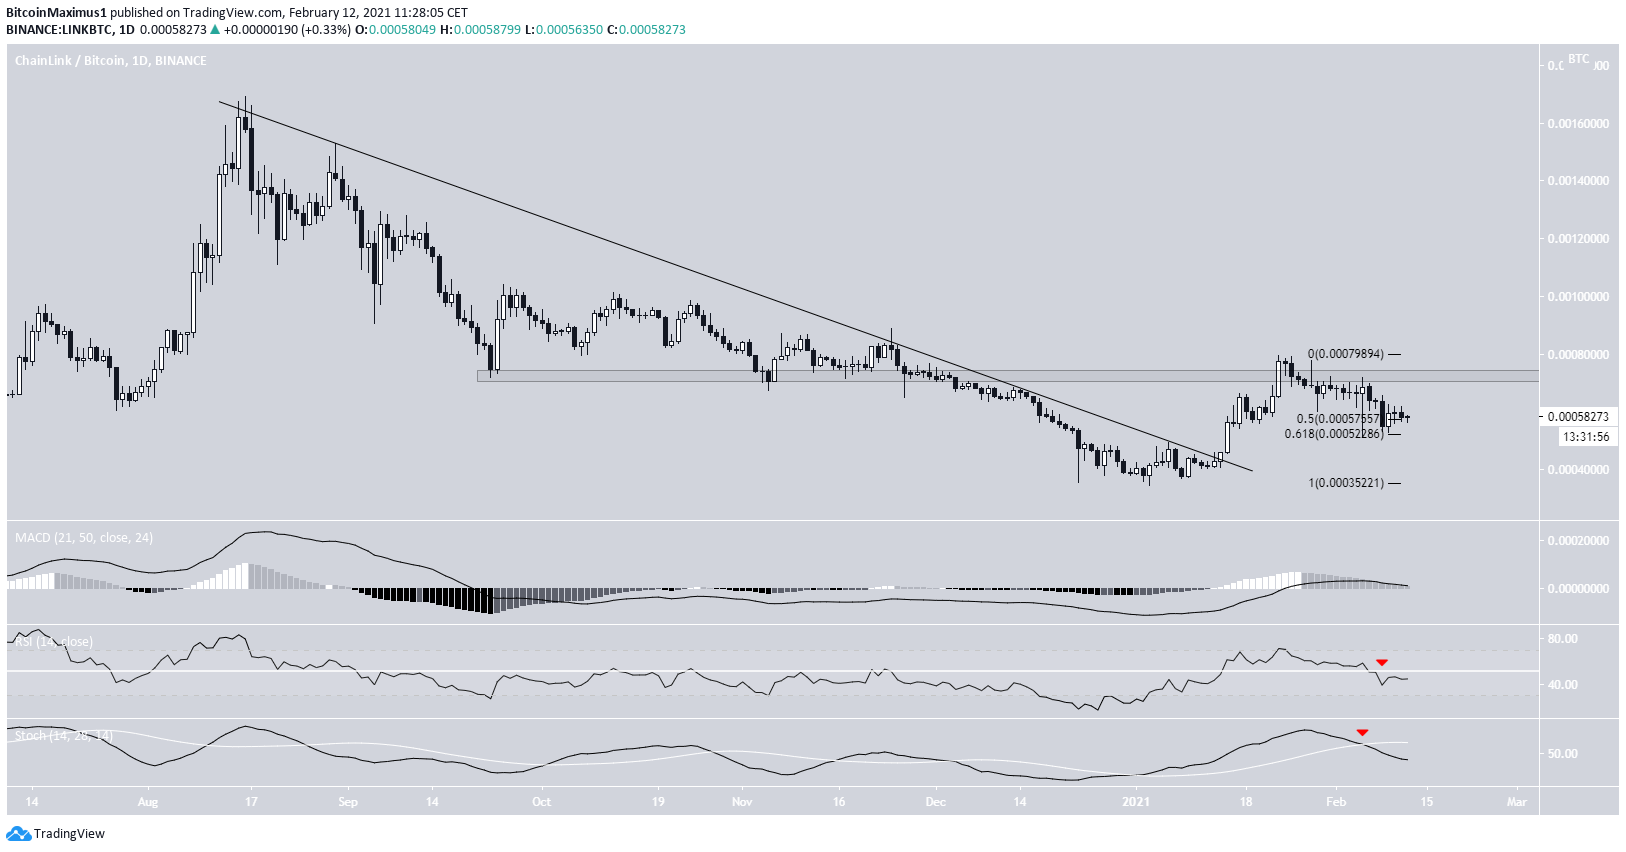
The LINK/BTC chart shows a breakout from a descending resistance line that had previously been in place since August 2020.
Despite the breakout, LINK has failed to clear the previous support area, now turned resistance, at 72,000 satoshis. Until moves above this level, we cannot consider the trend bullish.
Furthermore, while LINK is currently between the 0.5 and 0.618 Fib retracement levels, it has yet to create a higher low. This would be required for a bullish structure to emerge.
Since technical indicators are bearish, visible by the RSI cross below 50 and bearish cross in the Stochastic oscillator (red arrows), we cannot state with confidence that a bullish reversal will occur.

Conclusion
It’s unclear if the long-term trend for LINK/USD is bullish or bearish. Due to the possibility of LINK trading inside a bearish pattern, a short-term drop towards $22.80 could occur before LINK potentially resumes its upward movement.
While LINK/BTC has broken out from a descending resistance line, it has not yet confirmed a bullish reversal.
For BeInCrypto’s latest Bitcoin (BTC) analysis, click here
The post Chainlink (LINK) Reaches New All-Time High but Shows Signs of Weakness appeared first on BeInCrypto.


![Decentraland: Review & Beginner's Guide [current_date format=Y] 29 Decentraland: Review & Beginner's Guide](https://cryptheory.org/wp-content/uploads/2020/11/decentraland-02-gID_7-300x150.jpg)