ETH Reaches Yet Another All-Time High —What’s Next?
2 min readETH (ETH) has been increasing since Feb. 23. On May 12, it managed to reach yet another all-time high of $4,370.
ETH is approaching a confluence of Fib resistance levels near $4,500, which could act as a temporary top.
New ETH all-time high
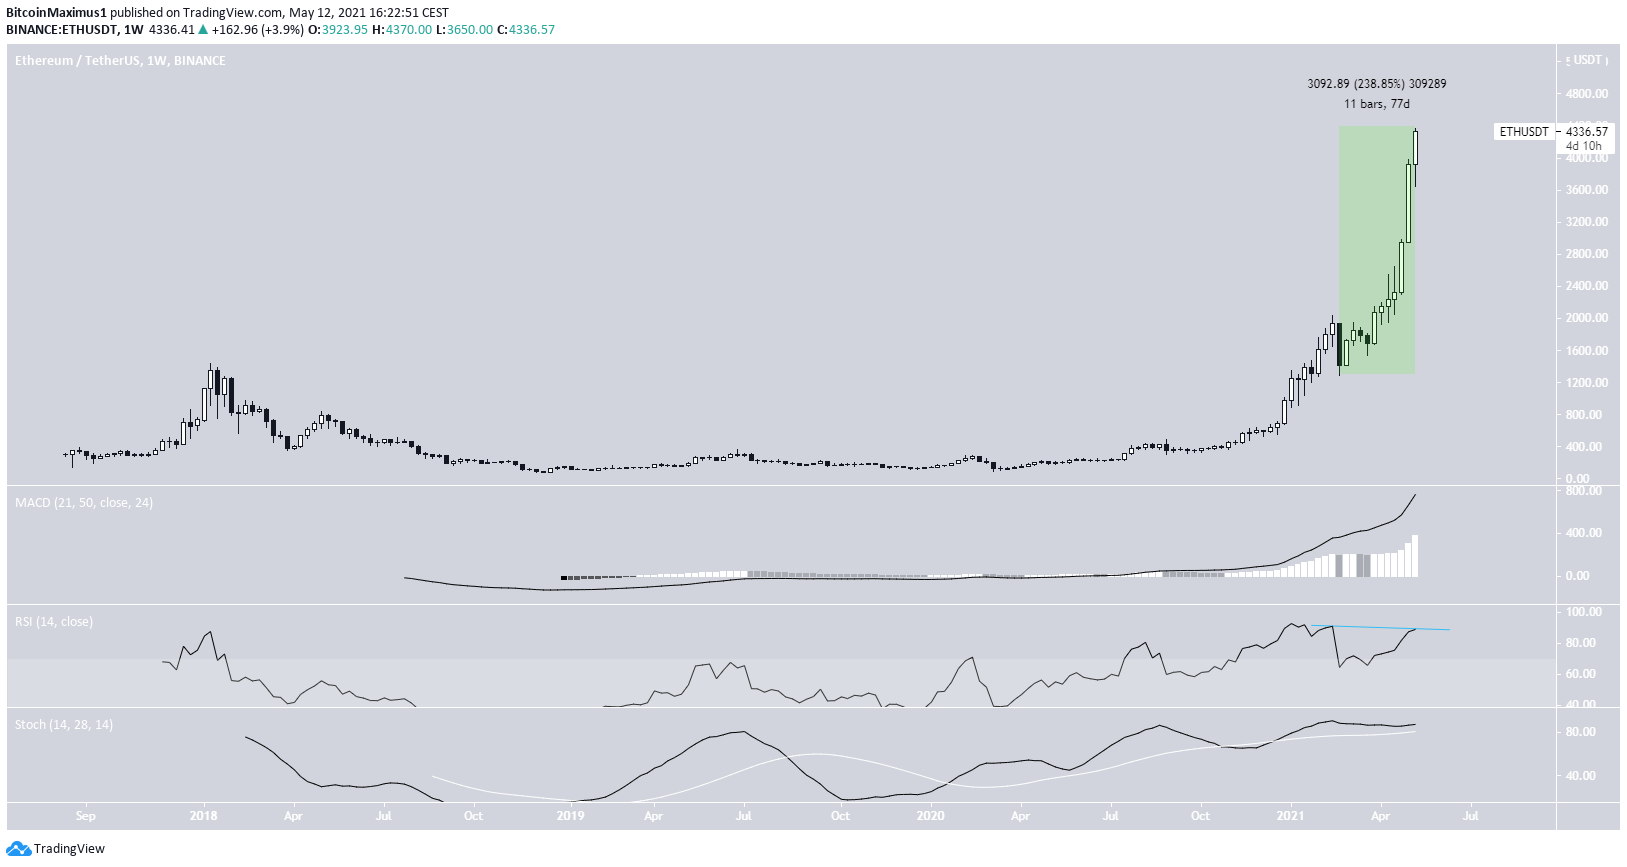
ETH has been moving upwards with strength since Feb. 23. In a period of 77 days, it has increased by nearly 240%. This led to an all-time high price of $4,370 being reached on May 12.
The rally is completely parabolic. Technical indicators are showing some weakness, but not enough to confirm the bearish reversal.
The RSI has generated bearish divergence, which however is still unconfirmed. While the Stochastic Oscillator has lost strength, it is still positive. In addition, the MACD is moving upwards.

Future movement
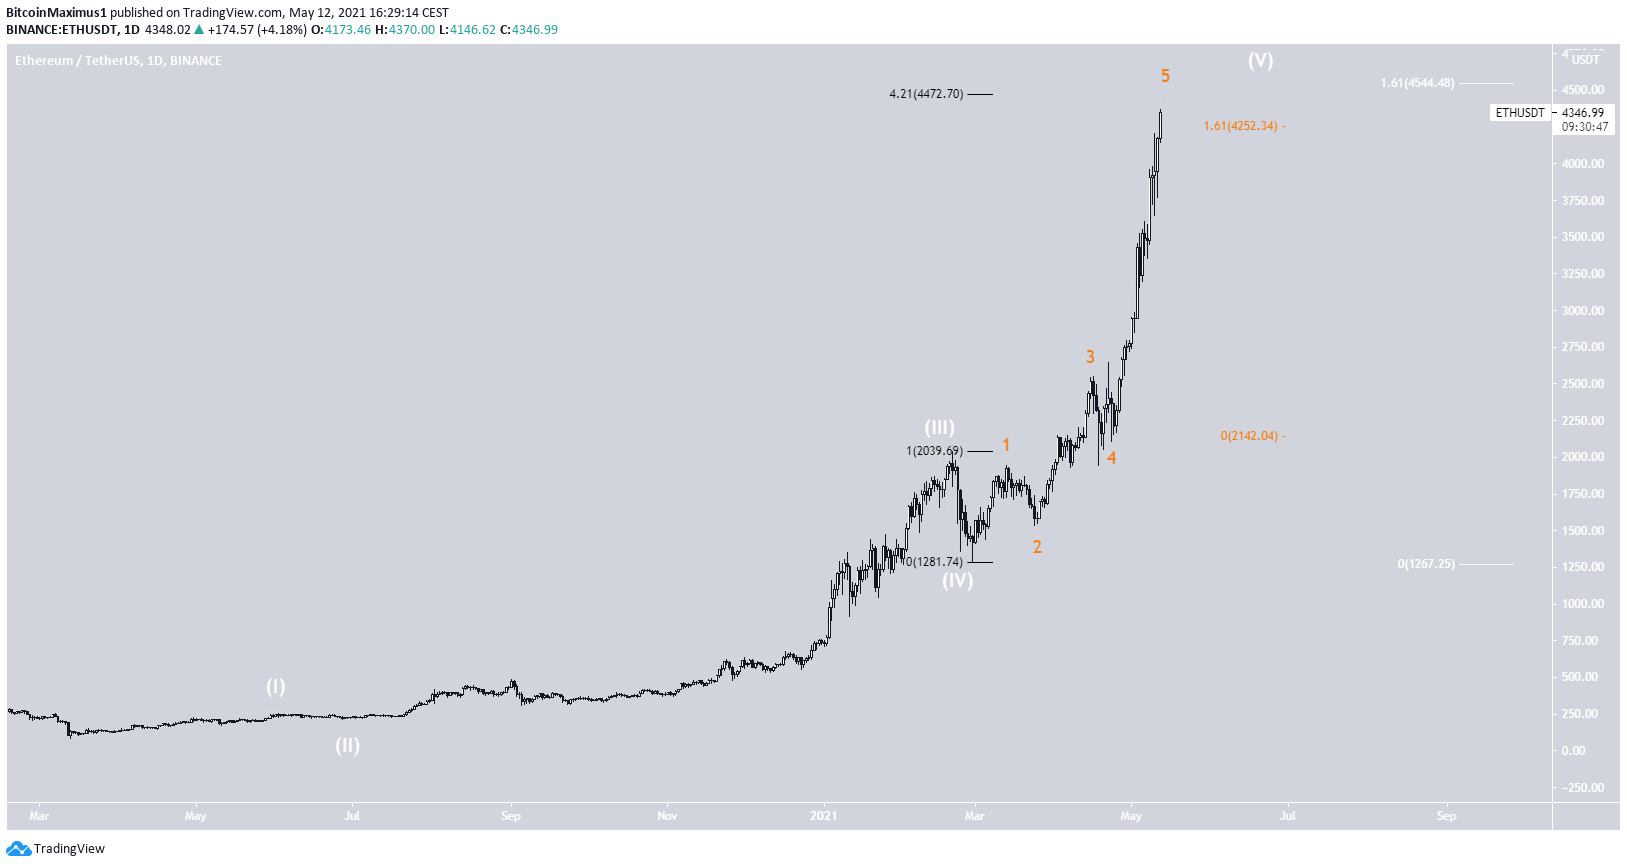
A closer look shows that ETH has been increasing at a rapid pace since April 23.
The wave count indicates that the price is likely approaching the top of wave five of a bullish impulse that began in March 2020.
It has already increased above the $4,147 area, created by the 1.61 Fib projection of sub-waves 1-3 (orange). Afterwards, the next most likely area for the top is found between $4,470 and $4,540. It is created using a Fib projection on waves 1-3 (white) and an external Fib retracement on wave four (black).

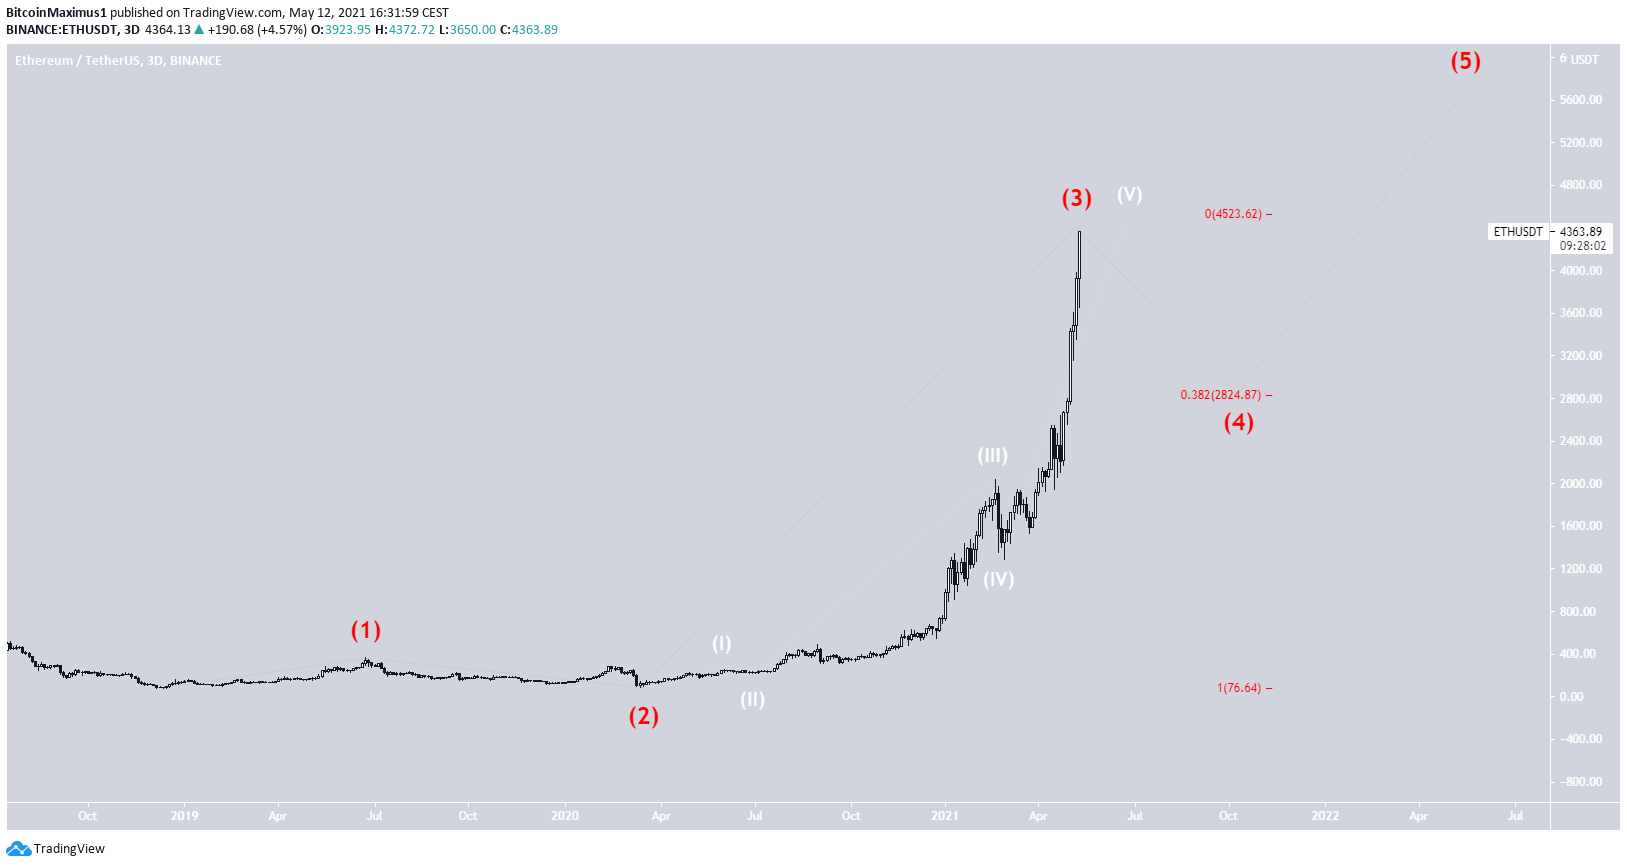
The longer-term count shows that this is likely an extended wave three (red) of a bullish impulse that began in December 2018. The first support would likely be found near $2,800, assuming a high near $4,500.

ETH/BTC
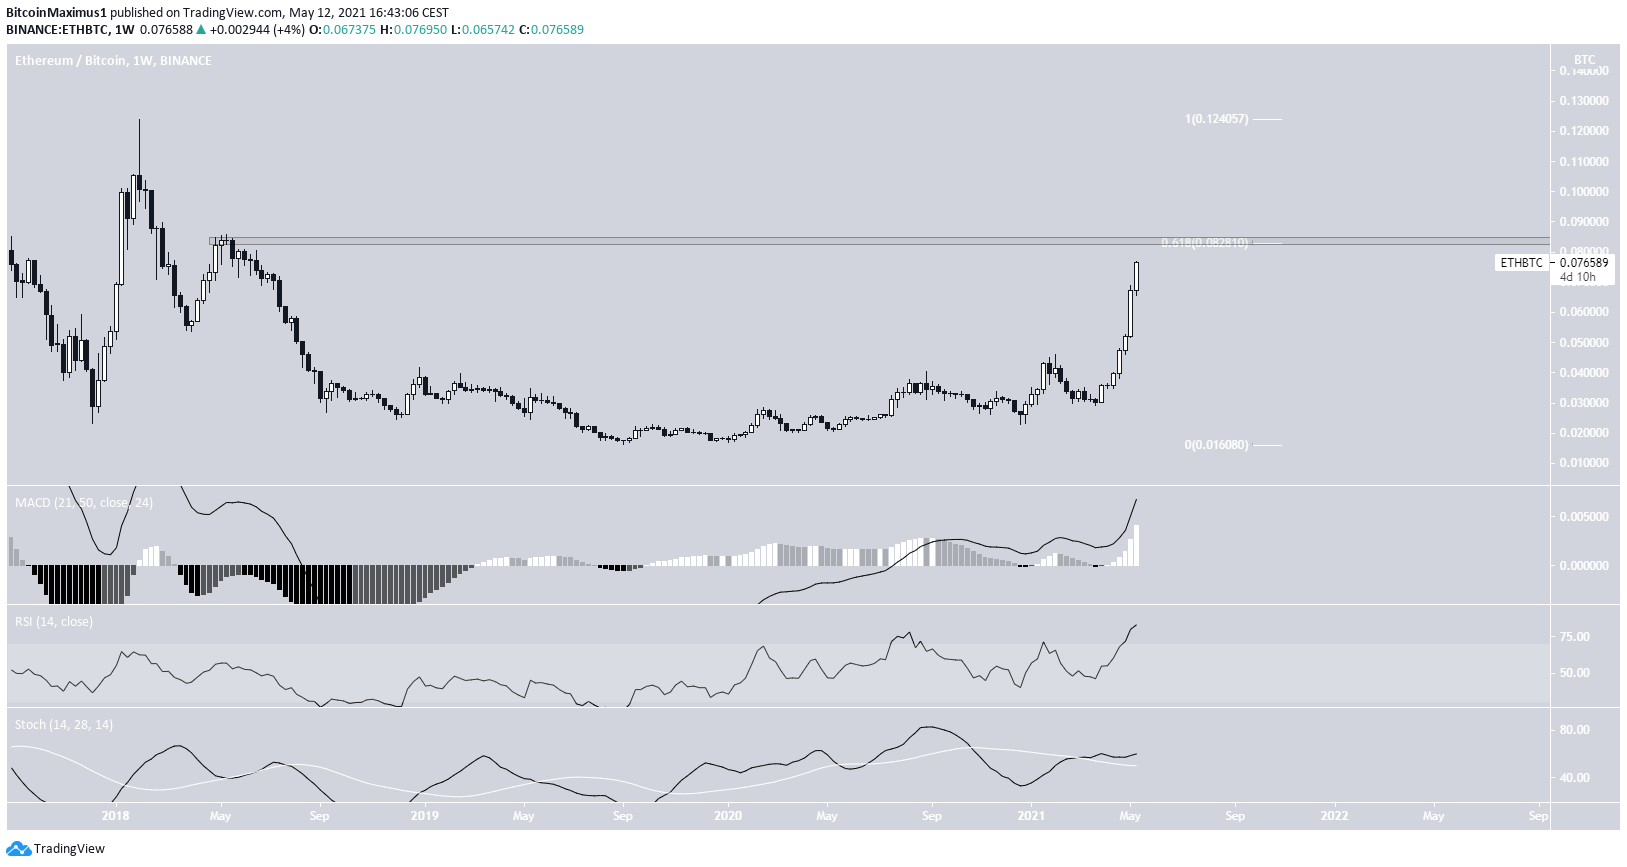
Similarly to its USD counterpart, ETH/BTC has increased significantly over the past seven weeks. It is approaching crucial resistance at ₿0.082, created by the 0.618 Fib retracement level. The level is also a horizontal resistance area.
Technical indicators are bullish, suggesting that the price is likely to get there.

To conclude, ETH/USD could reach a high near $4,500, before correcting. ETH/BTC is approaching resistance at ₿0.082.
For BeInCrypto’s latest BTC (BTC) analysis, click here.
The post ETH Reaches Yet Another All-Time High —What’s Next? appeared first on BeInCrypto.


![Decentraland: Review & Beginner's Guide [current_date format=Y] 28 Decentraland: Review & Beginner's Guide](https://cryptheory.org/wp-content/uploads/2020/11/decentraland-02-gID_7-300x150.jpg)