NFT Tokens Pump After Numerous Exchange Listings
3 min readChiliz (CHZ) has been decreasing since reaching an all-time high price on March 12. However, it has bounced at the support line of a channel.
Enjin Coin (ENJ) has been moving upwards since April 23, but has failed to reclaim a crucial resistance area.
Decentraland (MANA) broke out from a symmetrical triangle and validated it as support afterwards.
CHZ
CHZ has been moving downwards since reaching an all-time high price of $0.94 on March 12. While the token initiated a bounce on April 7, it only managed to create a lower high of $0.84. Another decrease followed afterwards.
So far, CHZ has reached a low of $0.321, doing so on April 23.
It seems that the token is trading inside a descending parallel channel, currently being in the lower portion of it. The channel is often considered a corrective movement. Therefore, a movement towards the resistance line at $0.75 or potential breakout would be expected.
Technical indicators are neutral/bullish, failing to confirm this possibility.
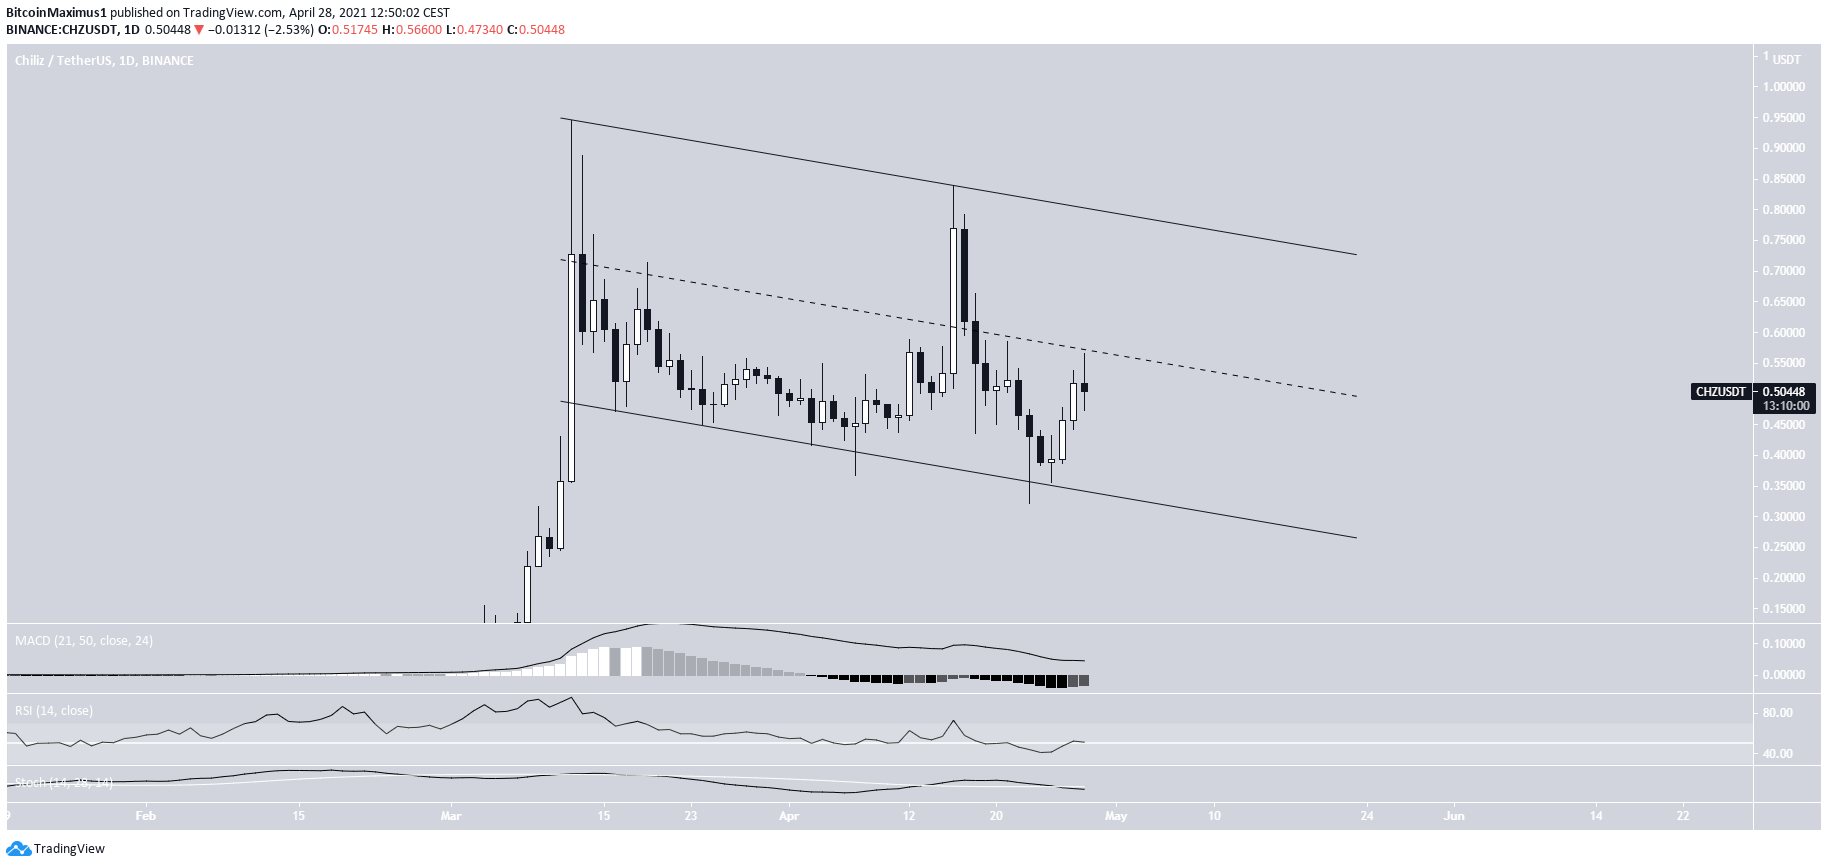
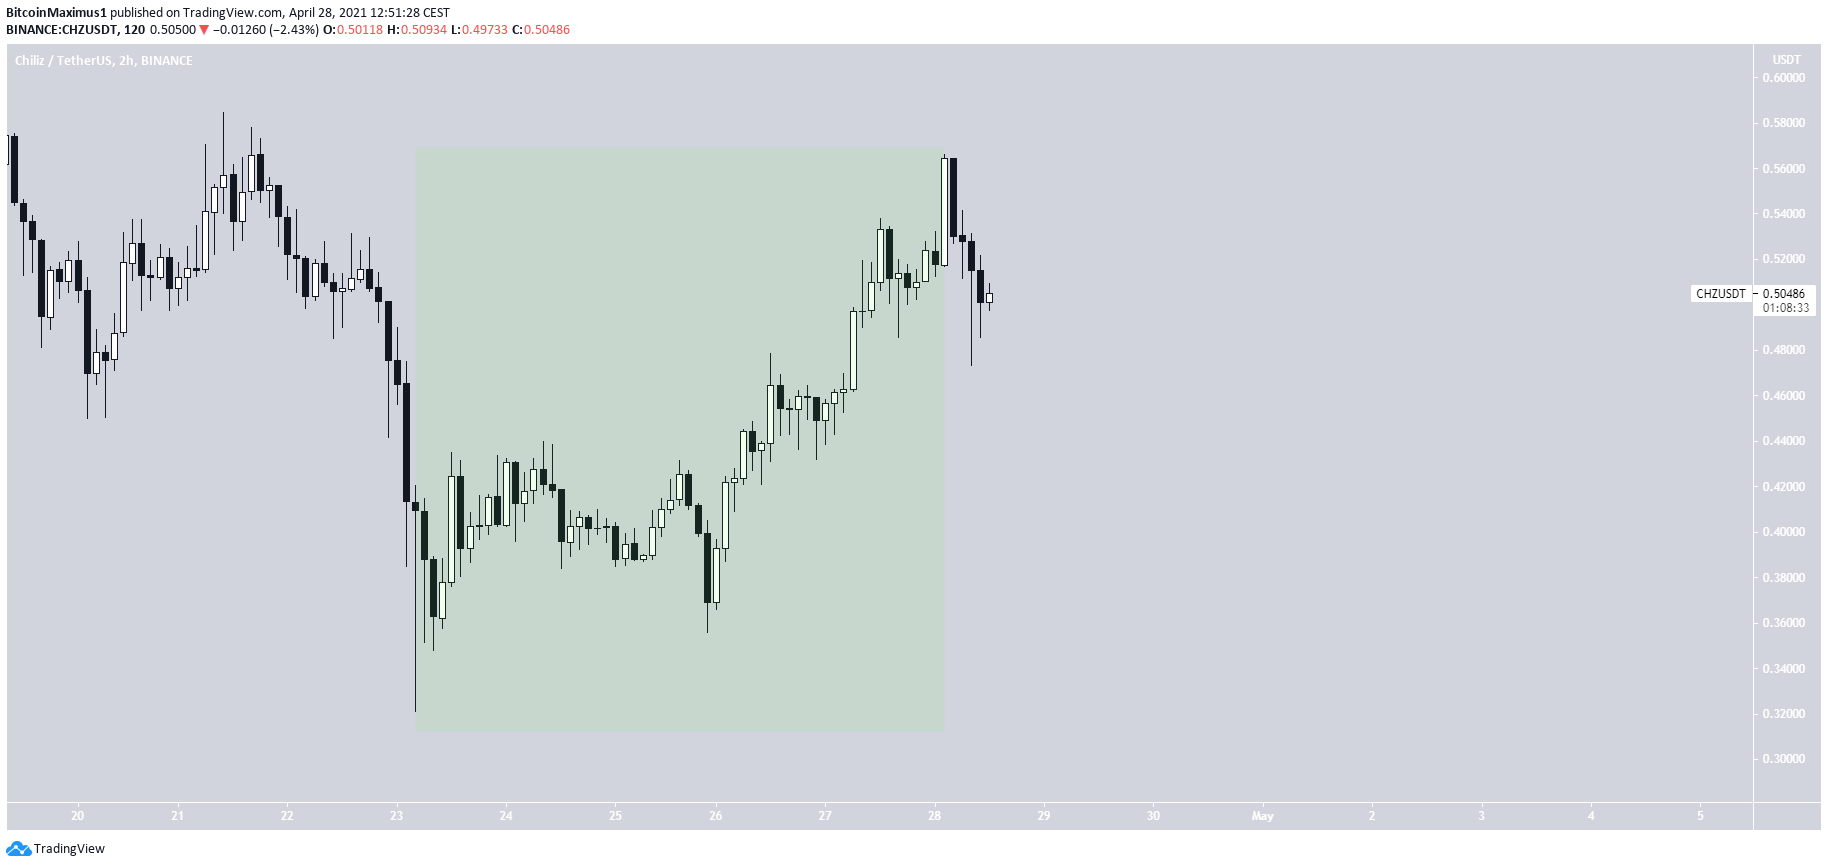
Furthermore, the movement from the lows does seem like the beginning of a new bullish impulse. Therefore, it is likely that CHZ increases towards the resistance line of the channel and potentially breaks out.
Furthermore, CHZ was listed in two exchanges, XT and Bitpanda Pro on April 25 and April 27, respectively. It is possible that these two events aided the price increase.
Highlights
- CHZ is trading inside a descending parallel channel.
- It has potentially begun a short-term bullish impulse.
ENJ
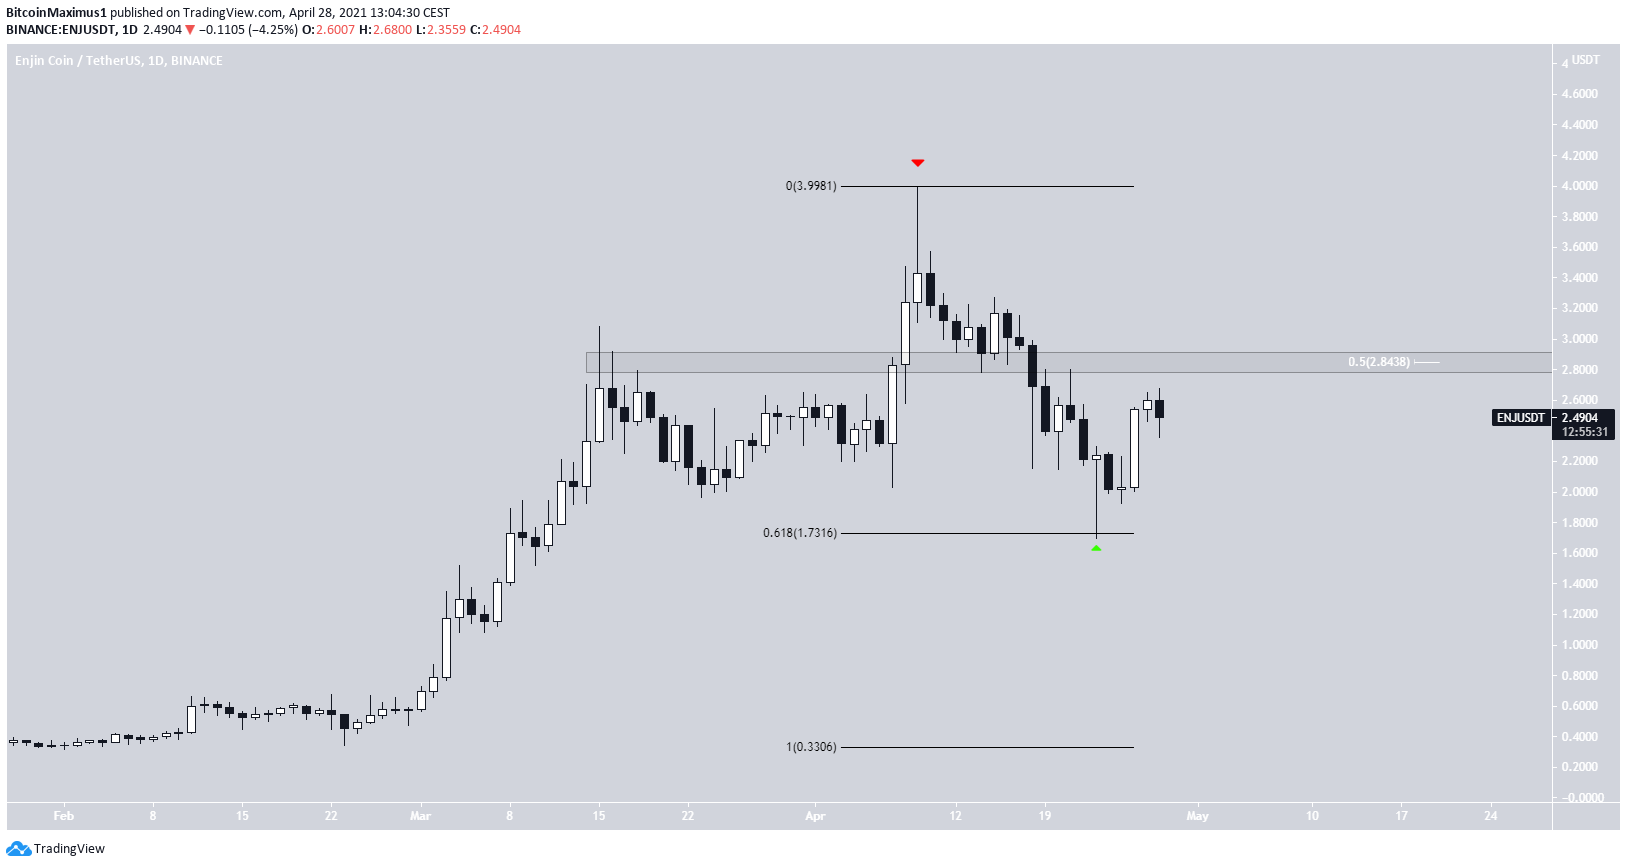
ENJ has been moving downwards since April 9, when it reached an all-time high price of $4. The ensuing drop took the token all the way down to $1.69, validating the 0.618 Fib retracement level as support.
ENJ has been moving upwards since. Despite the bounce, it has failed to reclaim a crucial resistance area, found at $2.85. This is both the 0.5 Fib retracement level (white) of the recent drop and a horizontal resistance area. Until it is successful in reclaiming it, we cannot consider the trend bullish.
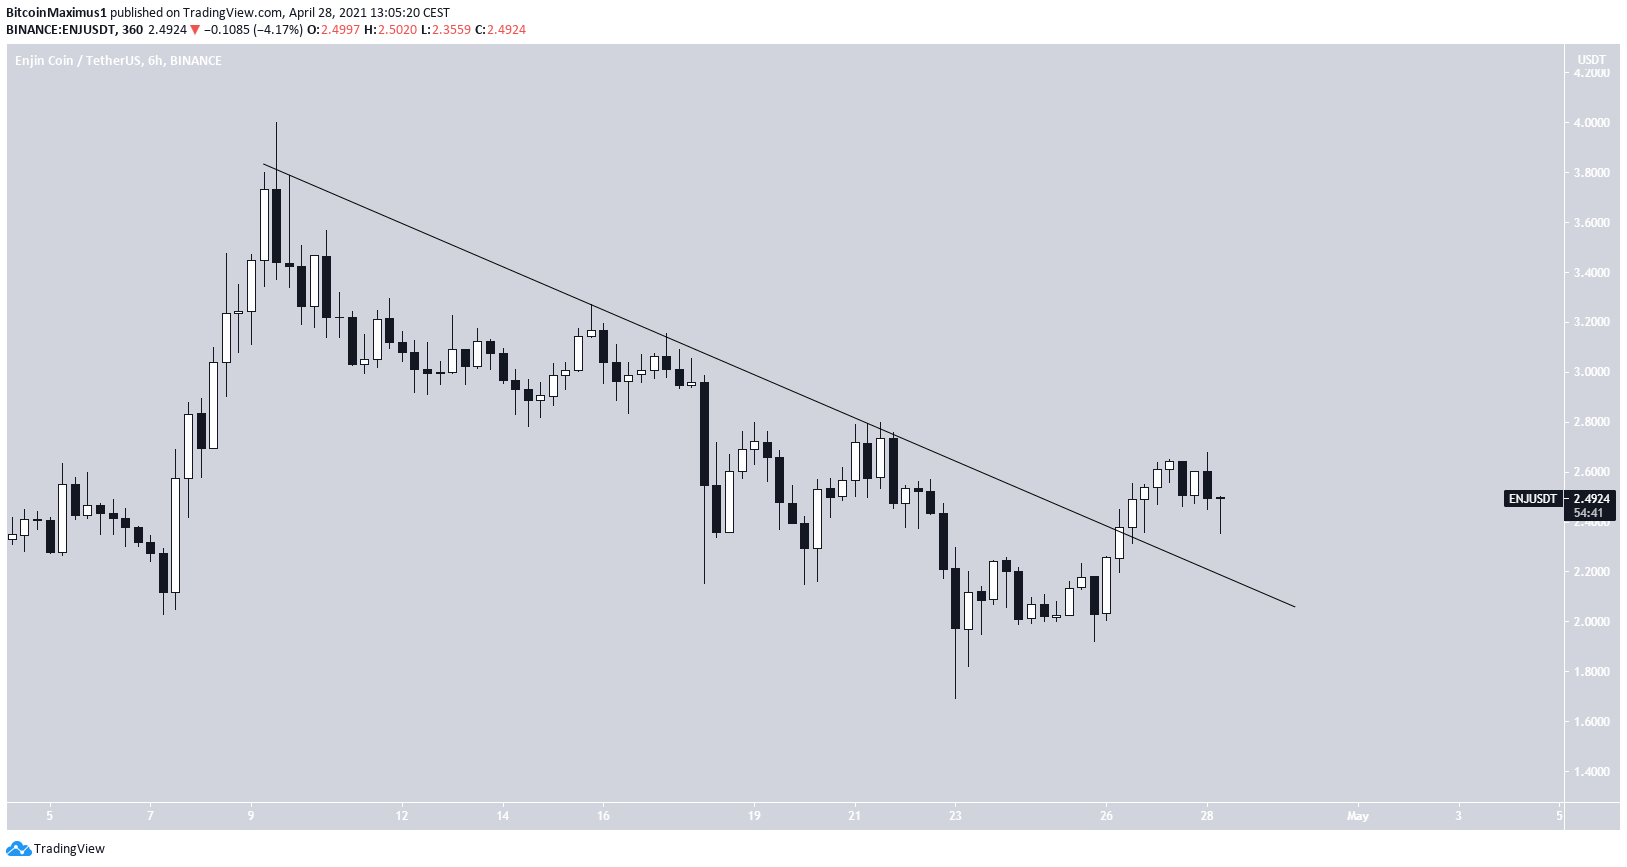
The shorter-term six-hour chart shows an ongoing breakout from a descending resistance line. Therefore, ENJ is expected to reach the previously outlined resistance area at $2.85. However, currently, we cannot determine whether it will break out.
Similarly to CHZ, ENJ was listed on the XT exchange on April 23.
Highlights
- ENJ is facing resistance at $2.85.
- It has broken out from a descending resistance line.
MANA
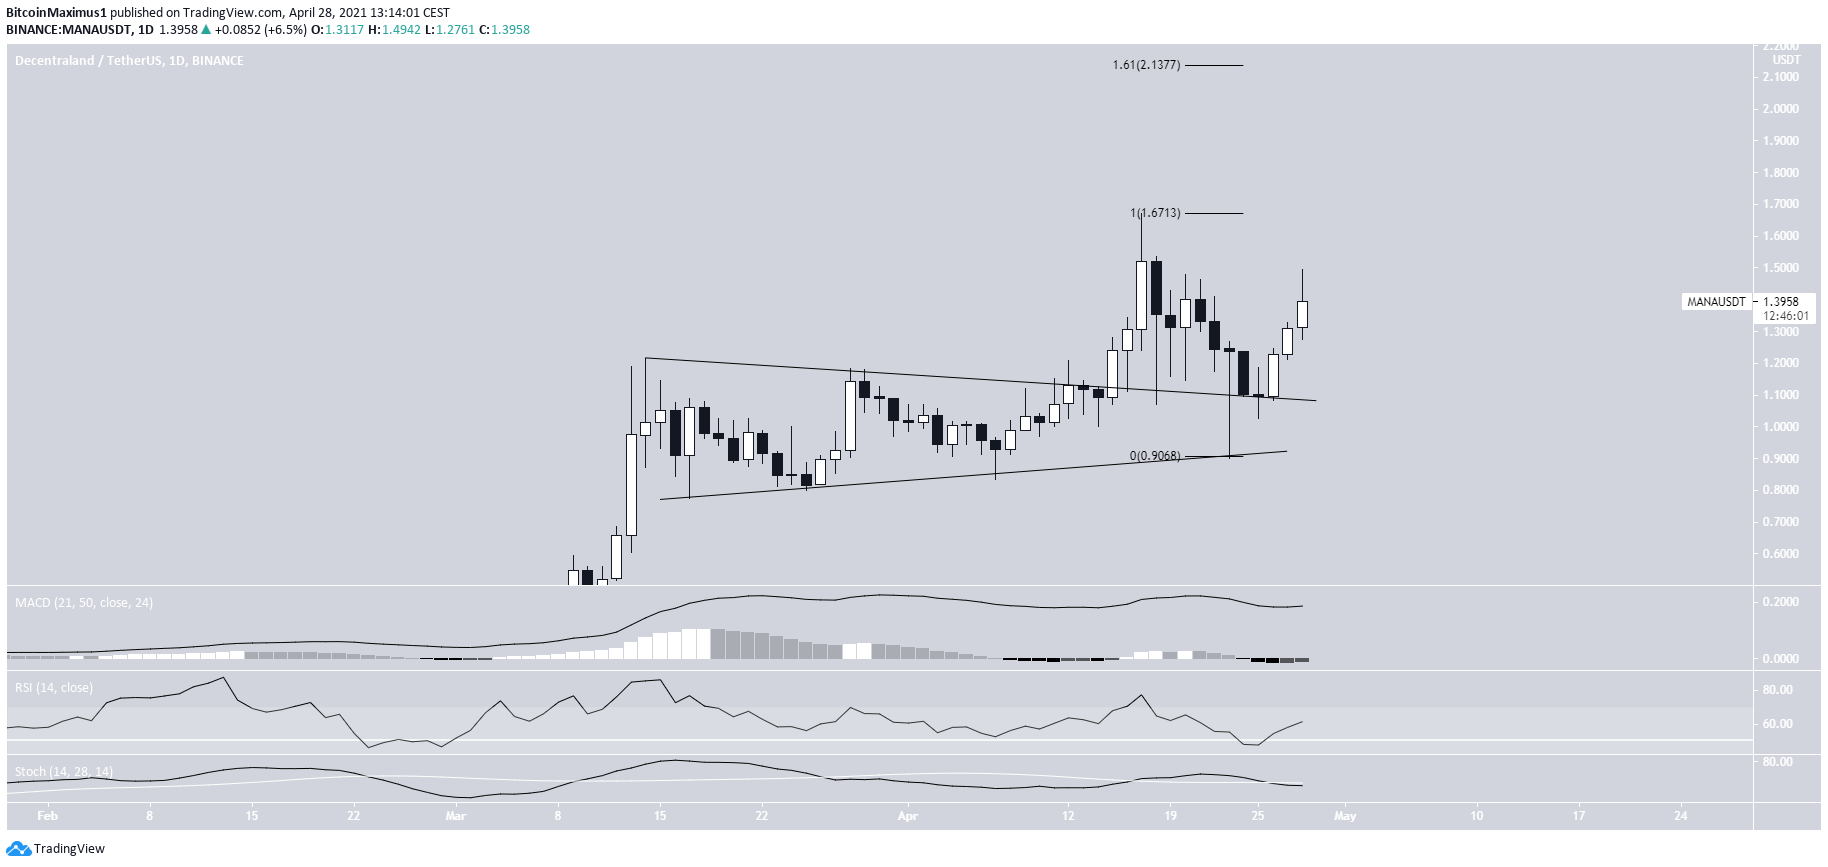
On April 15, MANA broke out from a symmetrical triangle. It proceeded to reach a new all-time high price of $1.67 two days later.
While it dropped sharply afterwards, the decrease served to validate the triangle as support.
MANA has been moving upwards since.
Technical indicators are bullish. The MACD has given a bullish reversal signal and the RSI has crossed above 50. While the Stochastic oscillator has yet to make a bullish cross, it is close to doing so.
The next resistance area is found at $2.13.
Highlights
- MANA has broken out from a symmetrical triangle.
- There is resistance at $2.13.
For BeInCrypto’s previous BTC (BTC) analysis, click here.
The post NFT Tokens Pump After Numerous Exchange Listings appeared first on BeInCrypto.


![Decentraland: Review & Beginner's Guide [current_date format=Y] 31 Decentraland: Review & Beginner's Guide](https://cryptheory.org/wp-content/uploads/2020/11/decentraland-02-gID_7-300x150.jpg)