OMG Bounces at Support, LTC & XLM Reclaim Key Levels
2 min readLitecoin (LTC) has reclaimed the long-term $220 resistance area. It is potentially in wave five of a bullish impulse.
Stellar (XLM) has completed a running flat correction and reclaimed the $0.47 resistance area.
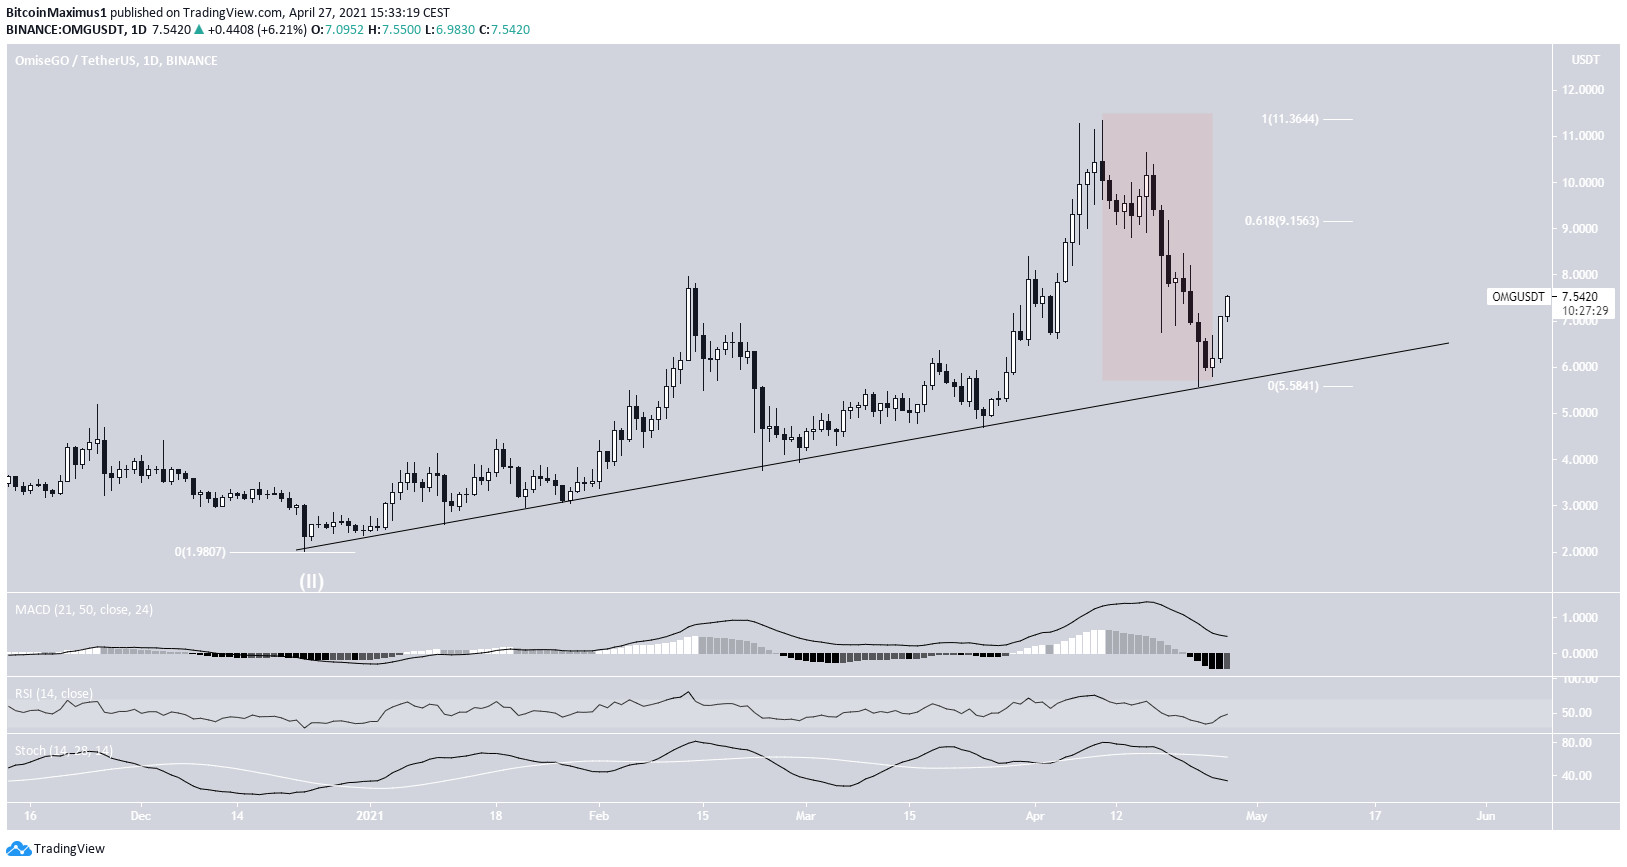
OMG Network (OMG) has bounced at an ascending support line.
Litecoin (LTC)
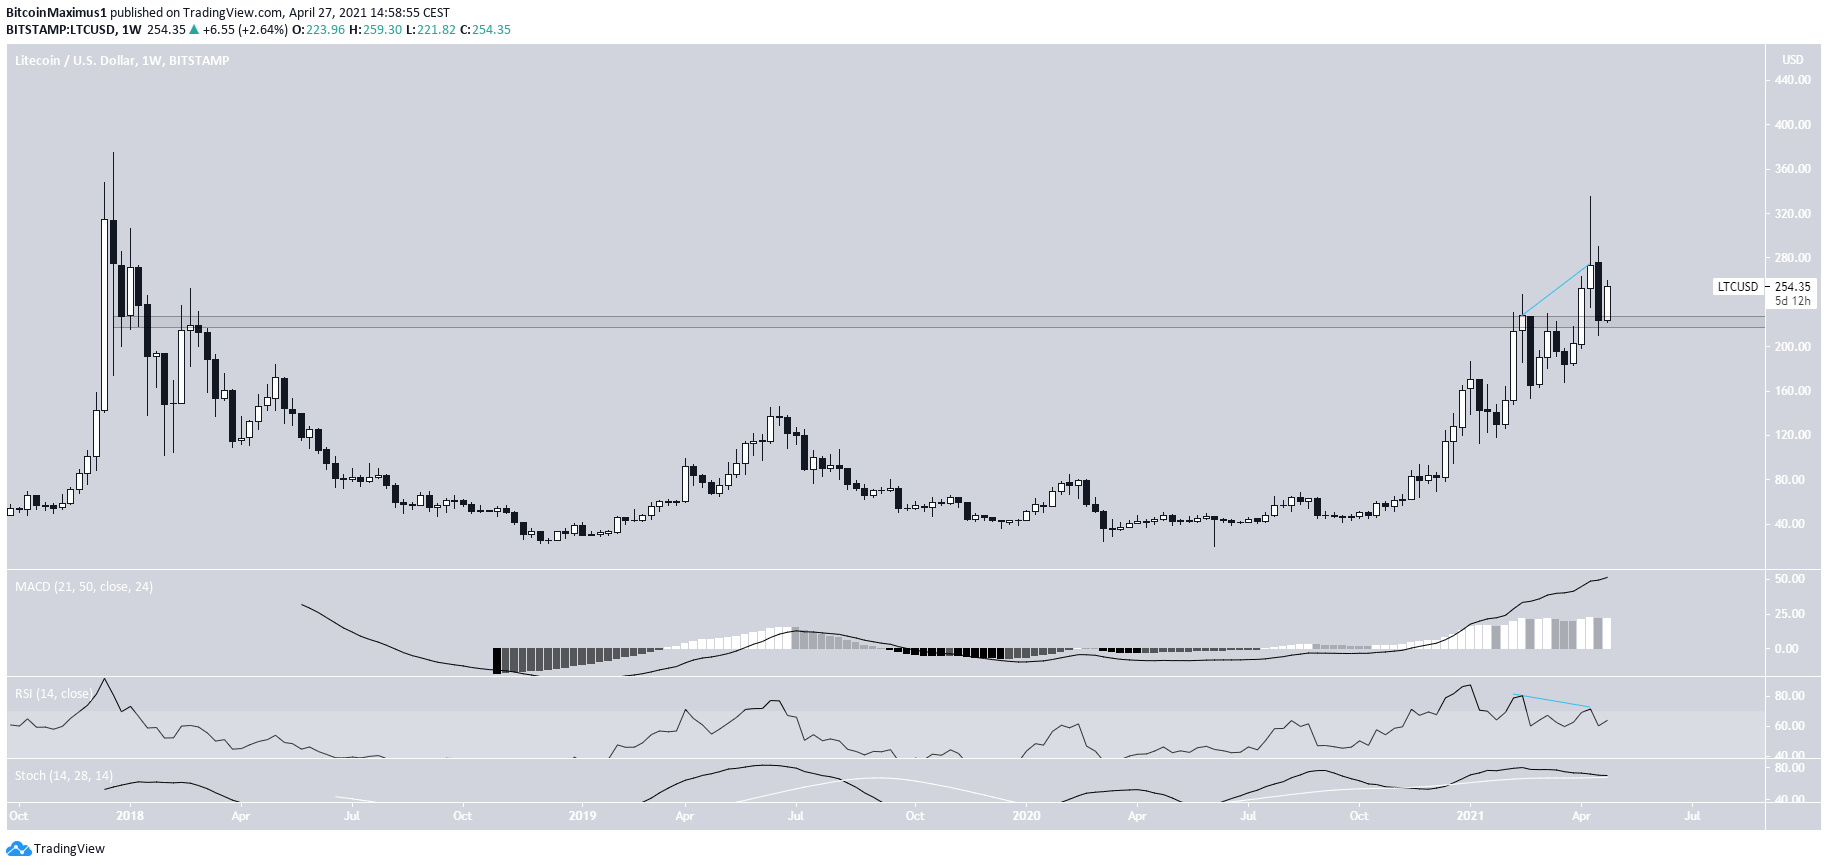
In January 2021, LTC was rejected by the long-term $220 resistance area. The token has not reached a close above this level since late 2017.
After two unsuccessful attempts, it managed to move above it, reaching a high of $335 on April 17.
However, after generating bearish divergence in the RSI, LTC decreased substantially. Nevertheless, the drop only served to validate the $220 area as support.
Both the MACD and Stochastic oscillator are still bullish.
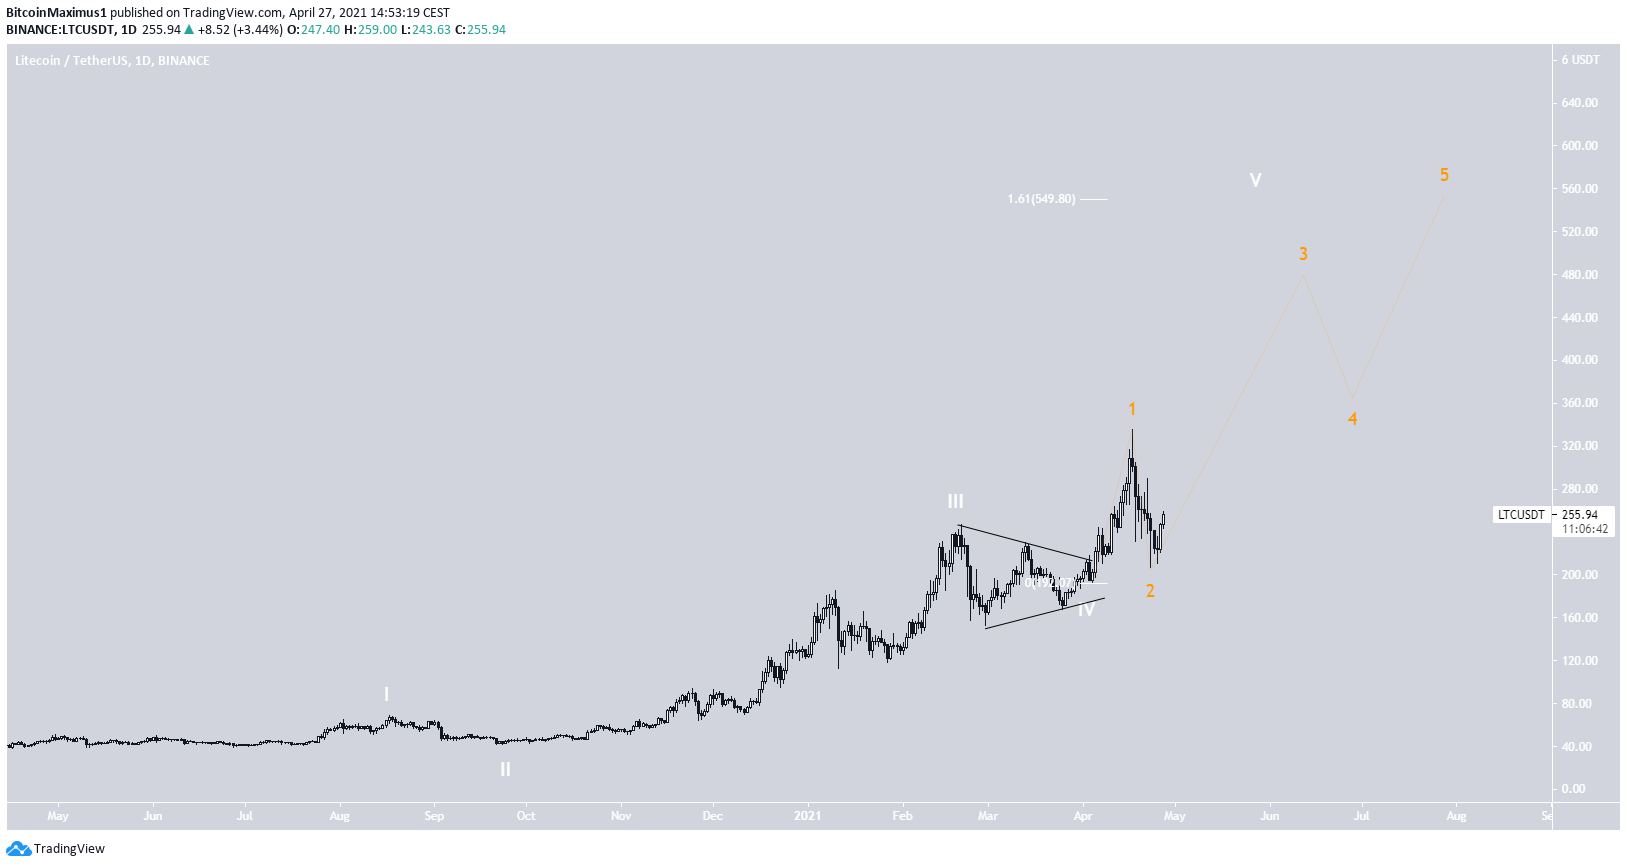
The wave count indicates that LTC completed a fourth wave triangle throughout March and April.
After breaking out, it is now in wave five (white). The sub-wave count is given in orange.
A potential target for the top of the upward movement is given at $550, found by using the 1.61 Fib projection of waves 1-3.
Highlights
- LTC has reclaimed the long-term $220 area.
- It is potentially in wave five of a bullish impulse.
Stellar (XLM)
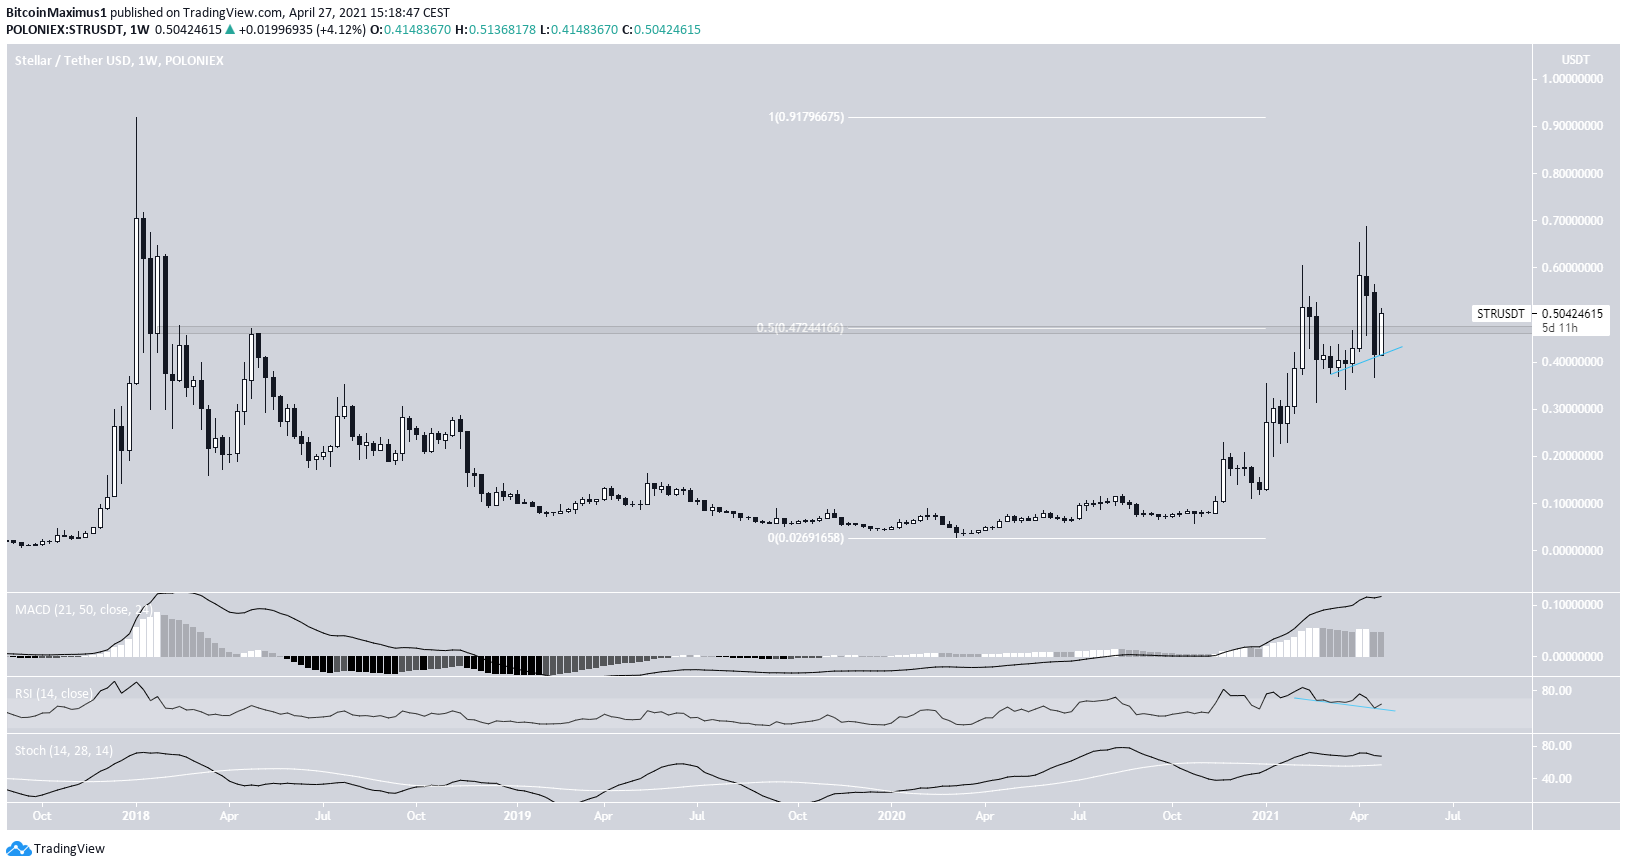
At the end of March, XLM managed to break out above the 0.5 Fib retracement resistance at $0.047. It proceeded to reach a high of $0.691 on April 14.
While the token has decreased since, it is still trading above the $0.47 area, having now seemingly validated it as support.
Technical indicators are still bullish. Both the MACD and Stochastic oscillator are increasing. While the RSI is not, it has generated hidden bullish divergence.
The next resistance area is found all the way at the all-time high price of $0.93.
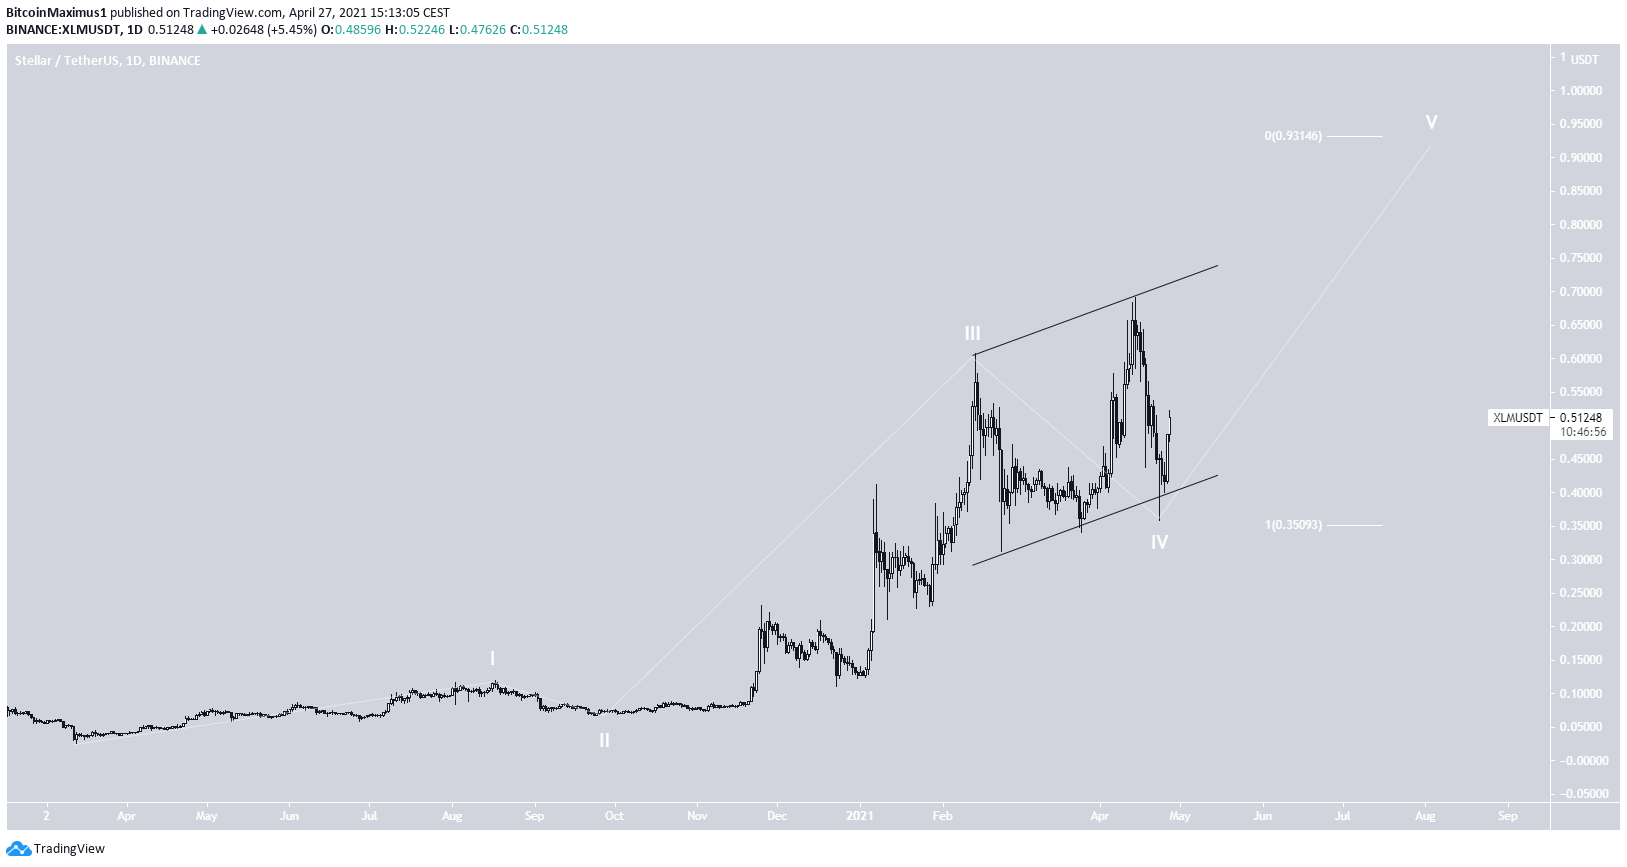
The movement measuring from the Feb. 14 high looks like a completed running flat correction.
If so, a potential target for the top of wave five is found at $0.93.
Highlights
- XLM has completed a running flat correction.
- It has reclaimed the long-term $0.47 resistance area.
OMG Network (OMG)
OMG reached a new all-time high price of $11.33 on April 10. However, it has been decreasing since. The downward movement continued until April 23, when OMG bounced at an ascending support line.
Despite the bounce, technical indicators are still bearish. Furthermore, the decrease measuring from April 10 looks impulsive.
Therefore, until OMG reclaims the $9.15 resistance area, which is the 0.618 Fib retracement level of the most recent drop, we cannot consider the trend bullish.
Highlights
- OMG reached a new all-time high price on April 10.
- It is following an ascending support line.
For BeInCrypto’s latest BTC (BTC) analysis, click here.
The post OMG Bounces at Support, LTC & XLM Reclaim Key Levels appeared first on BeInCrypto.


![Decentraland: Review & Beginner's Guide [current_date format=Y] 31 Decentraland: Review & Beginner's Guide](https://cryptheory.org/wp-content/uploads/2020/11/decentraland-02-gID_7-300x150.jpg)