Technical analysis of BTC – a significant turnaround signal appeared
2 min readBTC didn’t really surprise at the last minute, which means for us that the weekly candle definitely closed as a Shooting star. It’s not a good signal because it’s one of the most bearish forms ever. However, a candle needs confirmation, which can be waited for a long time.
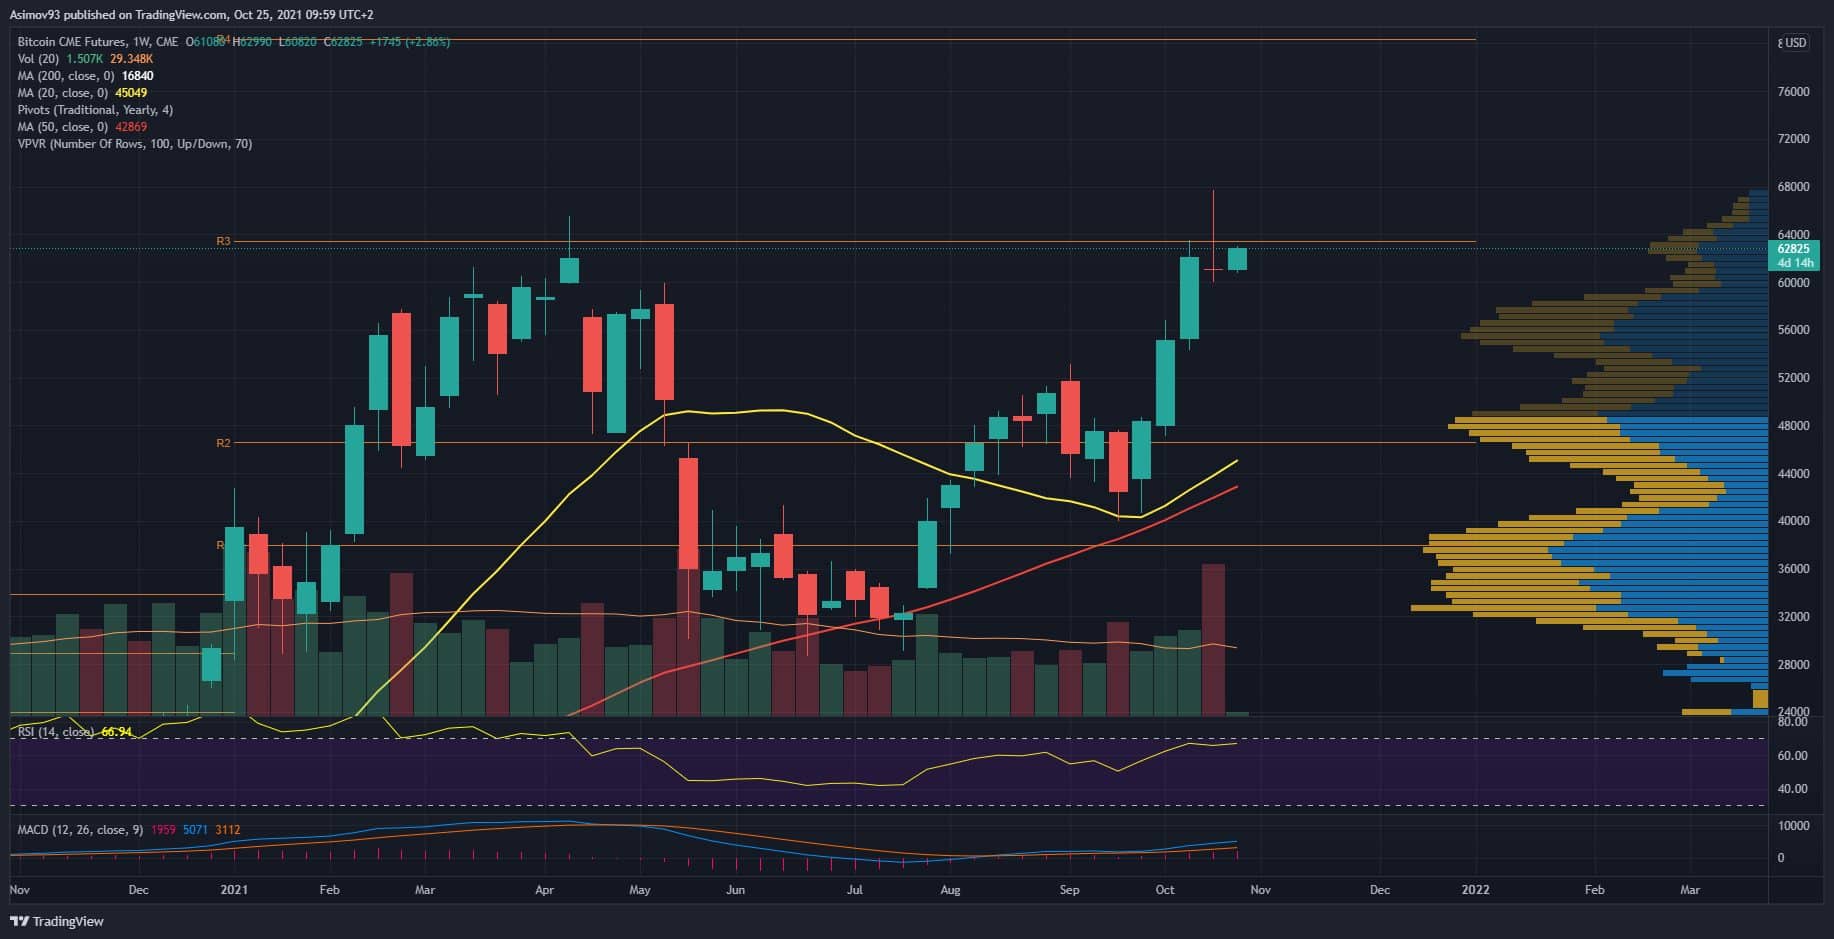
BTC CME futures
The trading week on CME futures ended on Friday. The weekly candle in this market closed like Doji. And those volumes are really huge. It was therefore much more likely that the spot market would close similarly. We need to get used to the fact that the regulated market is gaining more and more weight. By that I mean that we can’t expect much significant movements during the weekend trading on the spot market.
So when a regulated market closes in some form, it probably closes the rest of the market. Otherwise, it is really interesting how huge volumes were traded last week. The implication is simple, it sold near all time high so much that the demand was completely absorbed. Quite a bad signal for BTC.
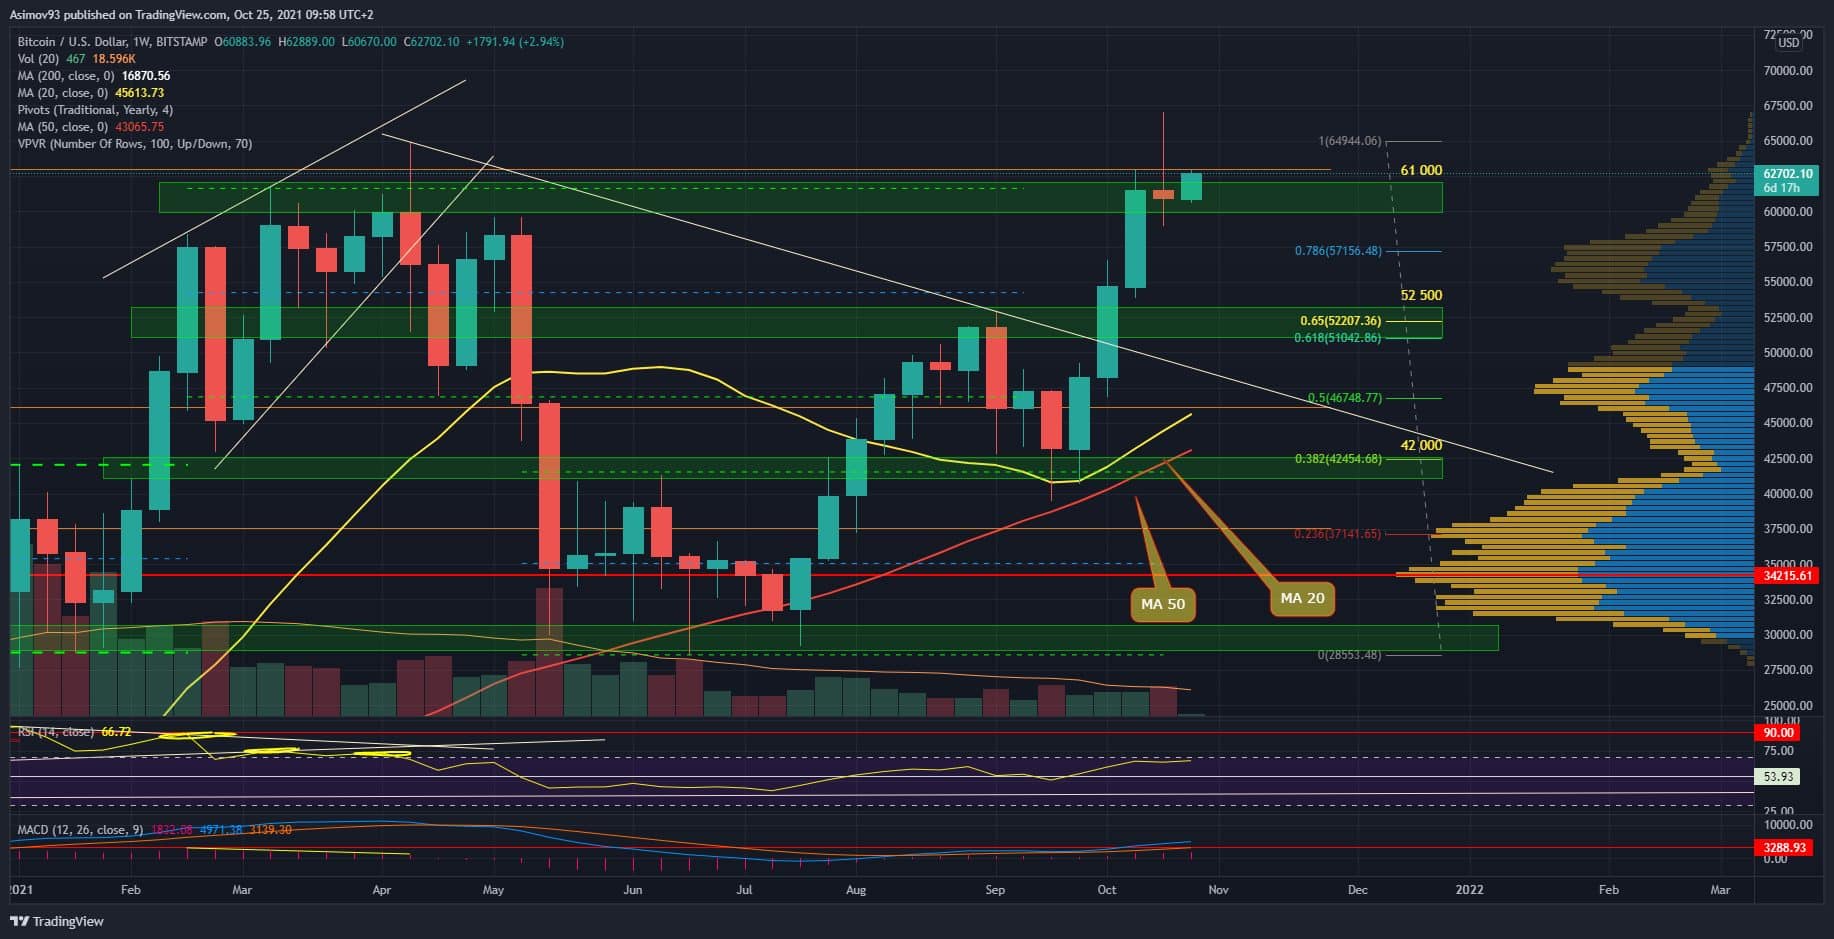
Current situation at 1W BTC / USD
As for the spot market, there was a throwback to $ 61,000, where there was an effort to defend. However, during the weekend it did not have much power. Basically, it was such a small tug-of-war between sellers and buyers. But it was almost certain that the shape of the weekly candle would remain in a negative form.
In my opinion, BTC is more in the spot market Shooting star. There was a slight increase in the last two hours of the trading week, so it was almost a Doji. But it doesn’t matter, the final form is clearly bearish. Rejection at the all time high level alone does not look good at all.
This does not automatically mean that BTC cannot go for that $ 70,000. But the probability was significantly reduced. Therefore, be more careful and have a plan for a possible escape. Among other things, it is technically correct for a bear candle to be confirmed with a lower close for one of the following weekly candles. But it may also happen that the confirmation takes place at a time when the price is much deeper. It’s just not that simple.
Indicators
The values of the weekly RSI are about 67 points. Keep in mind that testing the 70-point mark is always an important event for the market. The market reaction is therefore quite important. Everything is ok with MACD.


