Tellor (TRB) Breaks Out and Aims for $32
2 min readTable of Contents
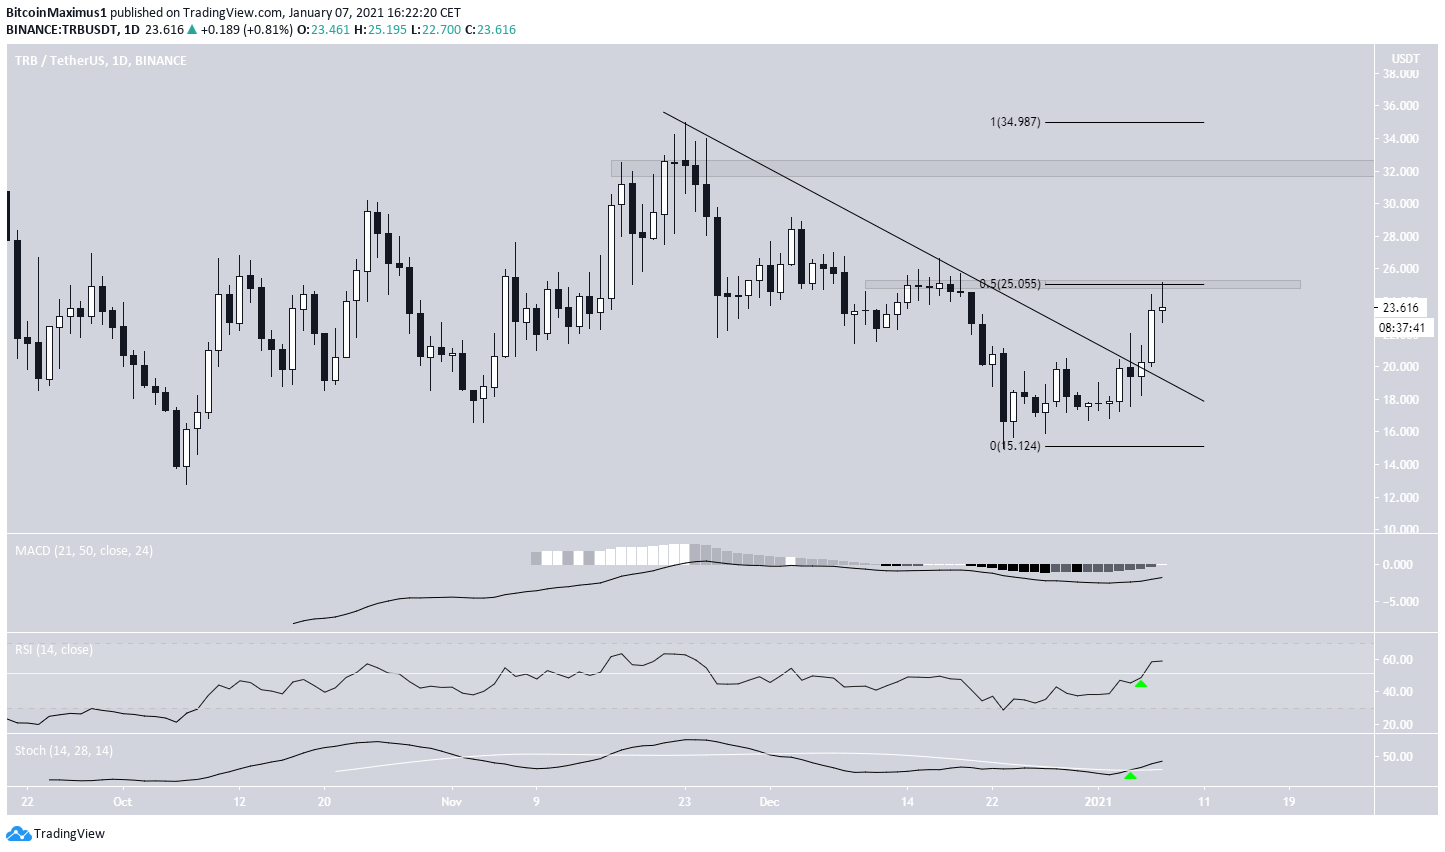
The Tellor (TRB) price has broken out from a descending resistance line and is currently attempting to move above the $25 resistance area.
As long as the current bullish structure remains intact, TRB should move above this resistance area and target $32.
TRB Attempts a Reclaim of the $25 Area
On Jan. 5, TRB broke out from a descending resistance line it had been following since reaching a high of $23.99 on Nov. 23.
While it has increased substantially since, it was rejected and is trading below the $25 resistance area, the 0.5 Fib retracement level of the most recent decline.
If it breaks up successfully, the next resistance area would be at $32.
Technical indicators on the daily time-frame are bullish, increasing the likelihood that it will reclaim this area and continue moving higher.

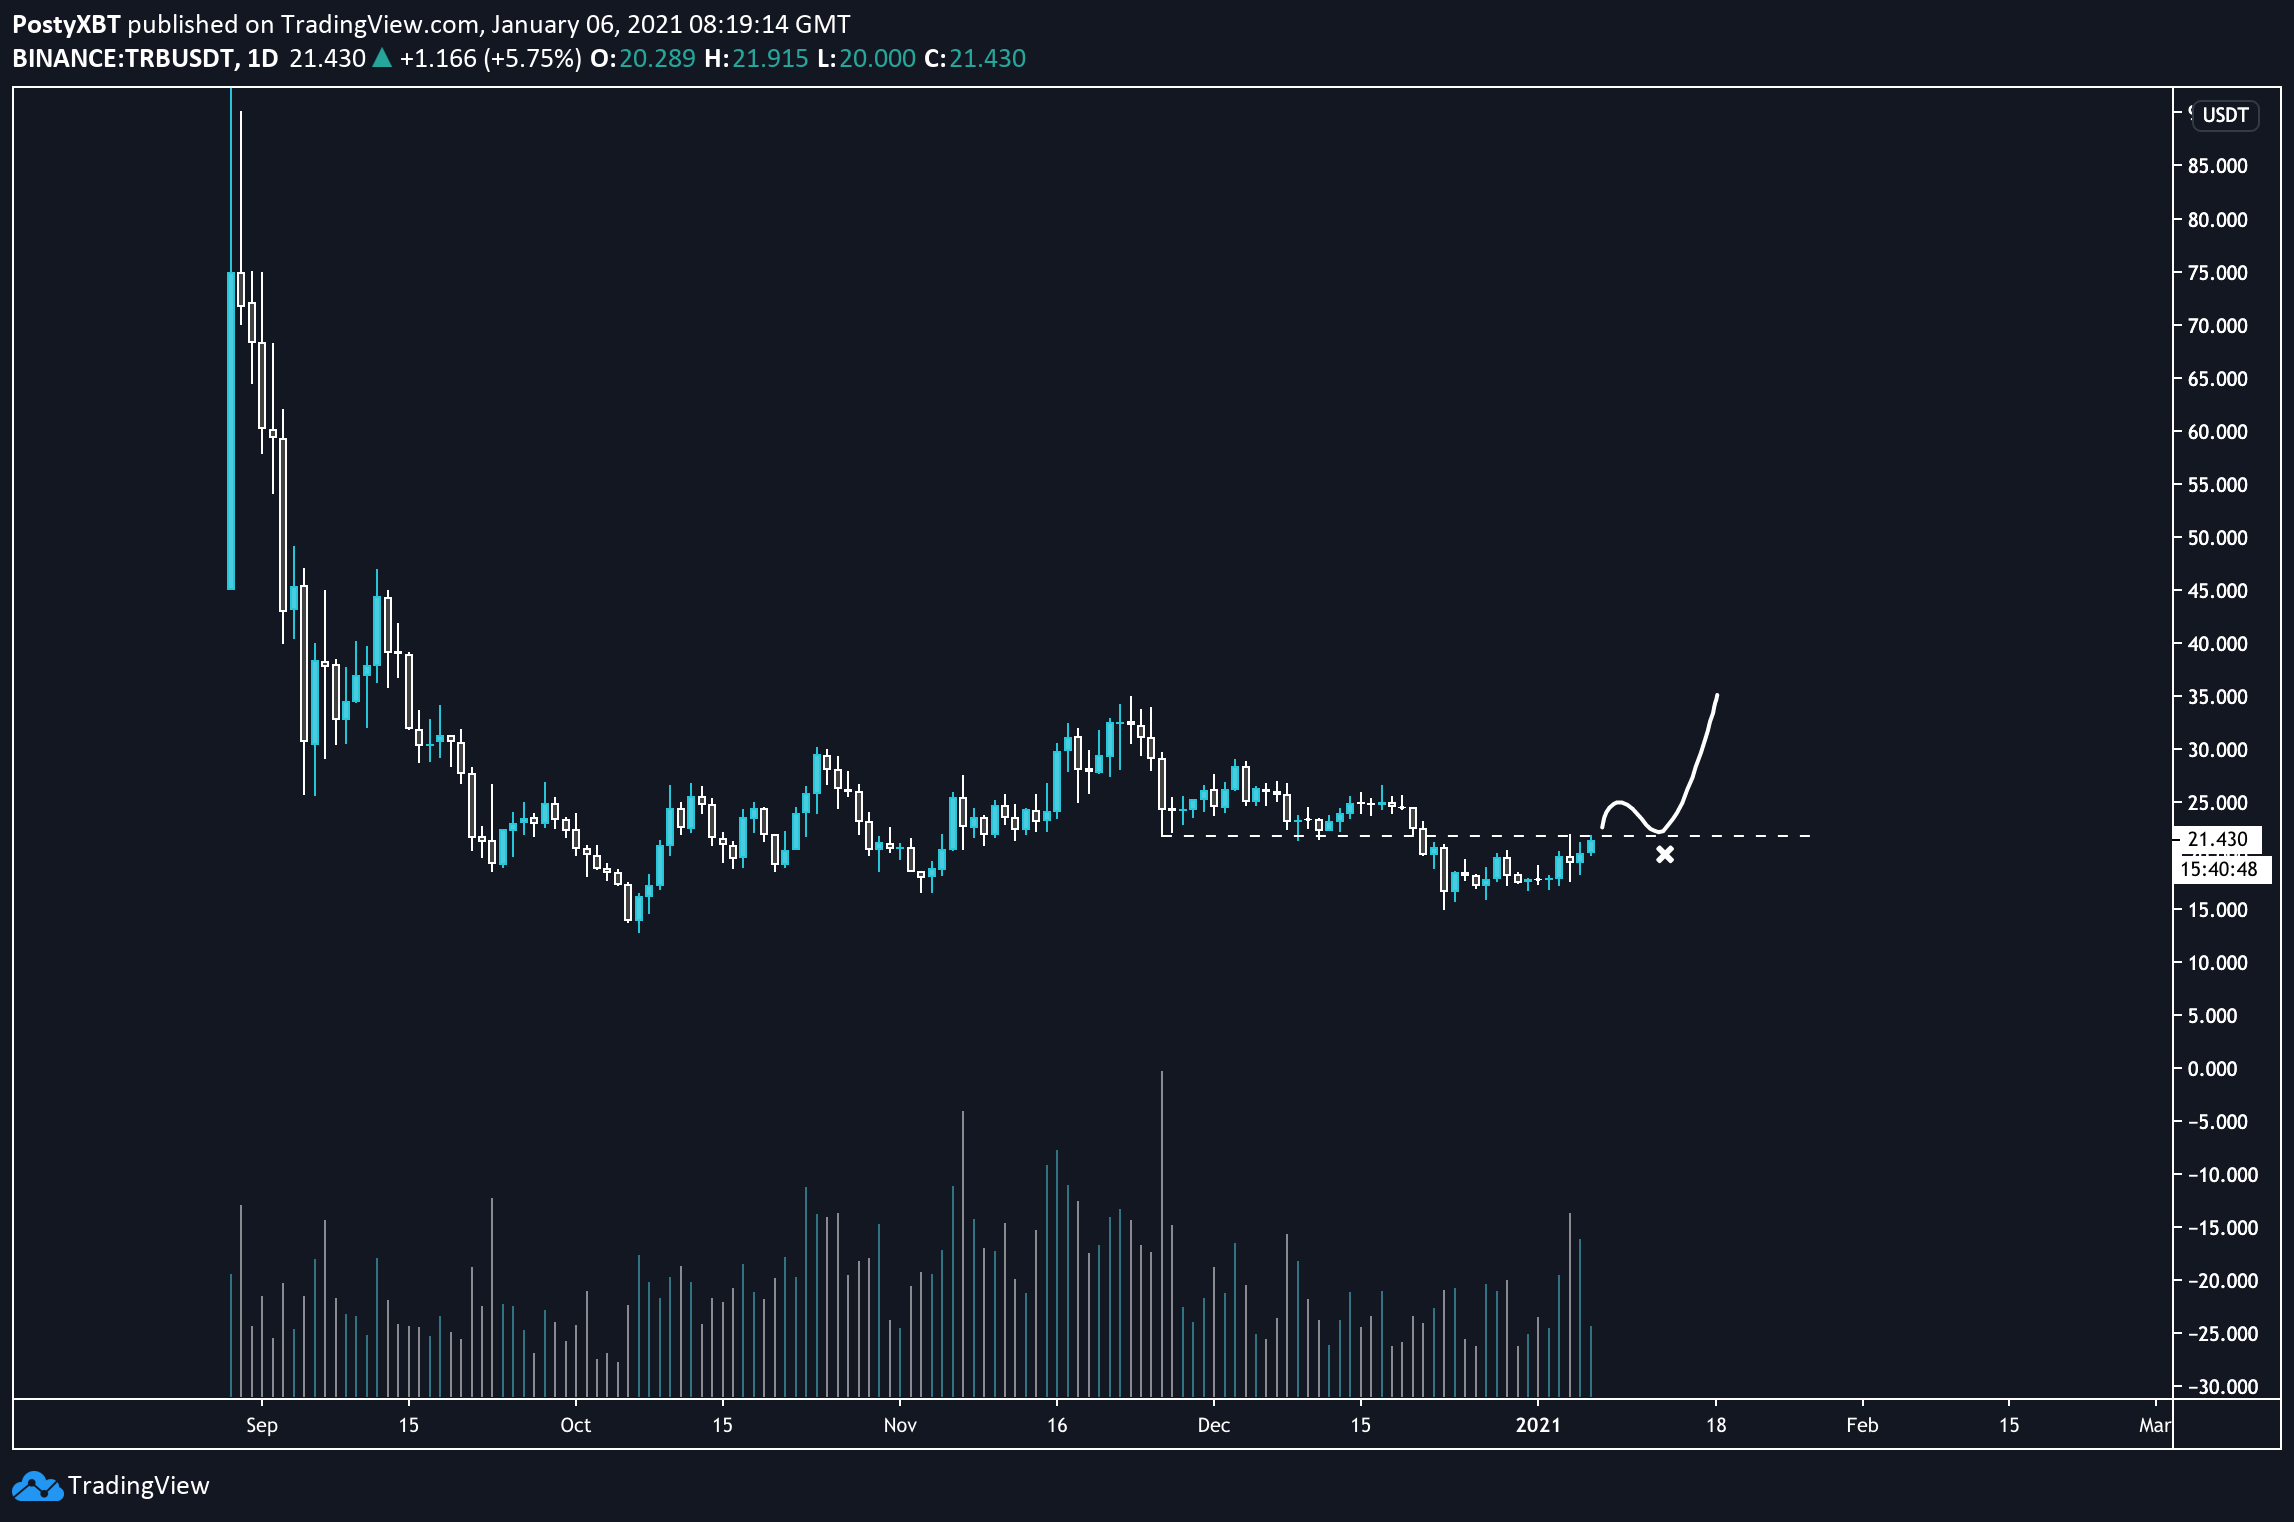
Cryptocurrency trader @PostyXBT outlined a TRB chart, stating that a flip of the $21 area could lead to a significant increase.
While it has already flipped this level, it has to reclaim the $25 area before it can rally at an accelerated rate.

Possible Continuation?
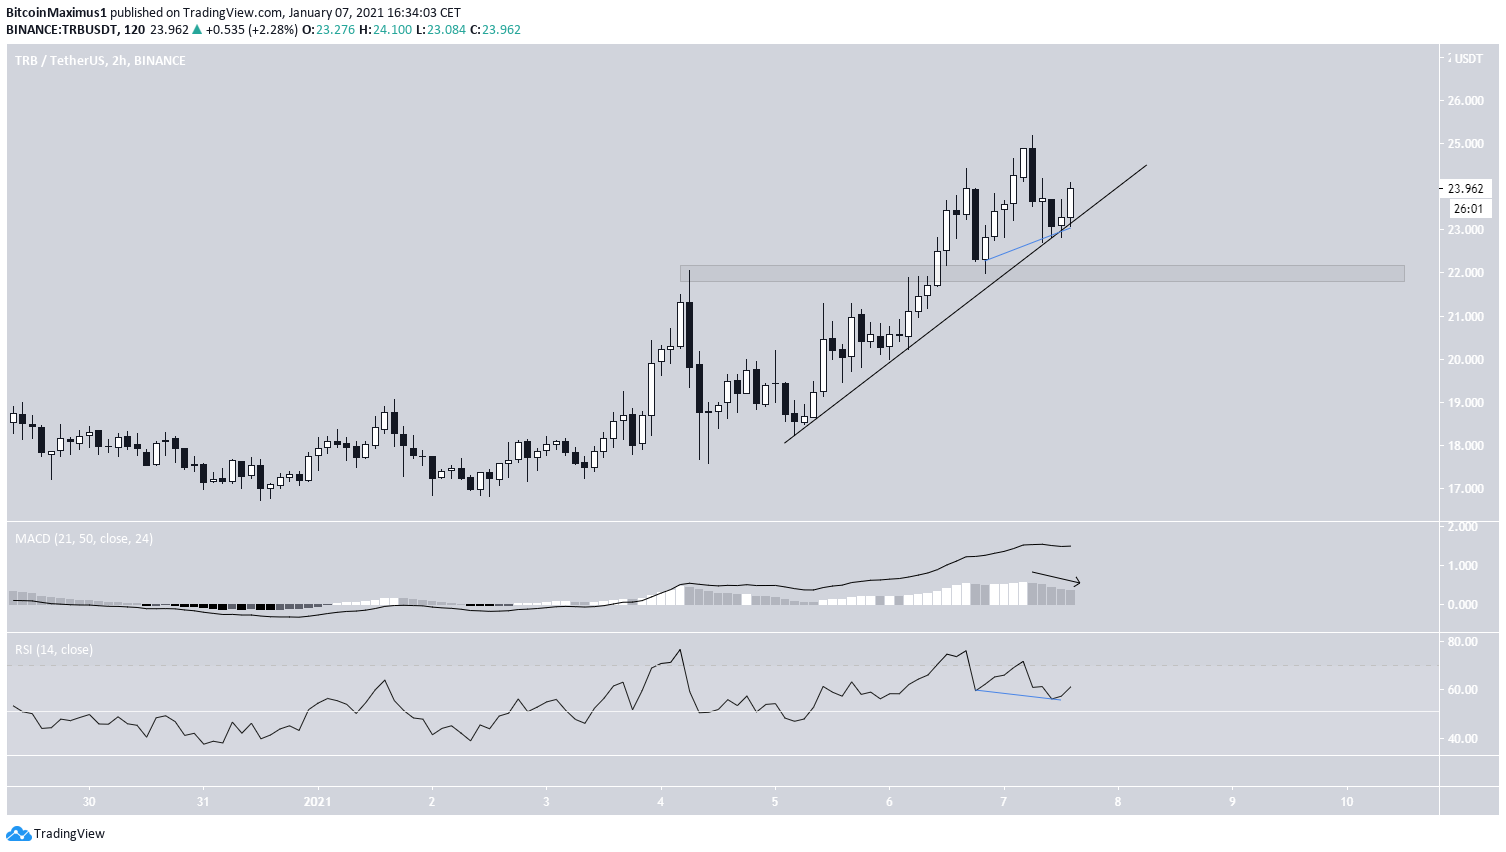
The shorter-term two-hour chart provides a support area around $22. We can also see that TRB is following a very steep ascending support line that has been validated three times so far.
Technical indicators are leaning bullish. Despite the loss of strength in the MACD, the RSI has formed hidden bullish divergence, a strong sign of trend continuation.
Even if TRB were to break down, the price move would likely be bullish as long as it’s trading above the $22 area.

TRB/BTC
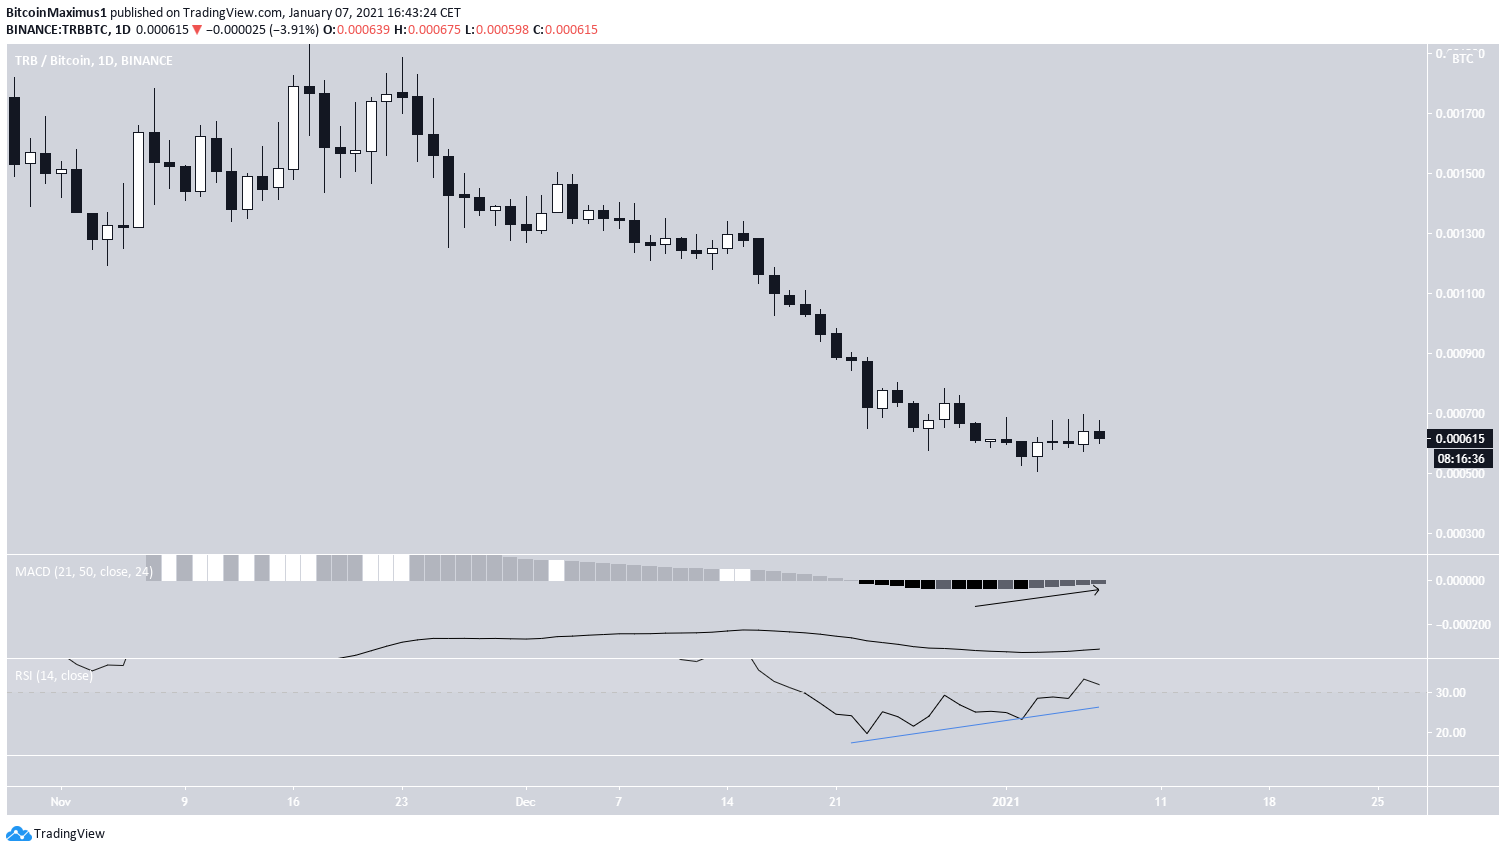
On Jan. 3, TRB reached an all-time low price of 5,040 satoshis. Since then, it has moved slightly upwards but failed to initiate a significant rally.
While the daily RSI has formed considerable bullish divergence and the MACD is increasing, we cannot confidently predict a reversal until it creates a higher low and preferably some sort of ascending support line.

Conclusion
To conclude, TRB should reclaim the $25 resistance area and gradually increase towards $32. A breakdown from the current ascending support line and the loss of the $22 support area would invalidate this possibility.
For BeInCrypto’s latest Bitcoin (BTC) analysis, click here!
Disclaimer: Cryptocurrency trading carries a high level of risk and may not be suitable for all investors. The views expressed in this article do not reflect those of BeInCrypto.
The post Tellor (TRB) Breaks Out and Aims for $32 appeared first on BeInCrypto.


![Decentraland: Review & Beginner's Guide [current_date format=Y] 28 Decentraland: Review & Beginner's Guide](https://cryptheory.org/wp-content/uploads/2020/11/decentraland-02-gID_7-300x150.jpg)