Tezos (XTZ) Struggles to Regain Footing After Sharp Drop
2 min readTable of Contents
The Tezos (XTZ) price has been decreasing since it was rejected by an important Fib resistance level. While short-term increases could occur, it seems that the long-term trend is bearish.
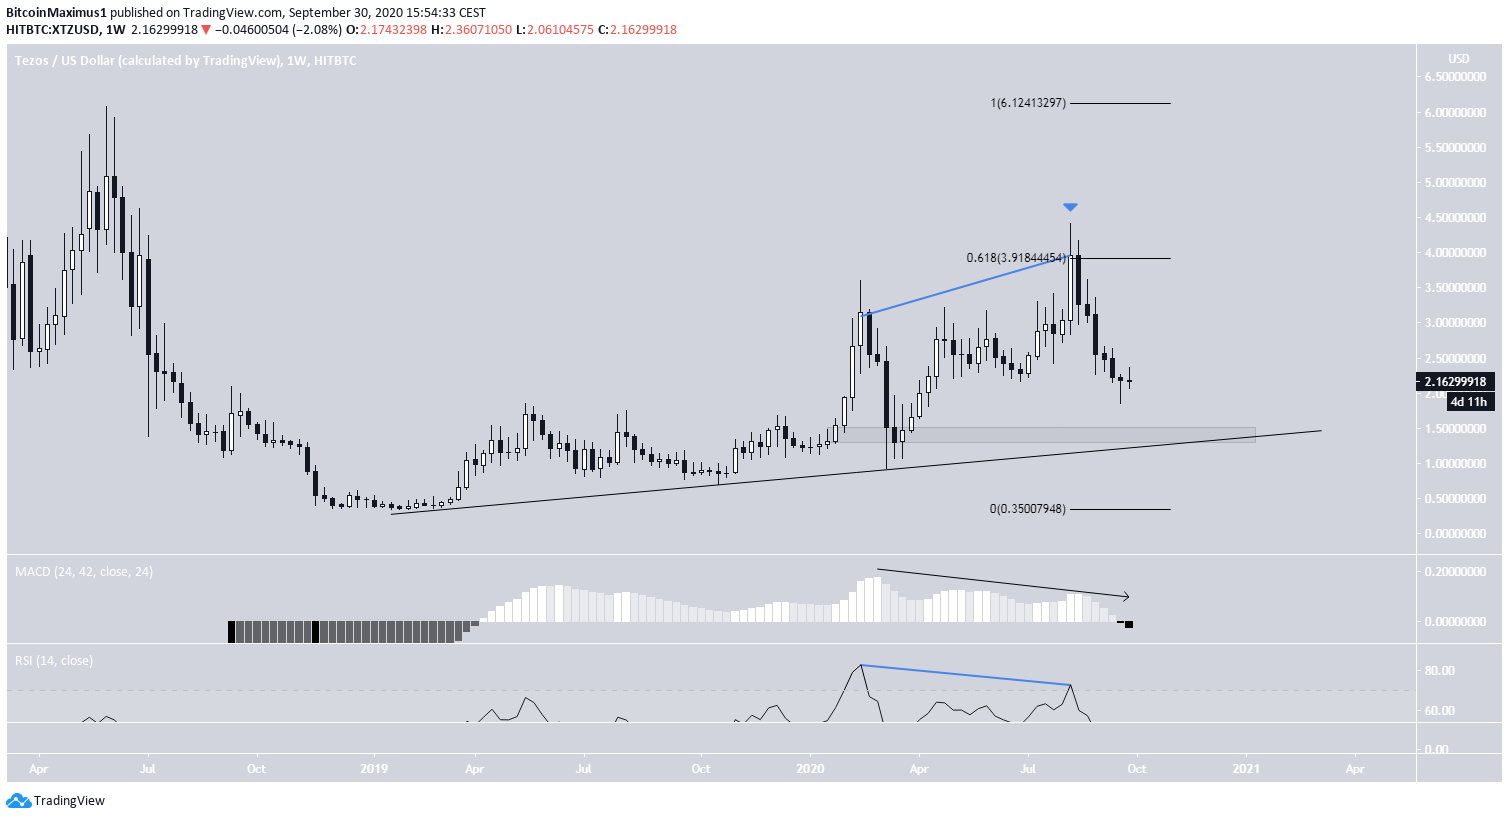
The XTZ price reached a high of $4.49 on Aug. 13 and has been decreasing since. The top was reached at the 0.618 Fib level of the entire previous downward move, which caused a strong rejection.
Tezos Long-Term Weakness
The high was combined with a bearish divergence in both the RSI and the MACD, the latter of which has already turned negative.
This indicates that a decrease towards the $1.50 area to validate the long-term ascending support line is the most likely scenario.

Breakdown From Support
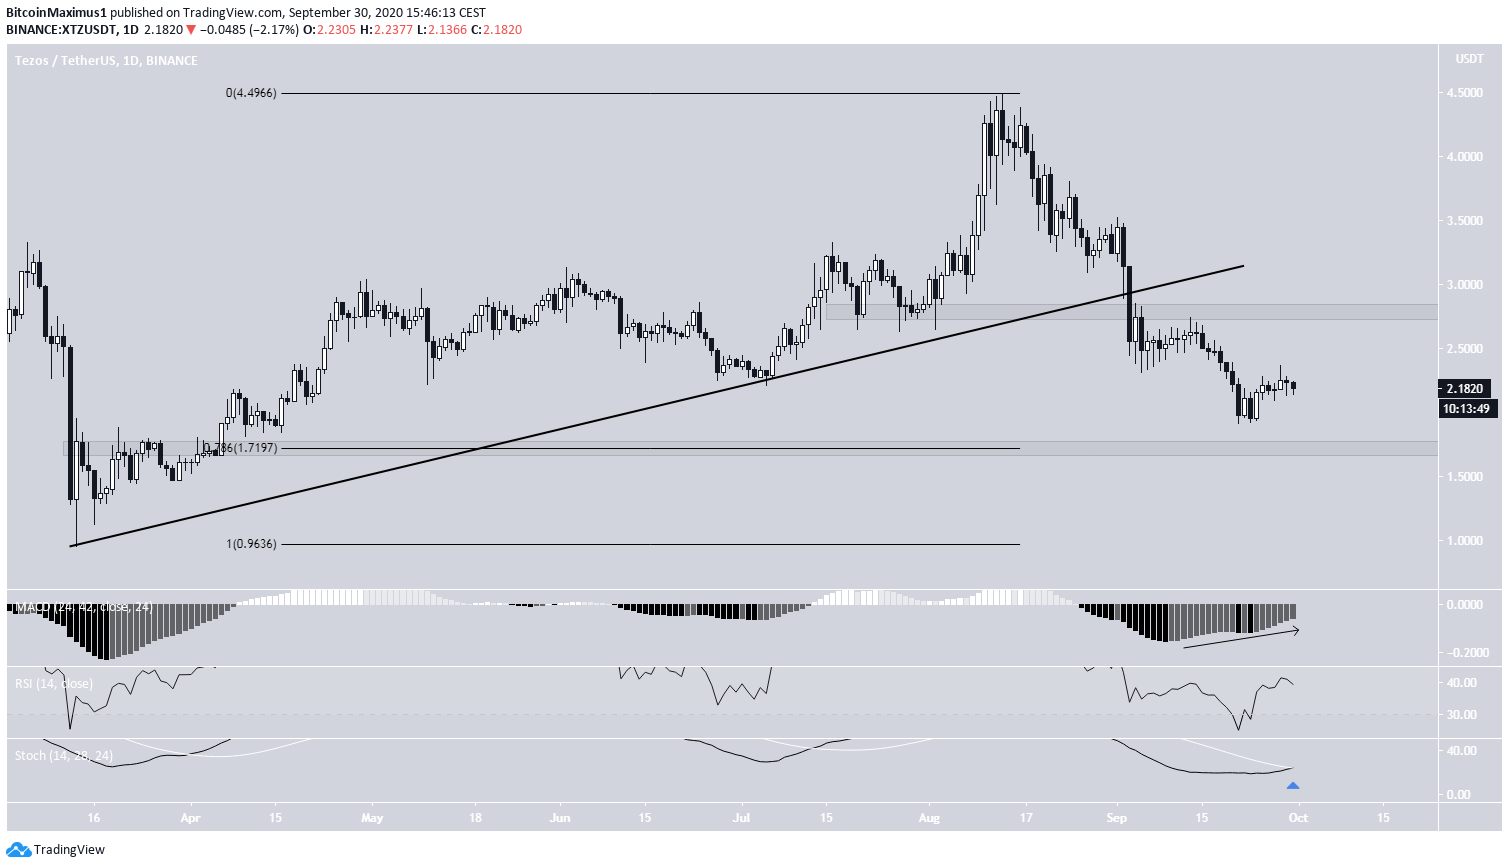
On Sept 4, the price broke down from the $2.80 support area and ascending support line that had been in place since March.
XTZ has continued its descent at an accelerated rate since.
The main support area is found at $1.70, which is the 0.786 Fib level of the entire upward move and a previous resistance area. This resistance is now likely to act as support once it’s tested.
Technical indicators are bullish:
- The MACD has generated bullish divergence and is increasing
- The RSI has moved outside of its oversold territory
- The Stochastic Oscillator is in the process of making a bullish cross
These are signs that after a possible drop towards the $1.70 support, the price is likely to test the $2.80 resistance once more. The long-term trend still remains bearish.

Wave Count
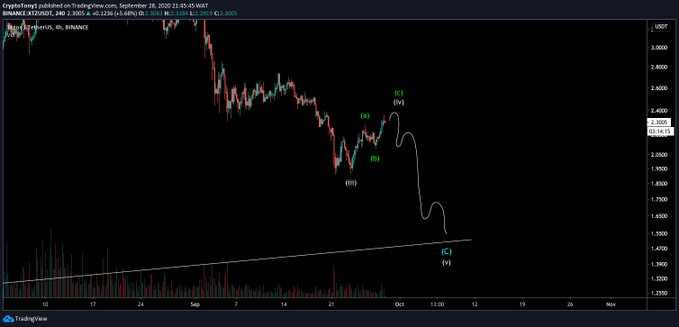
Cryptocurrency trader @Cryptotoni_ outlined an XTZ chart, stating that the price has reached a top and is expected to soon resume its downward movement.

Since the aforementioned Aug 13 high, it seems that XTZ has begun a bearish impulse (in black below), with an extended third wave (blue).
If the count is correct, then XTZ is likely in wave 4 currently, which would be expected to end between $2.71-$2.96, the 0.382-0.5 Fib level of wave 2.
Afterward, the price is expected to complete the final leg down, taking it towards $1.50-$1.70. This zone is a confluence of the long-term ascending support line outlined in the first section and the support area from the second section.

XTZ/BTC
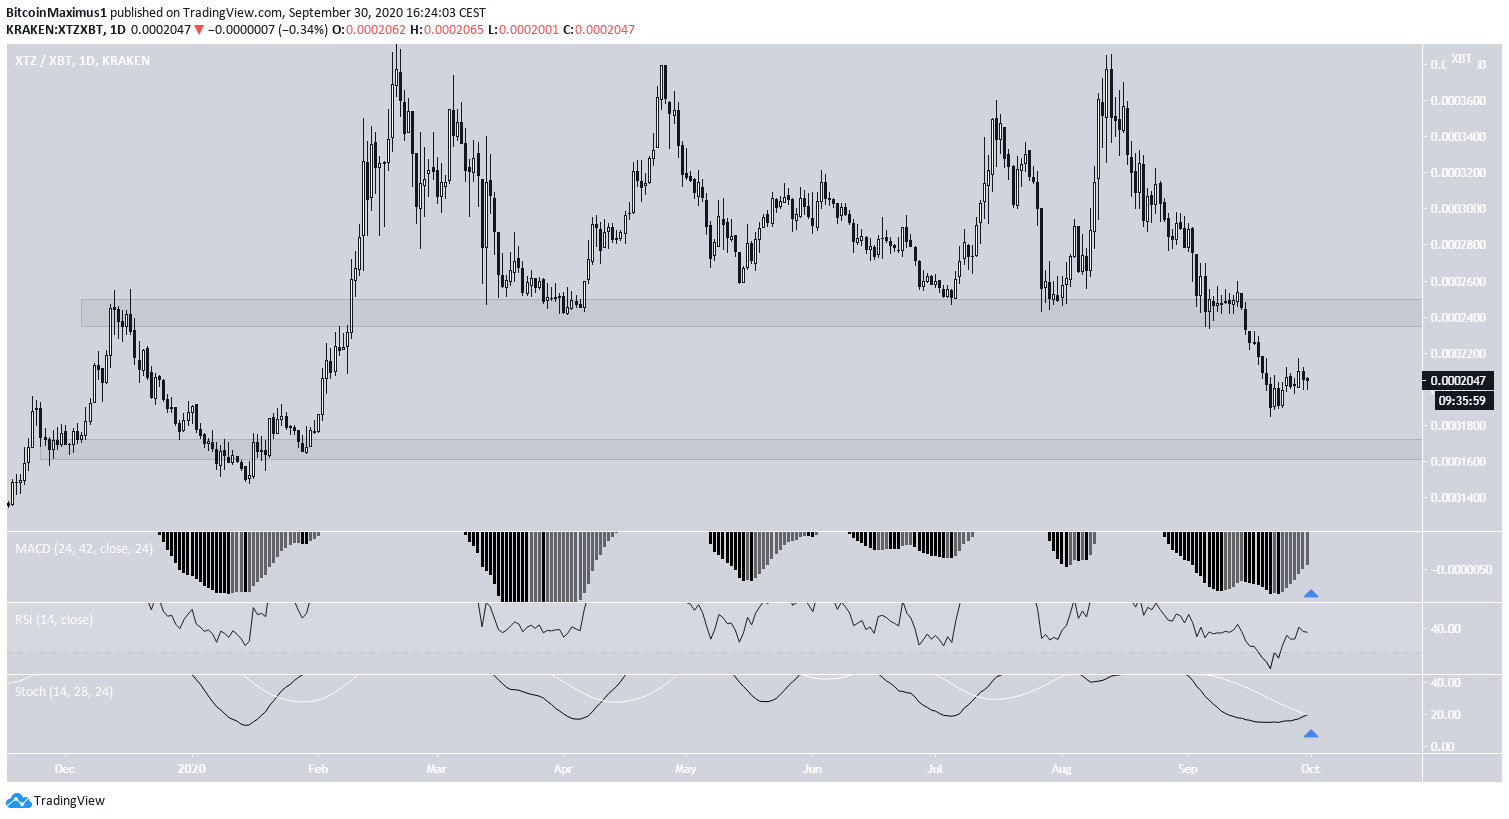
The XTZ/BTC chart has more ambiguity. The price is trading between support and resistance at 16,500 and 24,000 satoshis, respectively, and is currently being in the middle of the range.
Technical indicators are undecided:
- The MACD is increasing but has not reached positive territory yet
- The RSI is increasing but is below 50
- The Stoch RSI is in the process of making a bullish cross but has not confirmed it yet
Therefore, the most likely scenario would be a consolidation period between these two levels.

For BeInCrypto’s Previous XTZ analysis, click here!
The post Tezos (XTZ) Struggles to Regain Footing After Sharp Drop appeared first on BeInCrypto.


![Decentraland: Review & Beginner's Guide [current_date format=Y] 32 Decentraland: Review & Beginner's Guide](https://cryptheory.org/wp-content/uploads/2020/11/decentraland-02-gID_7-300x150.jpg)