Two Lesser-Known Altcoins With Significant Potential For Increases
2 min readThe ChartEx (CHART) price has made an attempt to move above a recently lost support area but was unsuccessful in doing so.
The Hedera Hashgraph (HBAR) price is trading right at a major support level and could soon begin an upward move.
ChartEx (CHART)
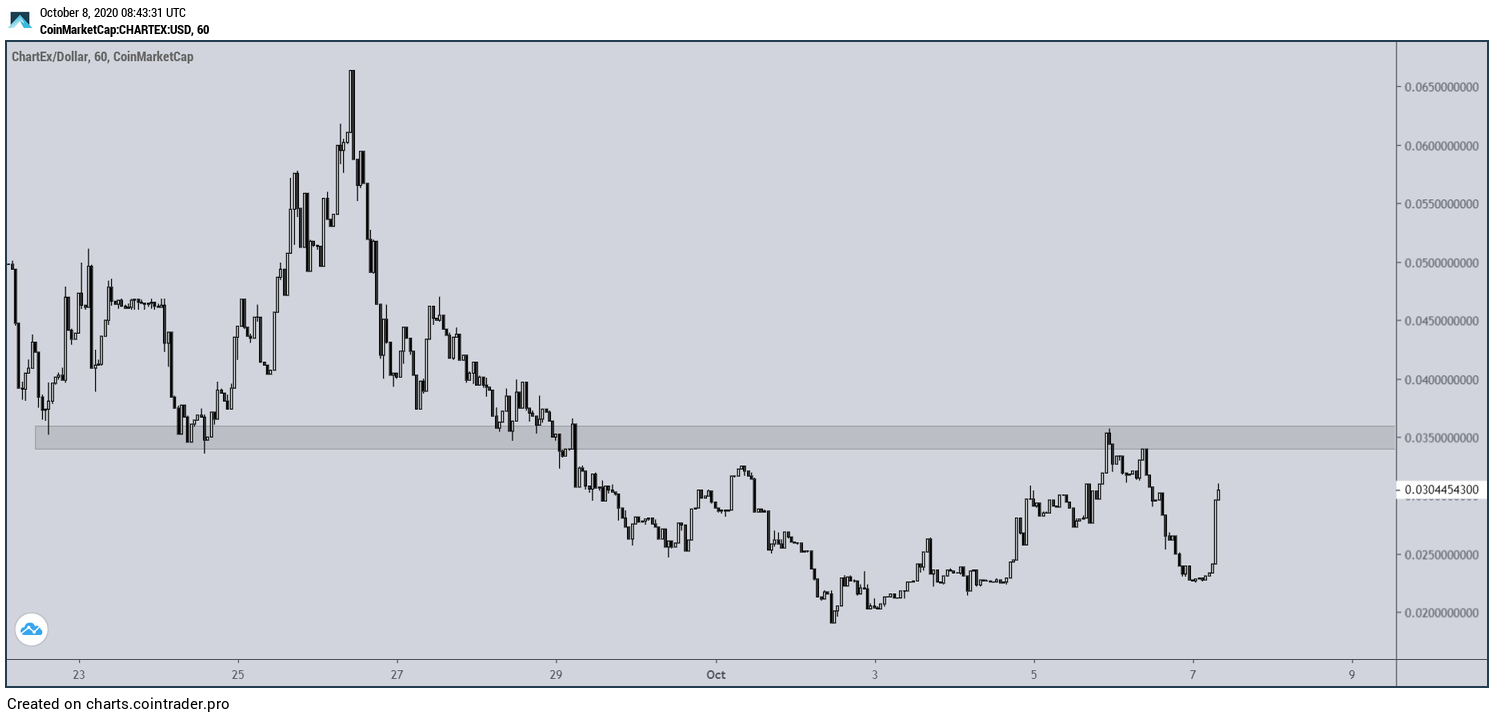
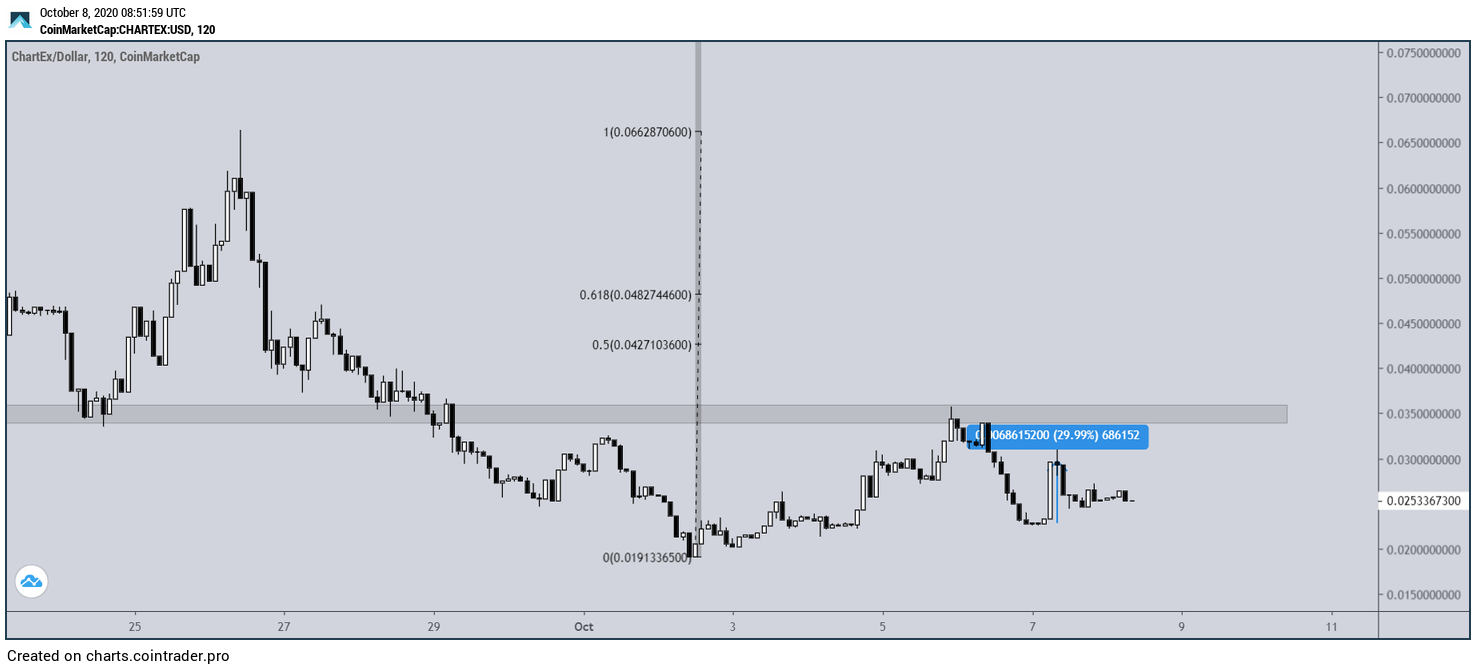
The CHART price has been decreasing since a high of $0.066 was reached on Sept 24. On Sept 29, the price fell below the $0.035 support area and proceeded to reach a low of $0.019 three days later.
The price has been increasing since, and reached the $0.035 area once more on Oct 5. However, the level acted as resistance this time around and rejected the price, causing a sharp drop.
Cryptocurrency trader @damskotrades outlined a CHART chart, which shows possible rallies of more than 100% with targets of $0.048 and $0.08.

For the price to reach the targets, it first has to reclaim the $0.035 resistance area. If CHART successfully does so, the main resistance area would be found between $0.042 – $0.048, fitting with the first target.
Significant pumps are not unusual for CHART, since the price rallied by roughly 30% in the span of only one hour on Oct 7. However, it has yet to give any clear indications that it will move upwards.
Hedera Hashgraph (HBAR)
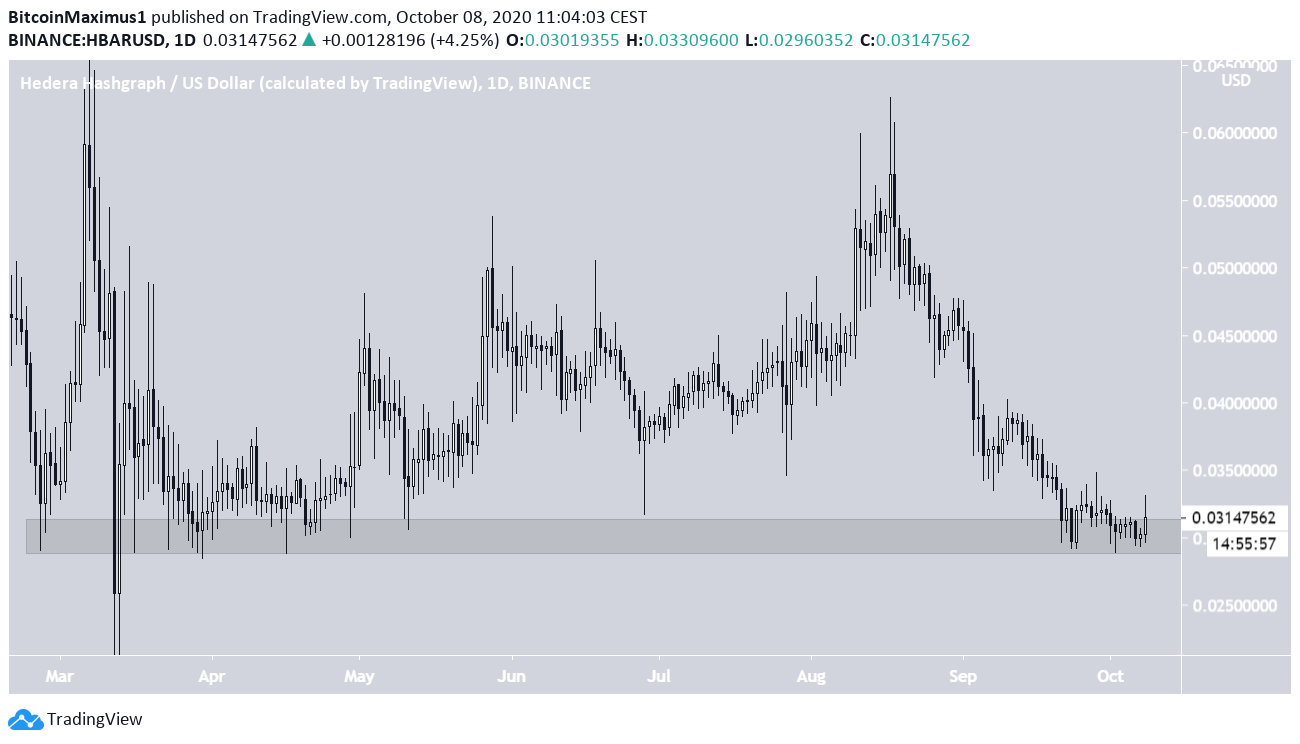
The HBAR price is currently trading inside the $0.03 support area, which has held since March. While the price has initiated several upward movements, they have all proved unsuccessful, with the latest reaching a high of $0.062.
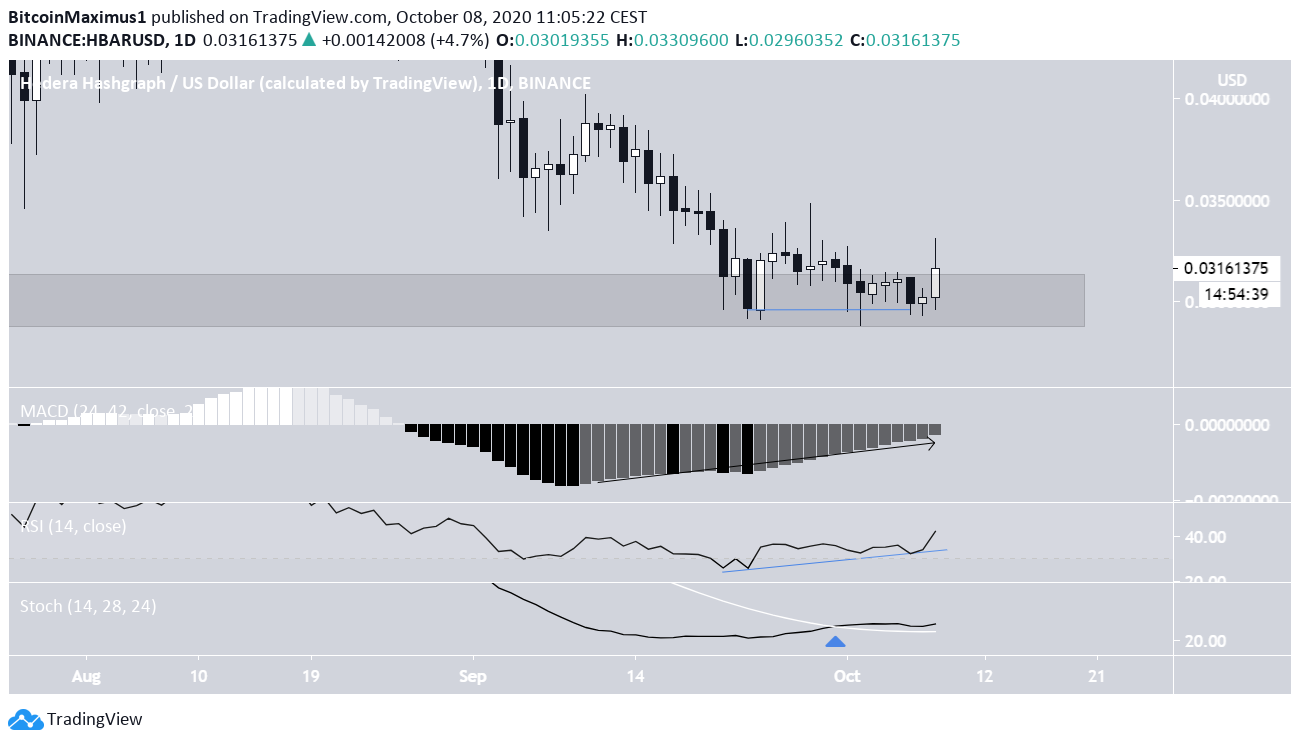
On the daily time-frame, technical indicators are bullish. Both the RSI and the MACD have formed bullish divergence and are moving upwards. Furthermore, the Stochastic Oscillator has made a bullish cross.
These are signs that the price is expected to bounce from the support area and move upwards.
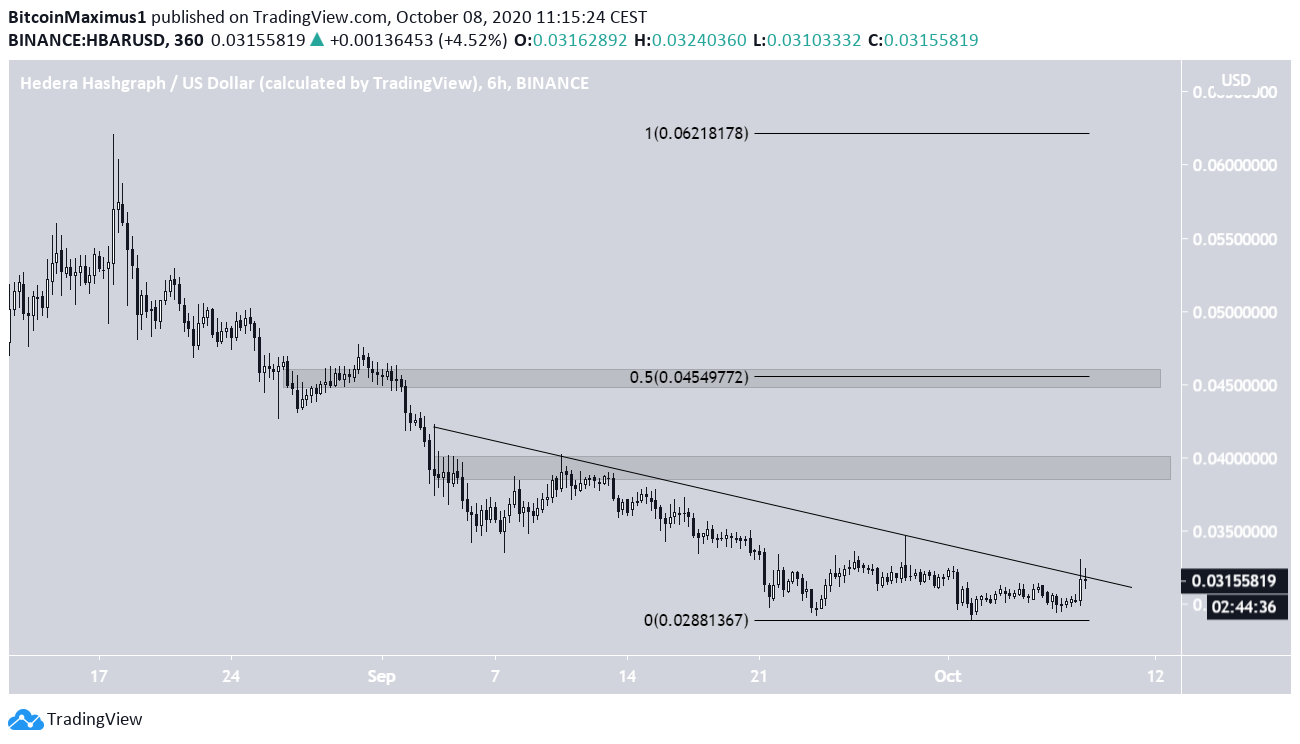
If the price begins to move up, there is minor resistance at $0.039 and major resistance at $0.0455. A breakout from the current descending resistance line would confirm that the price has begun its bounce.
For BeInCrypto’s Bitcoin analysis, click here!
Disclaimer: Cryptocurrency trading carries a high level of risk and may not be suitable for all investors. The views expressed in this article do not reflect those of BeInCrypto.
The post Two Lesser-Known Altcoins With Significant Potential For Increases appeared first on BeInCrypto.



![Decentraland: Review & Beginner's Guide [current_date format=Y] 35 Decentraland: Review & Beginner's Guide](https://cryptheory.org/wp-content/uploads/2020/11/decentraland-02-gID_7-300x150.jpg)