XMR vs LTC: Which Coin Will Perform Better in April?
2 min readThis article will take a look at the Litecoin (LTC) and Monero (XMR) price movement and outline their potential for increases during the month of April.
XMR
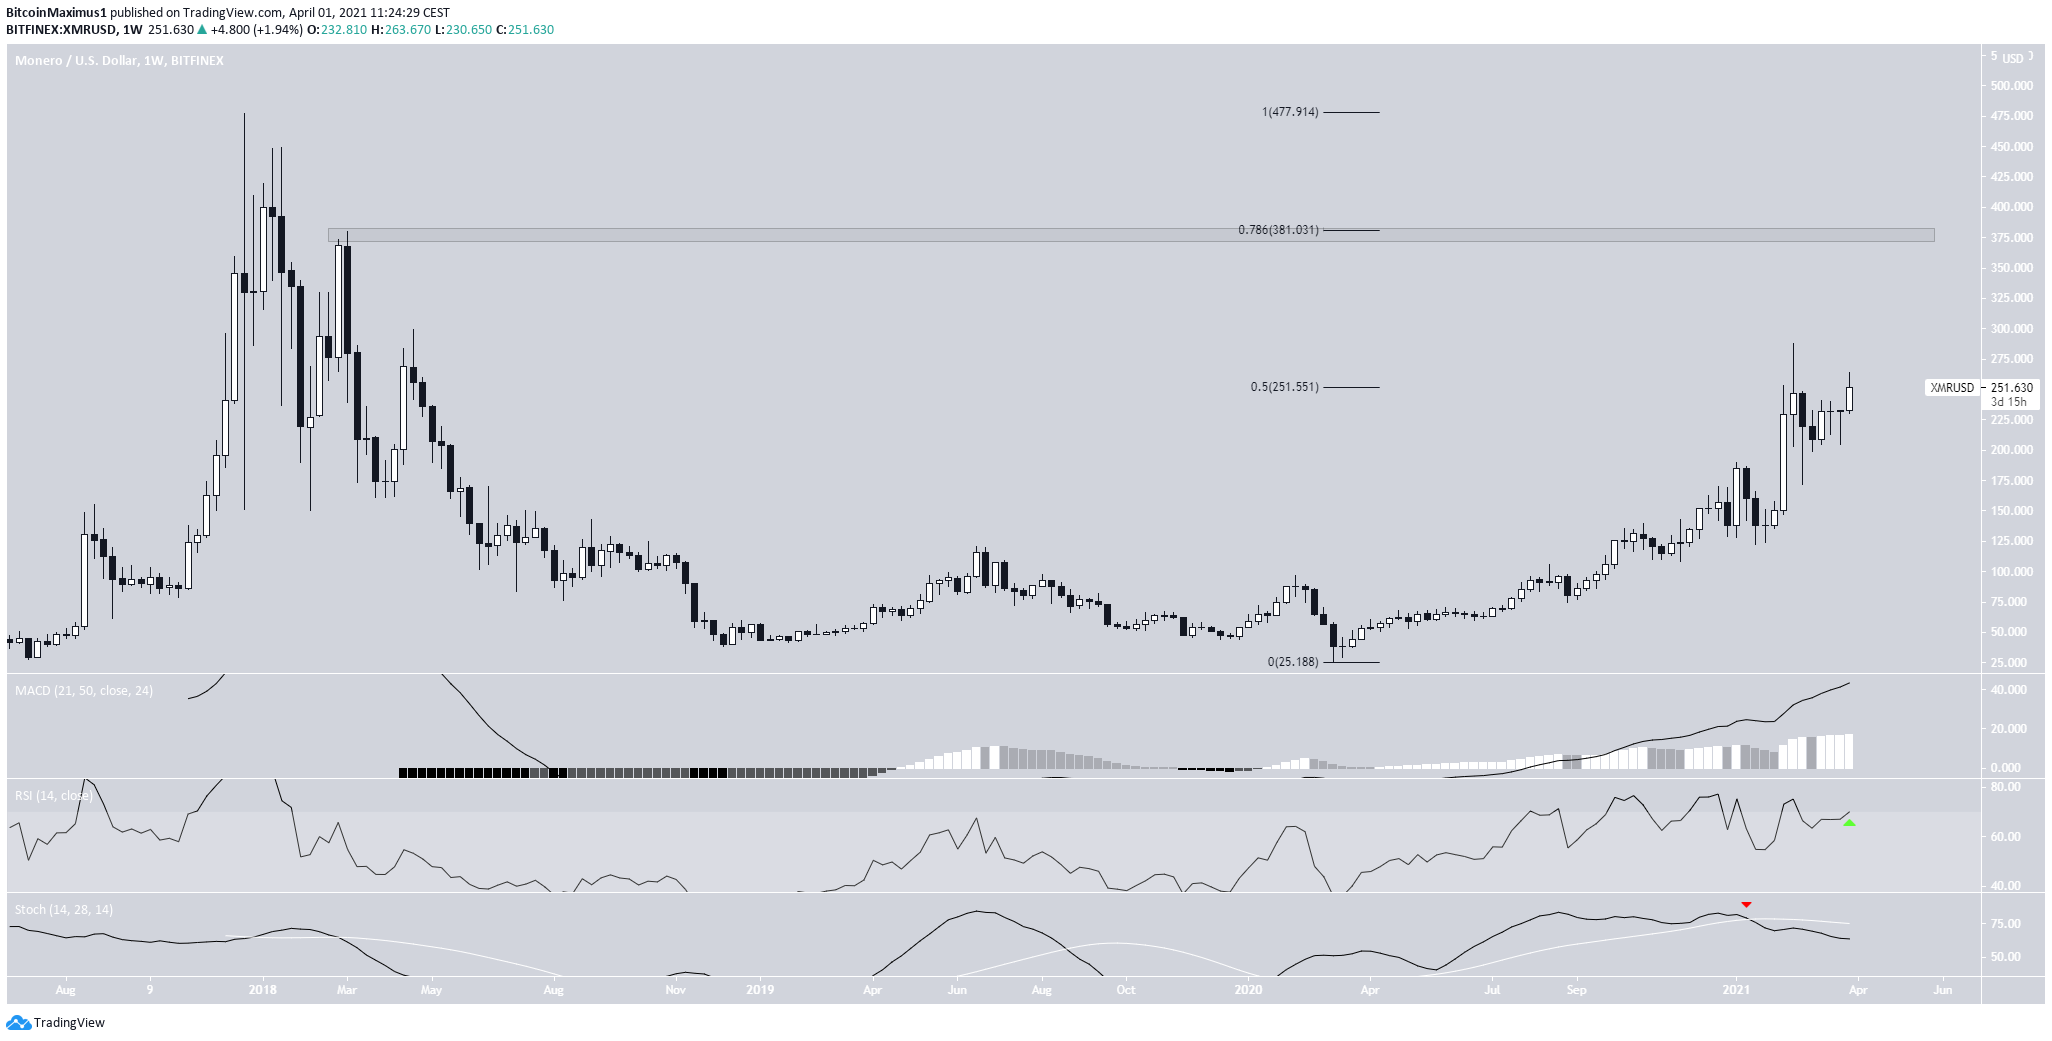
XMR reached a high of $287 on Feb. 20. However, it dropped immediately afterward and has yet to move above the high in Feb. since.
The high occurred right at the 0.5 Fib retracement level of the entire previous decrease at $251. If XMR manages to break out, the token will find the next resistance area at $381. This is both a horizontal resistance level and the 0.786 Fib retracement of the previous downward movement.
Technical indicators are more bullish than bearish. The RSI has just crossed above 70, and the MACD is increasing. However, the Stochastic oscillator has made a bearish cross.
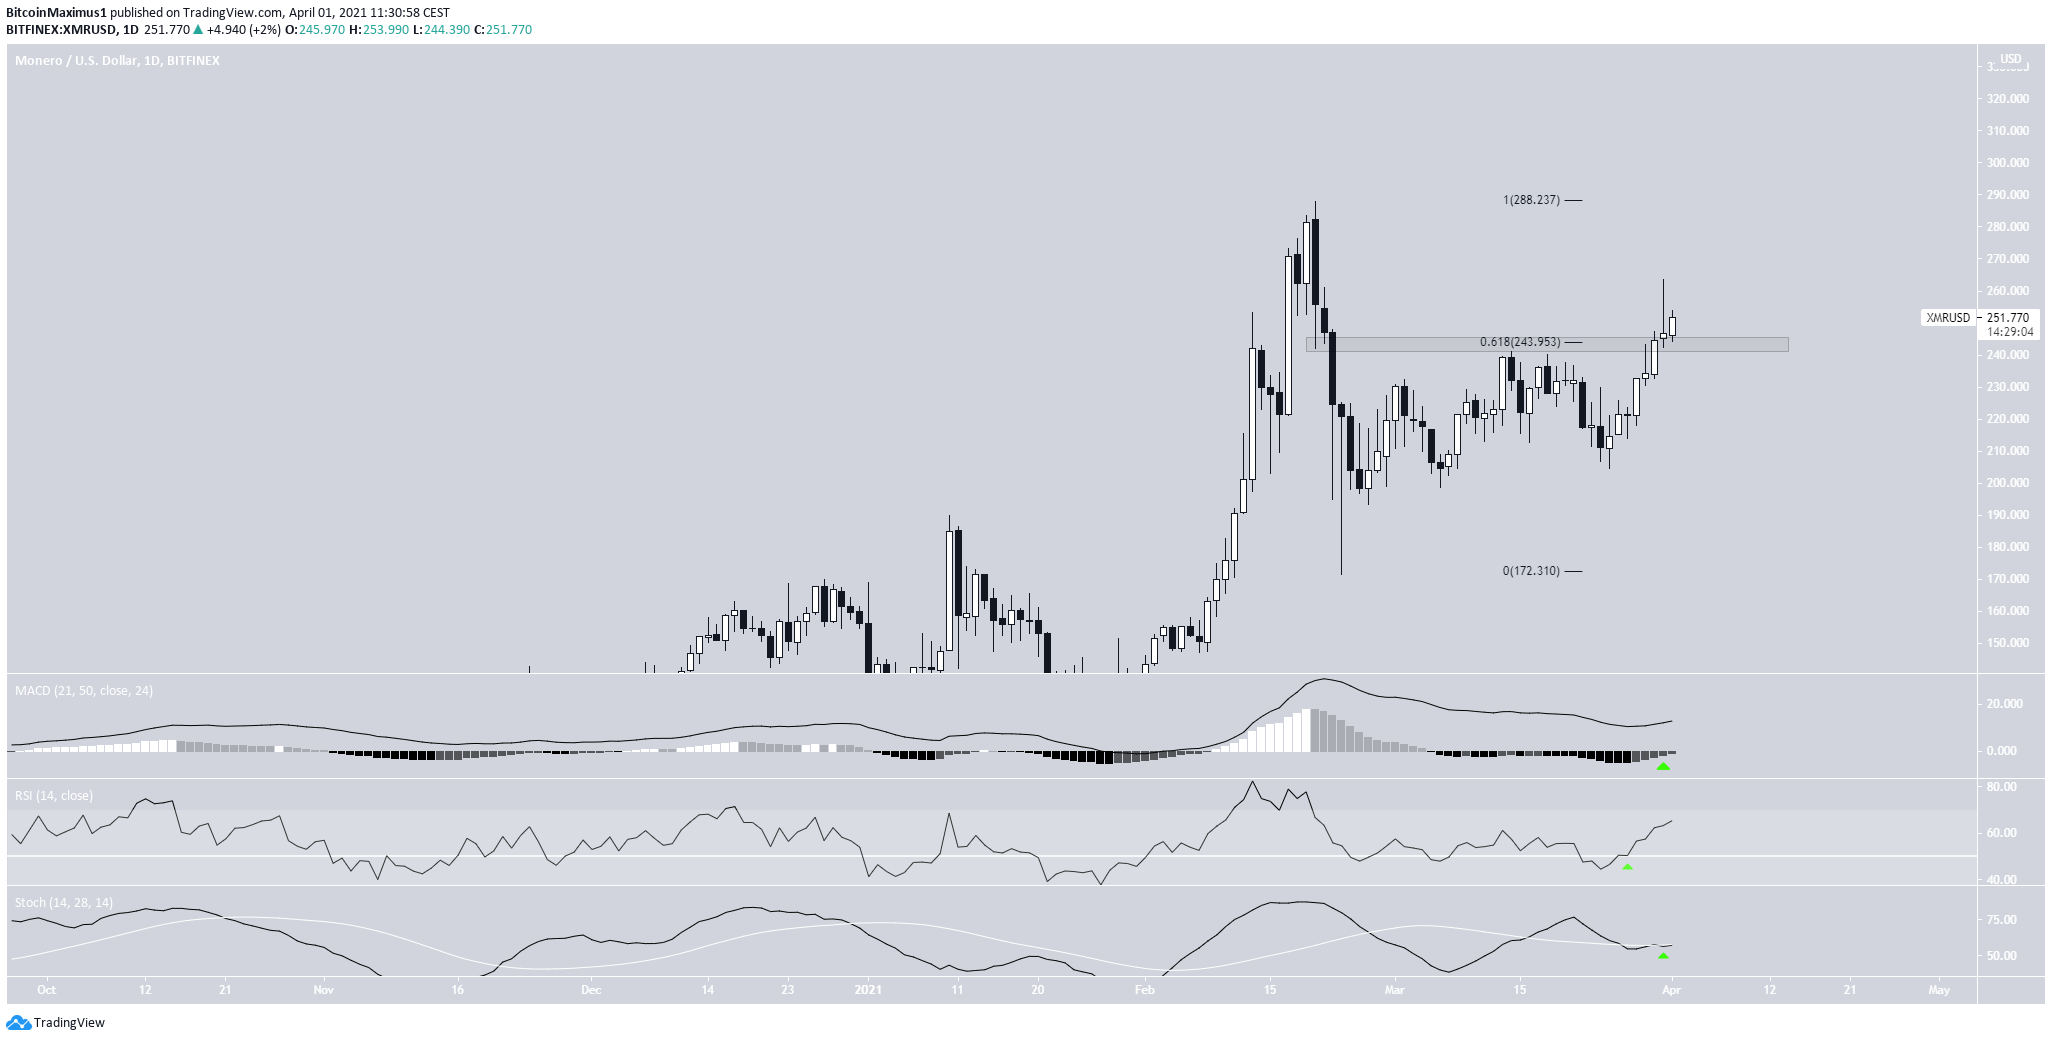
The daily chart is decisively bullish.
XMR has just moved above the $244 resistance area, the 0.618 Fib retracement level of the previous decrease. Also, it has managed to reach a close above it.
Furthermore, the RSI, MACD & Stochastic oscillator are bullish. The MACD has just given a bullish reversal signal and has crossed into positive territory.
Therefore, XMR is expected to break out above the $255 long-term resistance area and gradually move towards $381.
A move to $381 would be a slightly more than 50% increase.
LTC
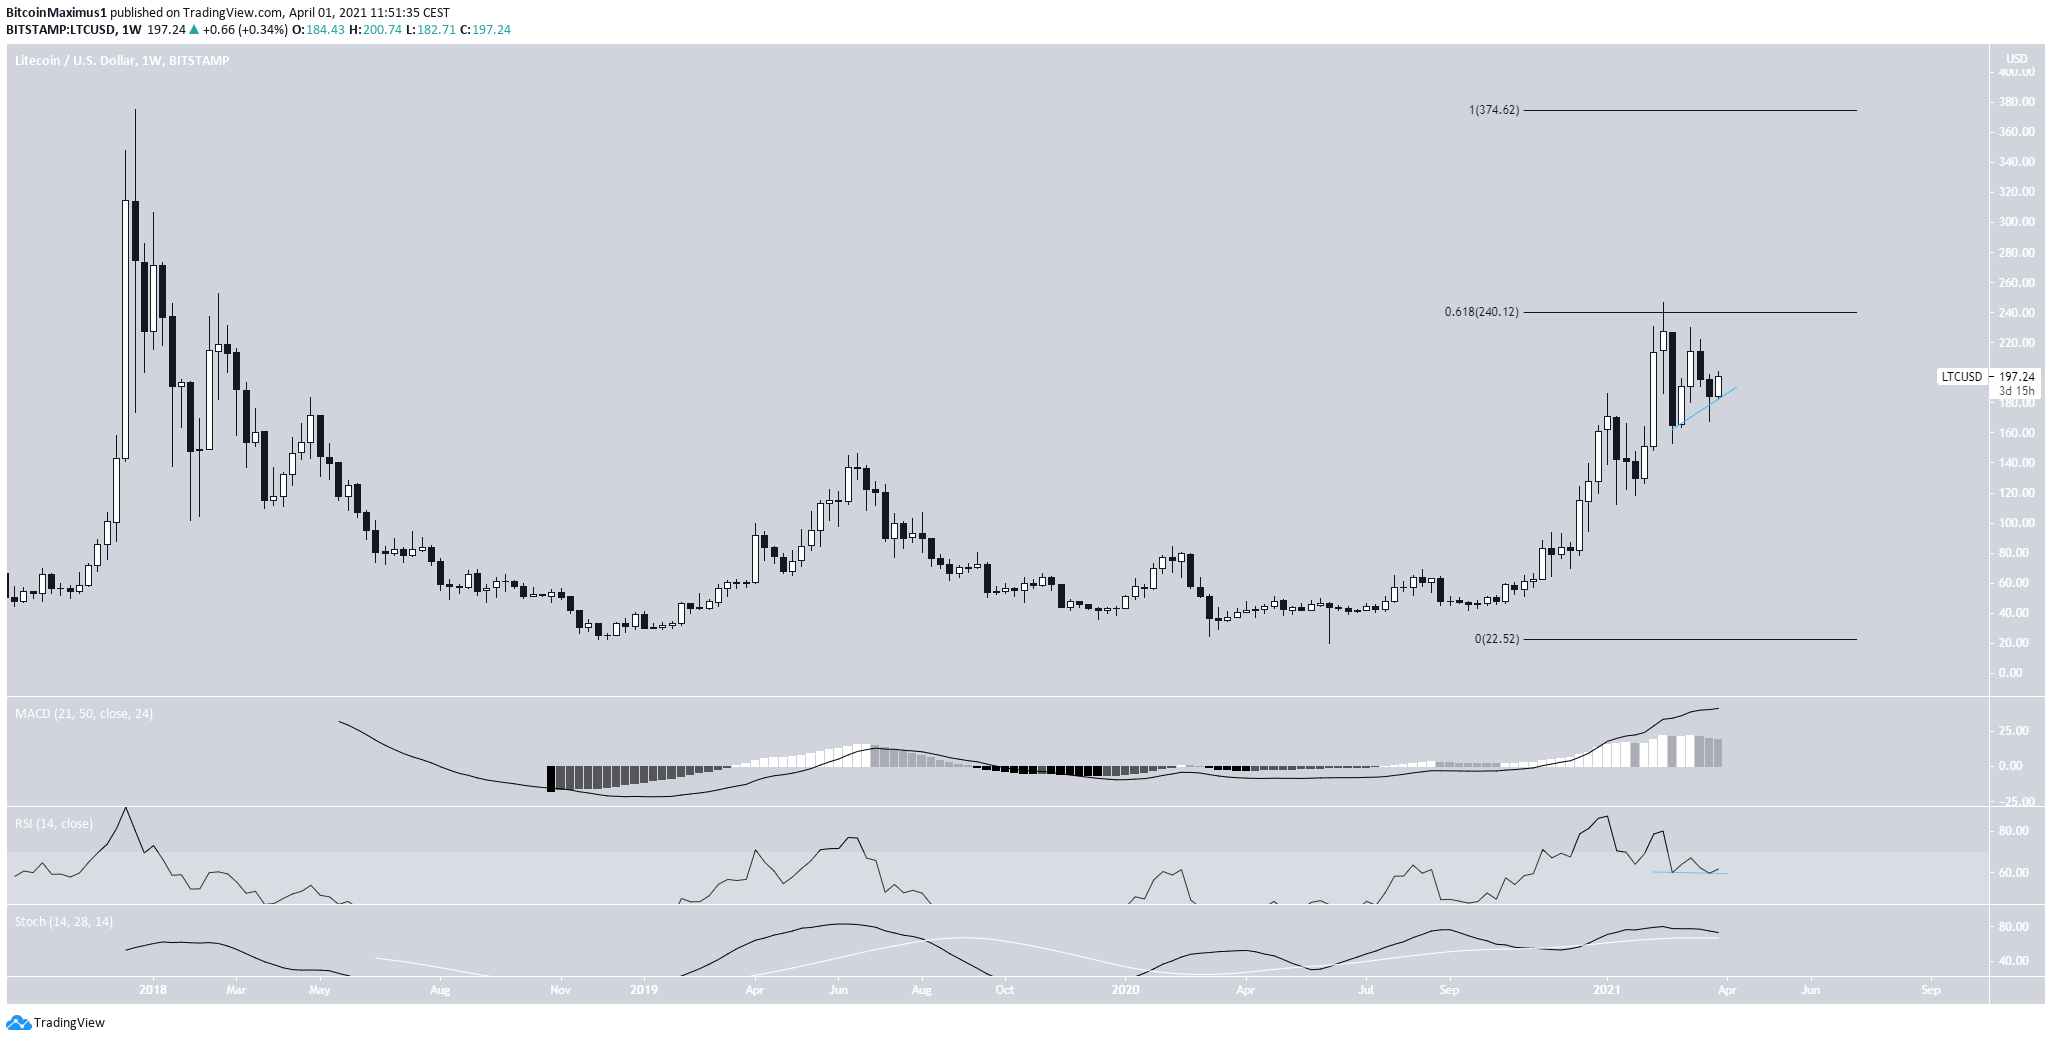
LTC reached a high of $255.71 on Feb. 14 and dropped sharply afterward. The high was important since it occurred right at the 0.618 Fib retracement of the previous downward move. Therefore, it validated the $240 area as resistance.
Technical indicators are bullish. Despite showing some loss of momentum, the MACD & the Stochastic oscillator are still positive. Furthermore, the RSI has generated hidden bullish divergence, a strong sign of trend continuation.
If LTC manages to break out, the token will find the next resistance all the way at the all-time highs of $375.
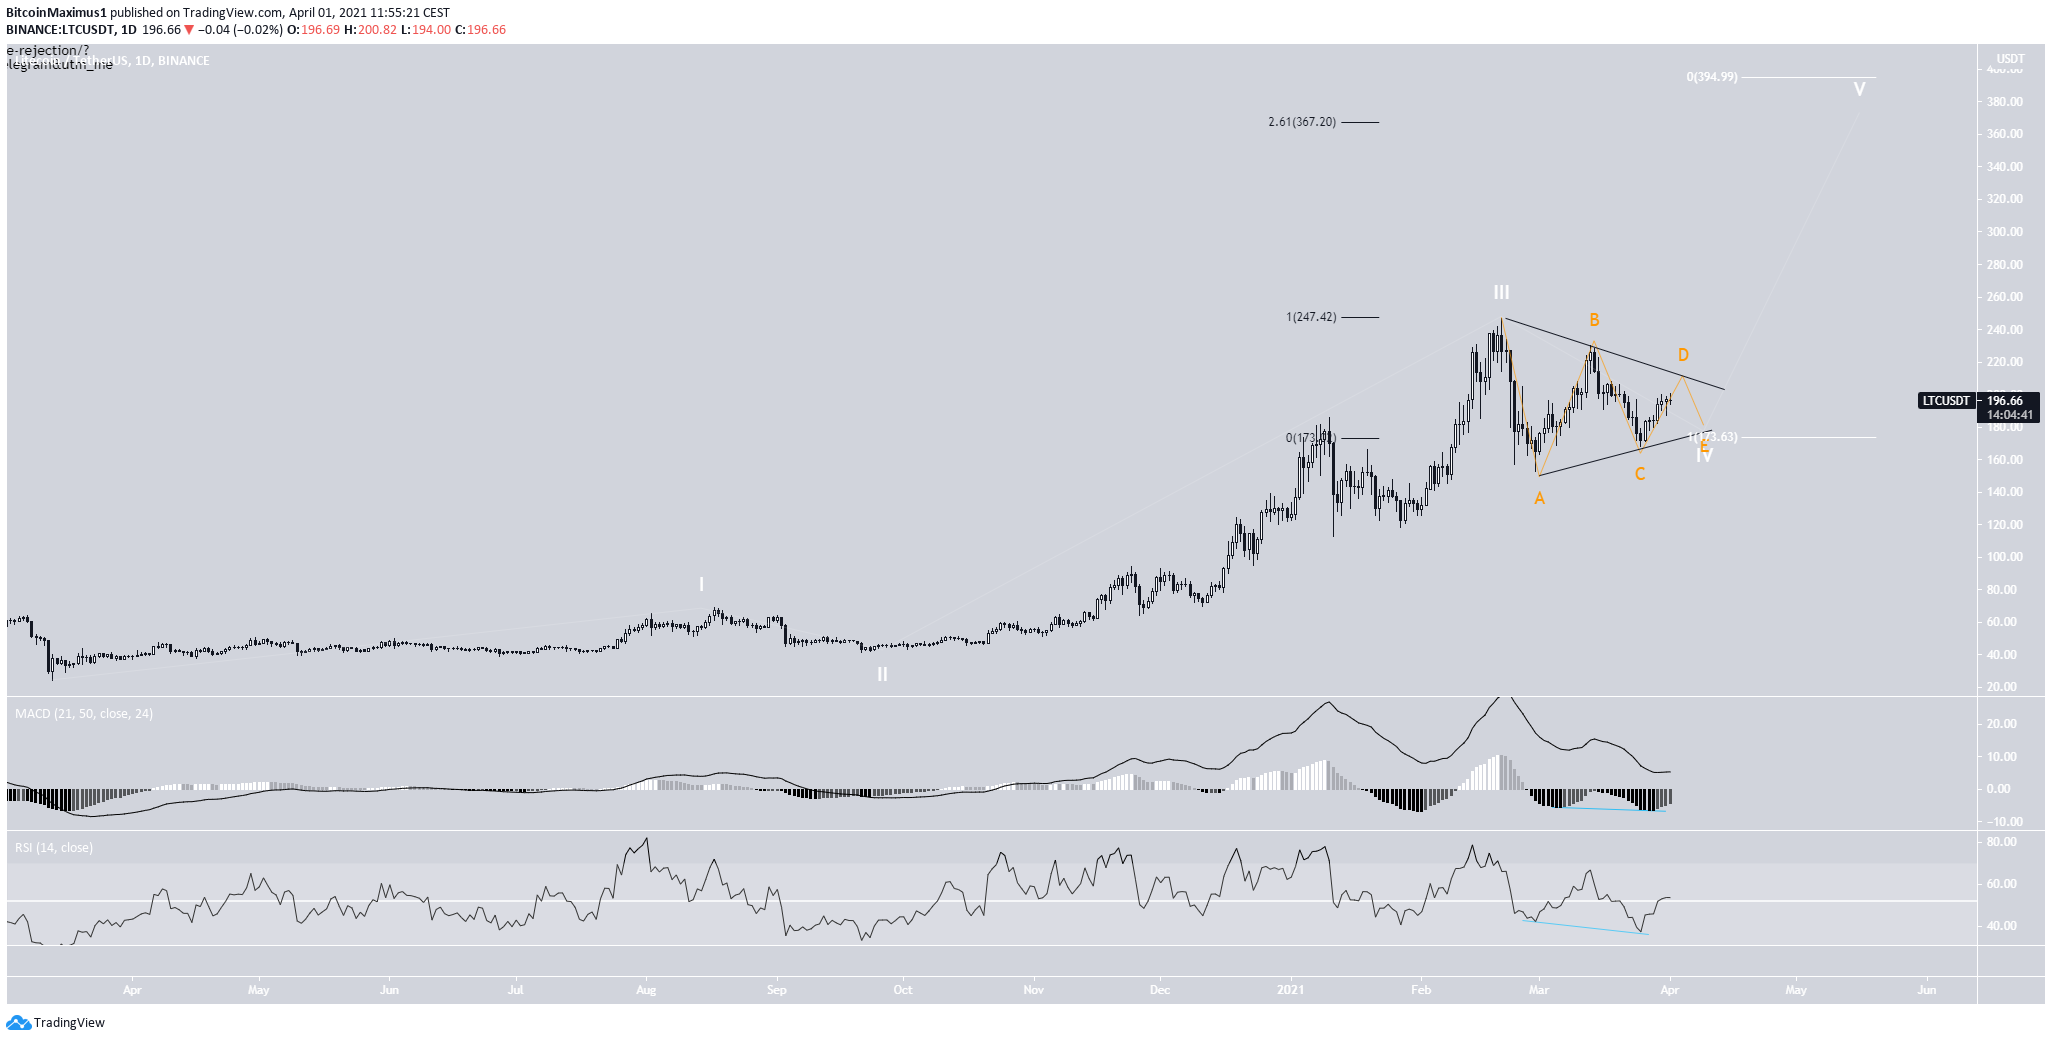
The daily chart shows that LTC is trading inside a symmetrical triangle, possibly wave four (white) of a bullish impulse.
Technical indicators are bullish. Both the RSI & MACD have generated considerable hidden bullish divergence.
If LTC breaks out, it will find the two most likely targets at $367 and $394. They are found using an external Fib retracement on wave four and projection on waves 1-3. Measuring from the current price, this amounts to an increase between 88 and 98%.
Conclusion
To conclude, the movement for both XMR and LTC looks bullish. However, long-term indicators are more bullish for LTC, as evidenced by the hidden bullish divergence in the RSI.
Furthermore, the main resistance area for LTC is further away than that for XMR. Therefore, the potential for increases in April is higher for LTC than it is for XMR.
For a similar comparison of Basic Attention Token (BAT) and Reserve Rights (RSR) in March, click here.
For BeInCrypto’s latest BTC (BTC) analysis, click here.
The post XMR vs LTC: Which Coin Will Perform Better in April? appeared first on BeInCrypto.


![Decentraland: Review & Beginner's Guide [current_date format=Y] 29 Decentraland: Review & Beginner's Guide](https://cryptheory.org/wp-content/uploads/2020/11/decentraland-02-gID_7-300x150.jpg)