Yearn Finance (YFI) Sets Sights on New All-Time High
2 min readTable of Contents
Yearn Finance (YFI) is approaching its all-time high price resistance at $43,500, a level that hasn’t been tested since September 2020.
However, there are short-term signs of weakness present, indicating that a correction is likely to occur before another breakout attempt.
Yearn Finance Approaches All-Time High
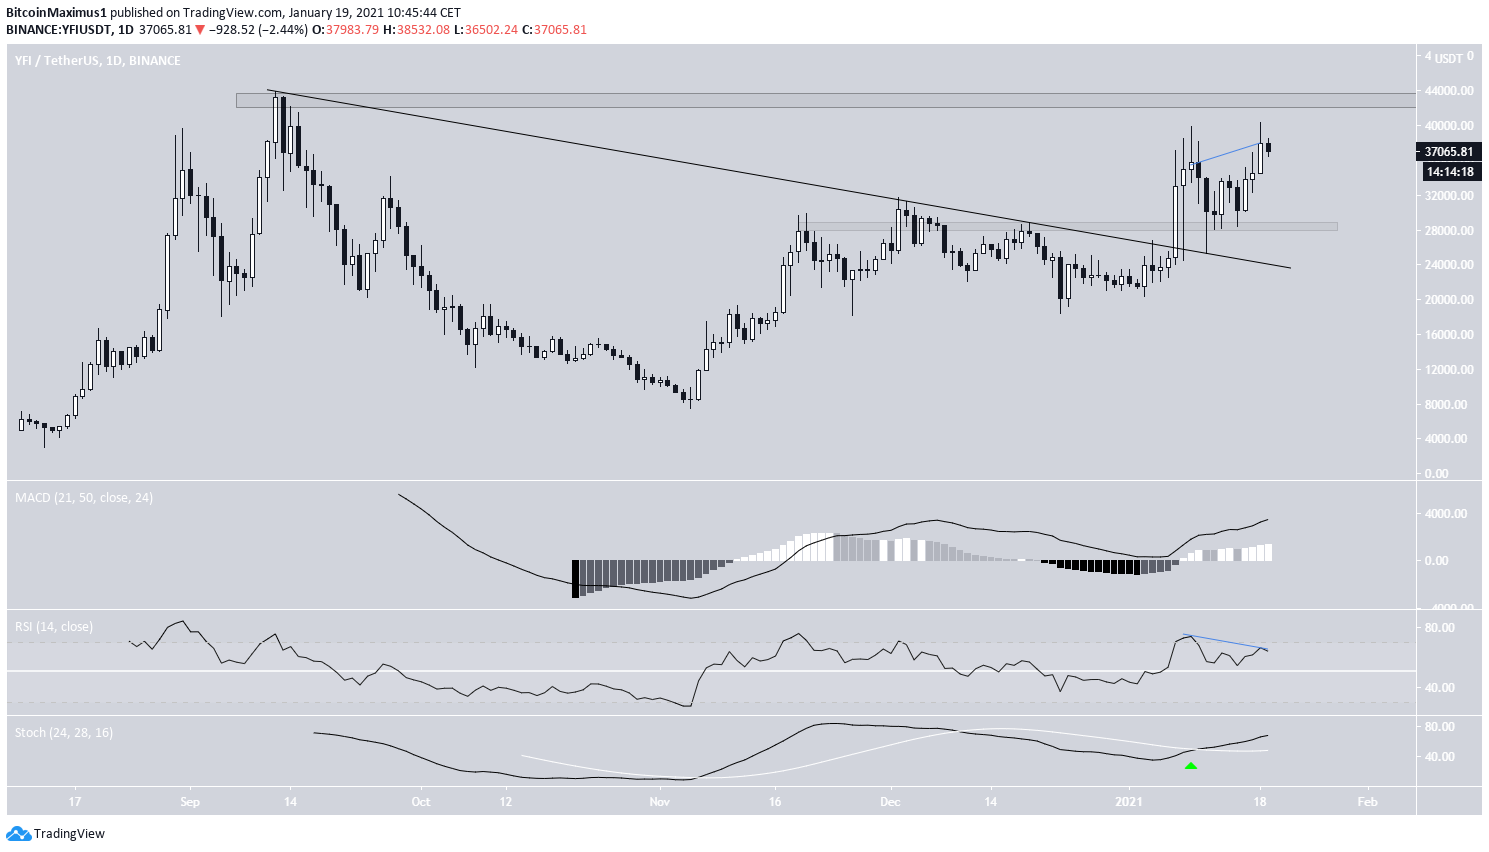
YFI had been following a descending resistance line since reaching an all-time high price of $43,966 on Sept. 12, 2020. After three unsuccessful attempts, YFI managed to break out on Jan. 7 to reach a local high of $39,939.
After validating the line as support, YFI reclaimed the $28,000 area, validated it as support, and has been moving upwards. Currently, it is approaching the all-time high resistance area at $42,500.
Technical indicators are relatively bullish. Both the MACD and Stochastic oscillator are increasing, but the daily RSI has generated a bearish divergence, which could initiate a correction.
Therefore, a look at lower time-frames is required in order to better determine the direction of the next move.

Potential Double-Top
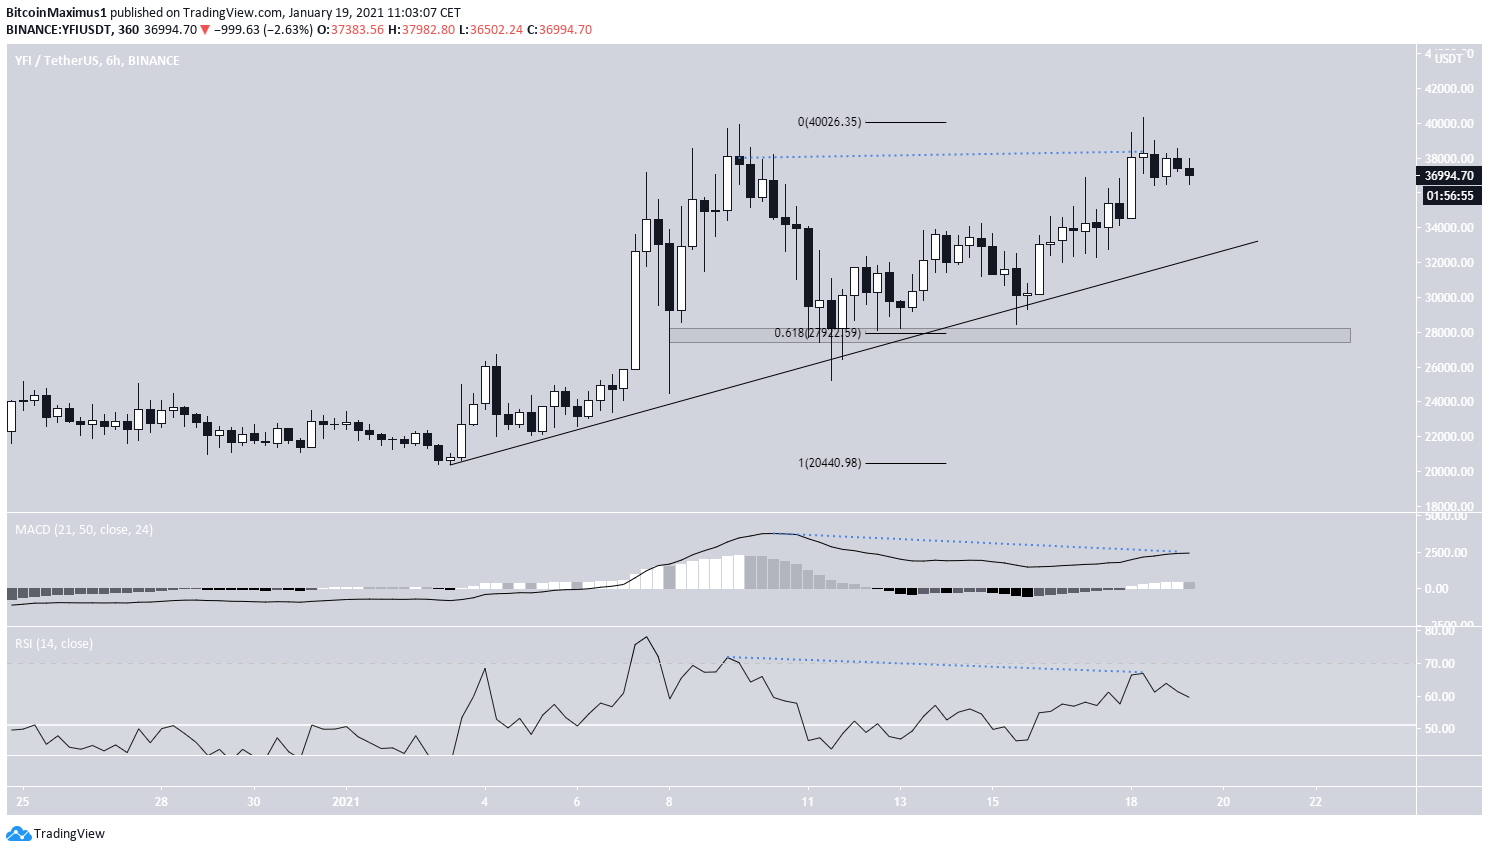
The six-hour chart shows a potential double-top pattern near $38,000. Similar to the daily time-frame chart, the double top has been combined with a bearish divergence in the RSI and MACD.
YFI is also following an ascending support line, which is currently at $34,000. While a drop towards this support line seems likely, a breakdown would likely knock YFI back to the 0.618 Fib retracement level at $28,000.
While a decrease towards the support line is likely, we cannot yet determine if YFI will break down from the support line or bounce.

YFI Wave Count
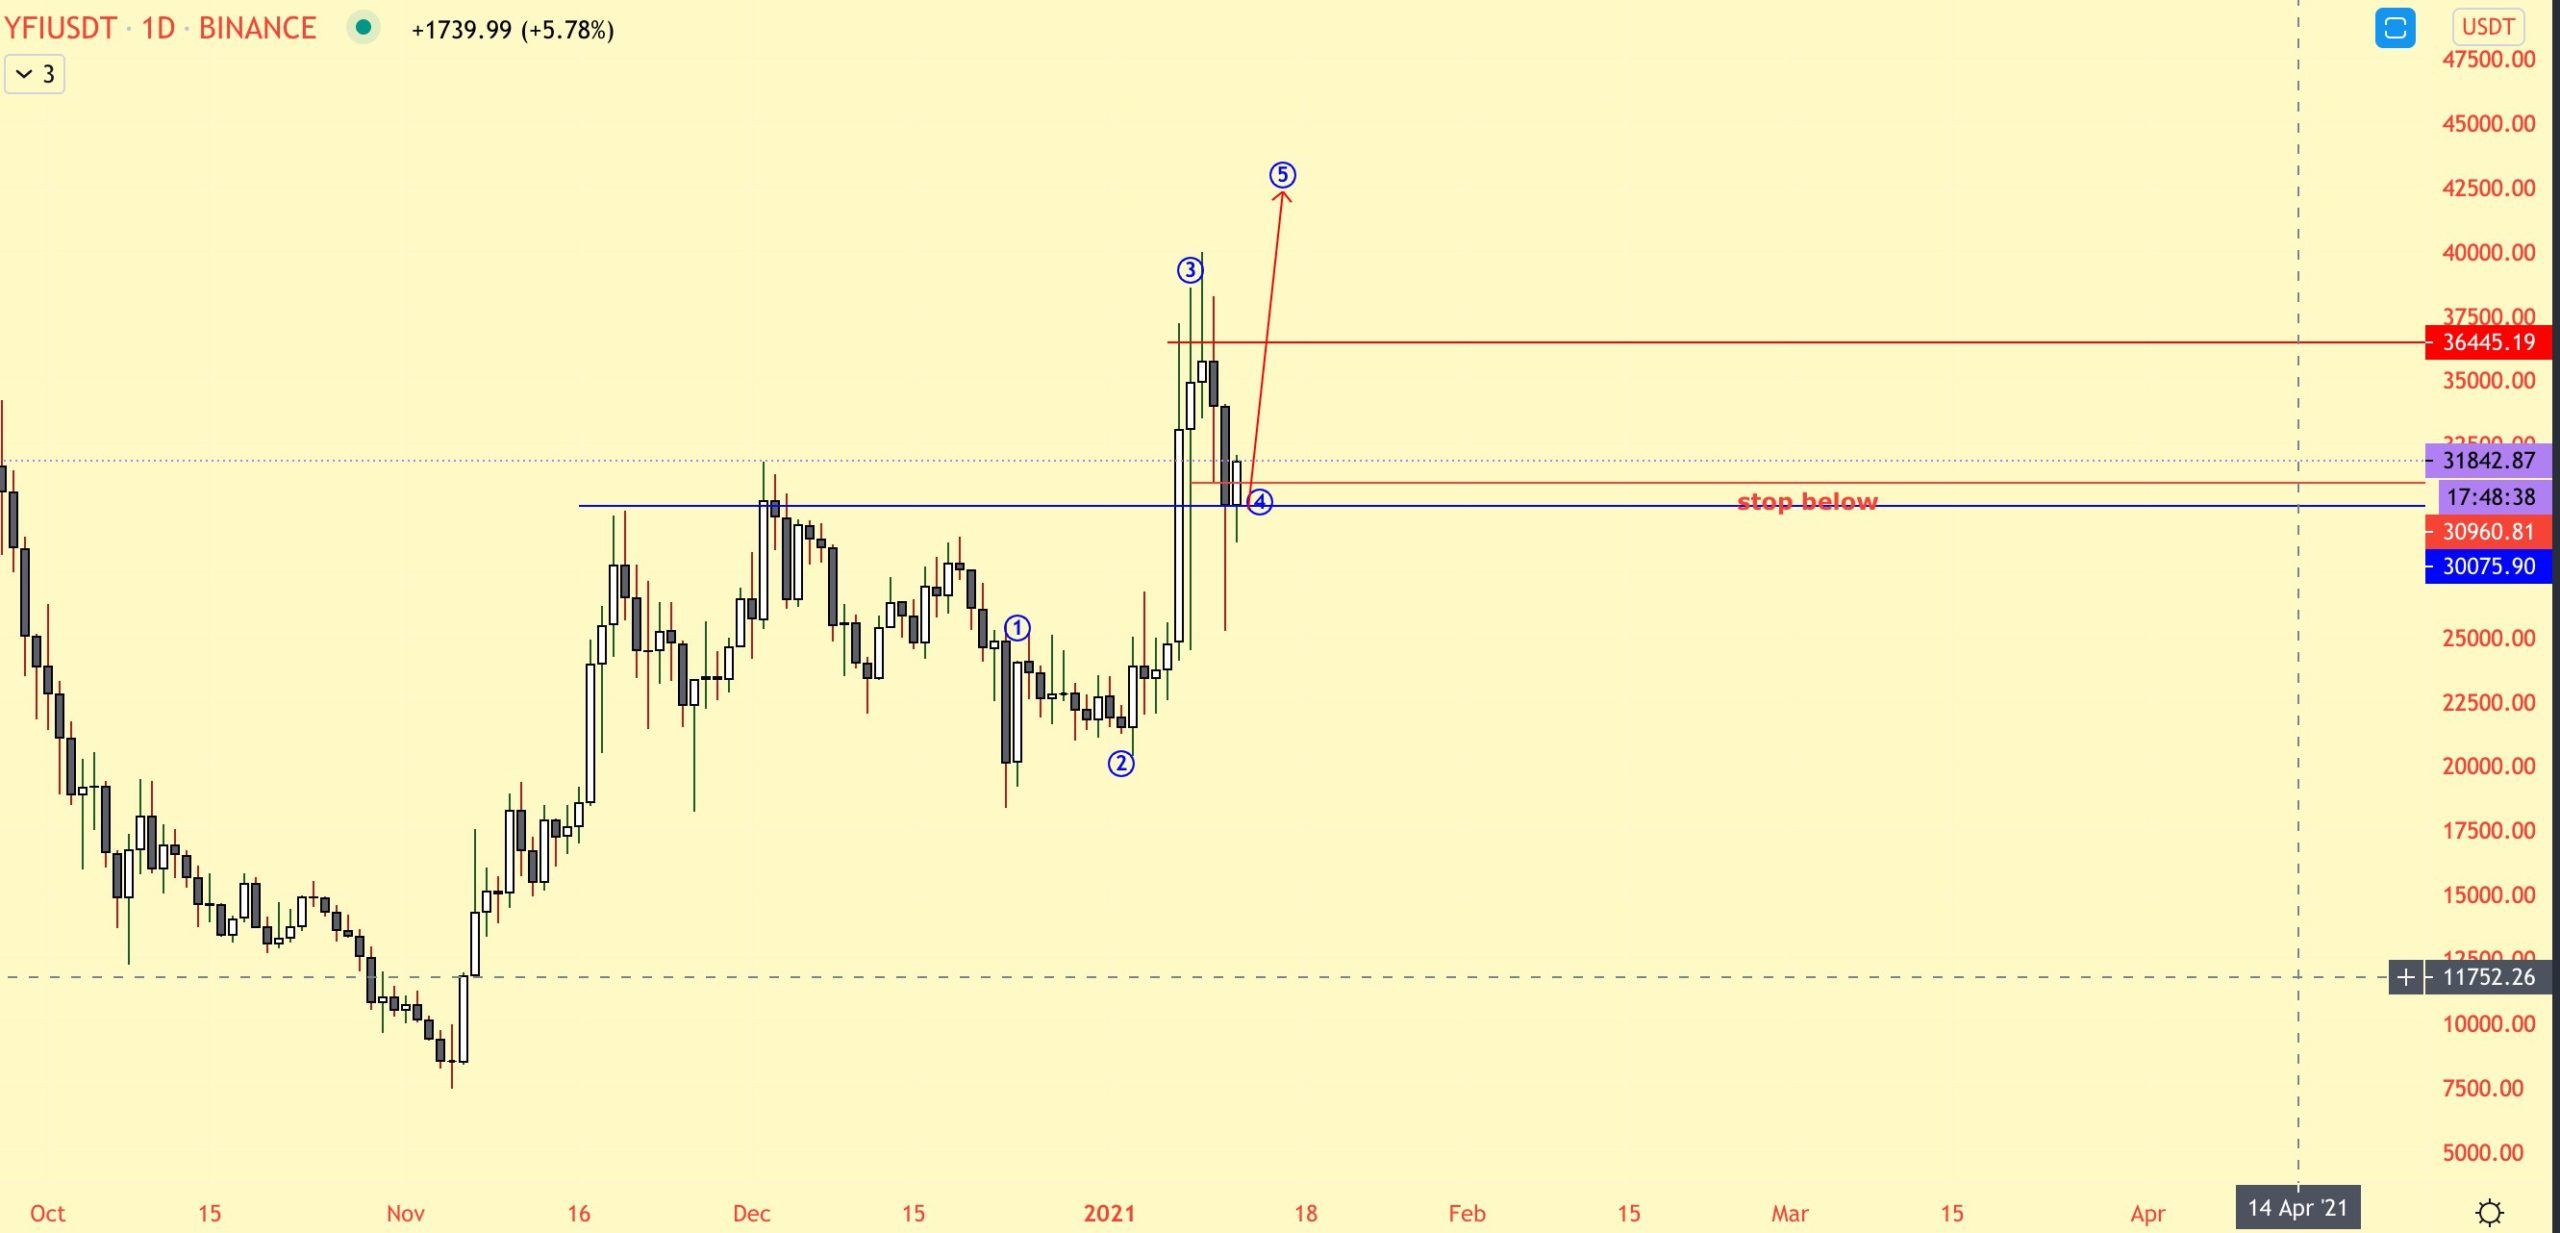
Cryptocurrency trader @TheEWguy outlined a YFI chart which suggests that YFI is in wave 4 with another high expected.

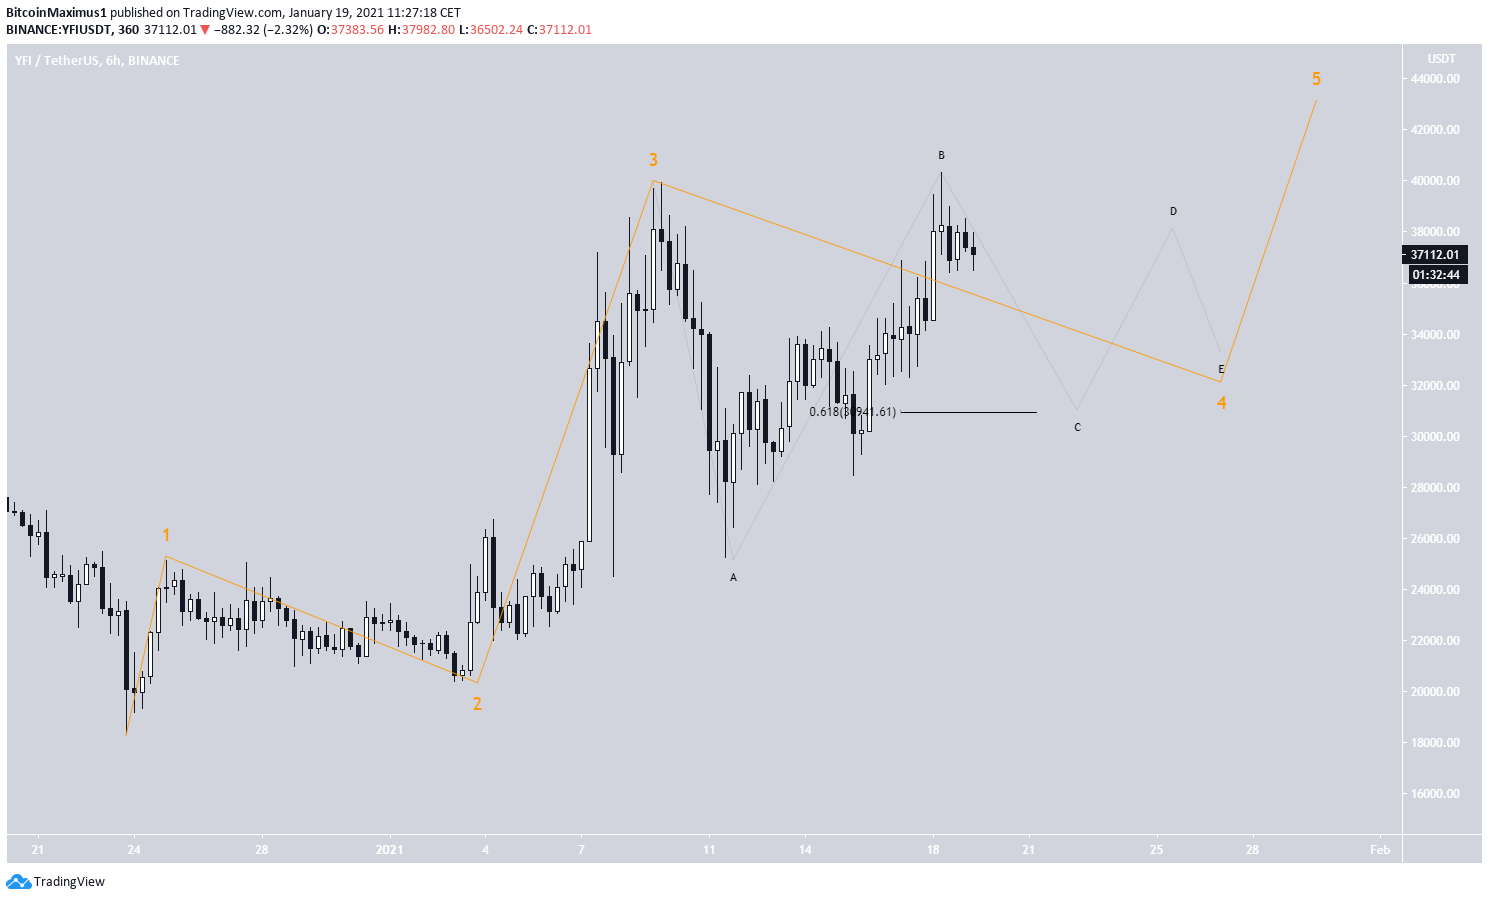
While YFI has already reached a new local high, the movement from the lows does not look impulsive. Therefore, it’s possible that YFI is still in wave 4 (shown in orange below), which has taken the shape of a triangle. This would also fit with the possible decrease resulting from the double-top.
While the preliminary target remains at $43,500, a more accurate projection will be given once wave 4 is complete.
The sub-wave count for the triangle is shown in black.

Conclusion
While Yearn Finance (YFI) is expected to make another attempt at reaching a new all-time high, a short-term drop is expected before the upward move resumes.
For BeInCrypto’s latest Bitcoin (BTC) analysis, click here!
Disclaimer: Cryptocurrency trading carries a high level of risk and may not be suitable for all investors. The views expressed in this article do not reflect those of BeInCrypto.
The post Yearn Finance (YFI) Sets Sights on New All-Time High appeared first on BeInCrypto.


![Decentraland: Review & Beginner's Guide [current_date format=Y] 29 Decentraland: Review & Beginner's Guide](https://cryptheory.org/wp-content/uploads/2020/11/decentraland-02-gID_7-300x150.jpg)