Zcash (ZEC) Struggles to Break Out Above Horizontal Resistance Level
2 min readTable of Contents
While the Zcash (ZEC) price has broken out from a short-term descending resistance line, it is more likely that the upward move is corrective.
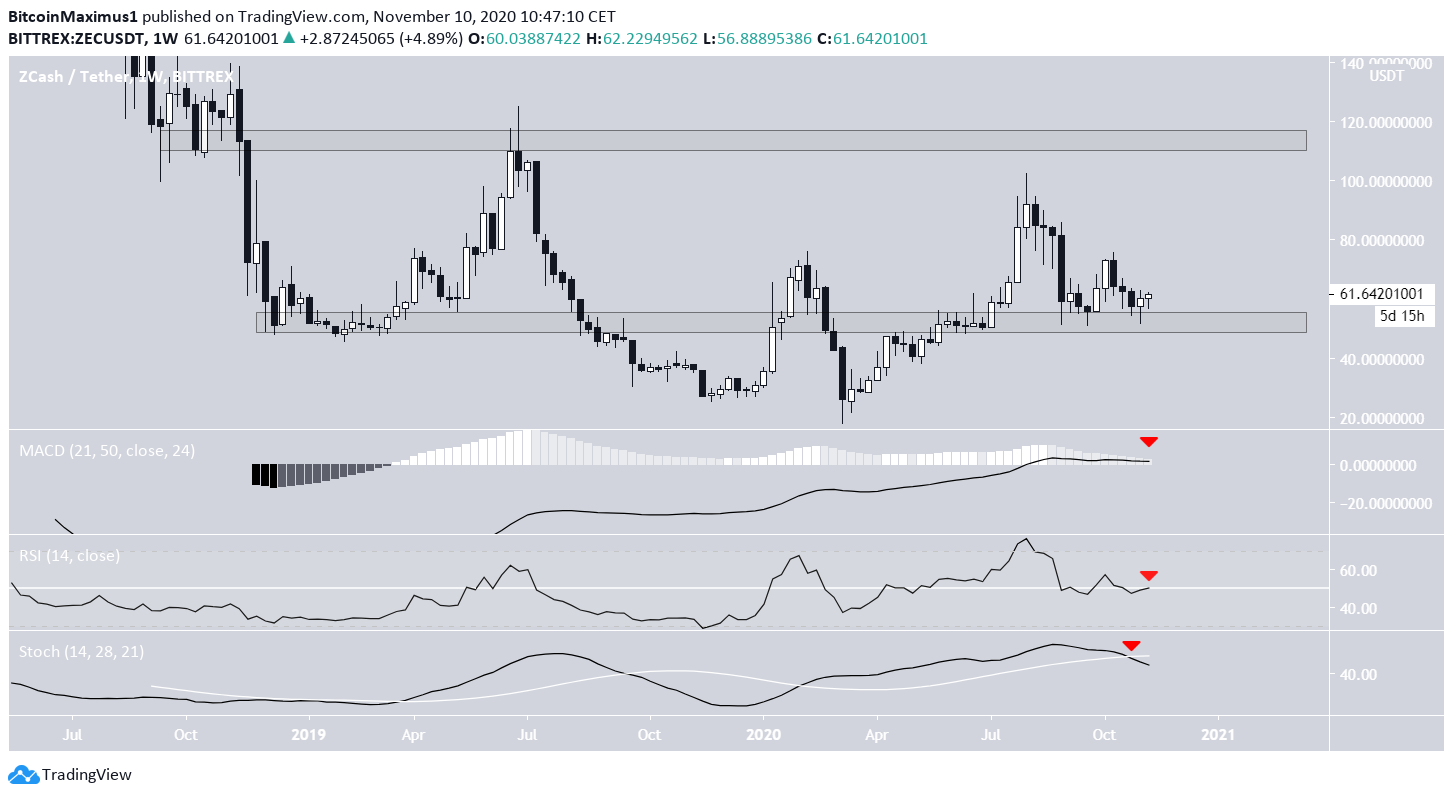
ZEC is currently trading slightly above its long-term $52.50 support level. The price had previously broken out from this level but has now returned to validate it for the second time.
ZEC Signals Bearish
While this appears to be a common double-bottom pattern, technical indicators are bearish. The Stochastic oscillator has made a bearish cross, the RSI is below 50, and the MACD is at risk of turning negative.
A breakdown from the support area would likely trigger a very sharp drop.
The closest long-term resistance level that has been validated more than once is found at $110, but this level seems very unlikely to be reached anytime soon.
Current Breakout
Cryptocurrency trader @TradingTank outlined a ZEC chart that shows a breakout from a descending wedge, as well as a path outline predicting further price action to the upside.
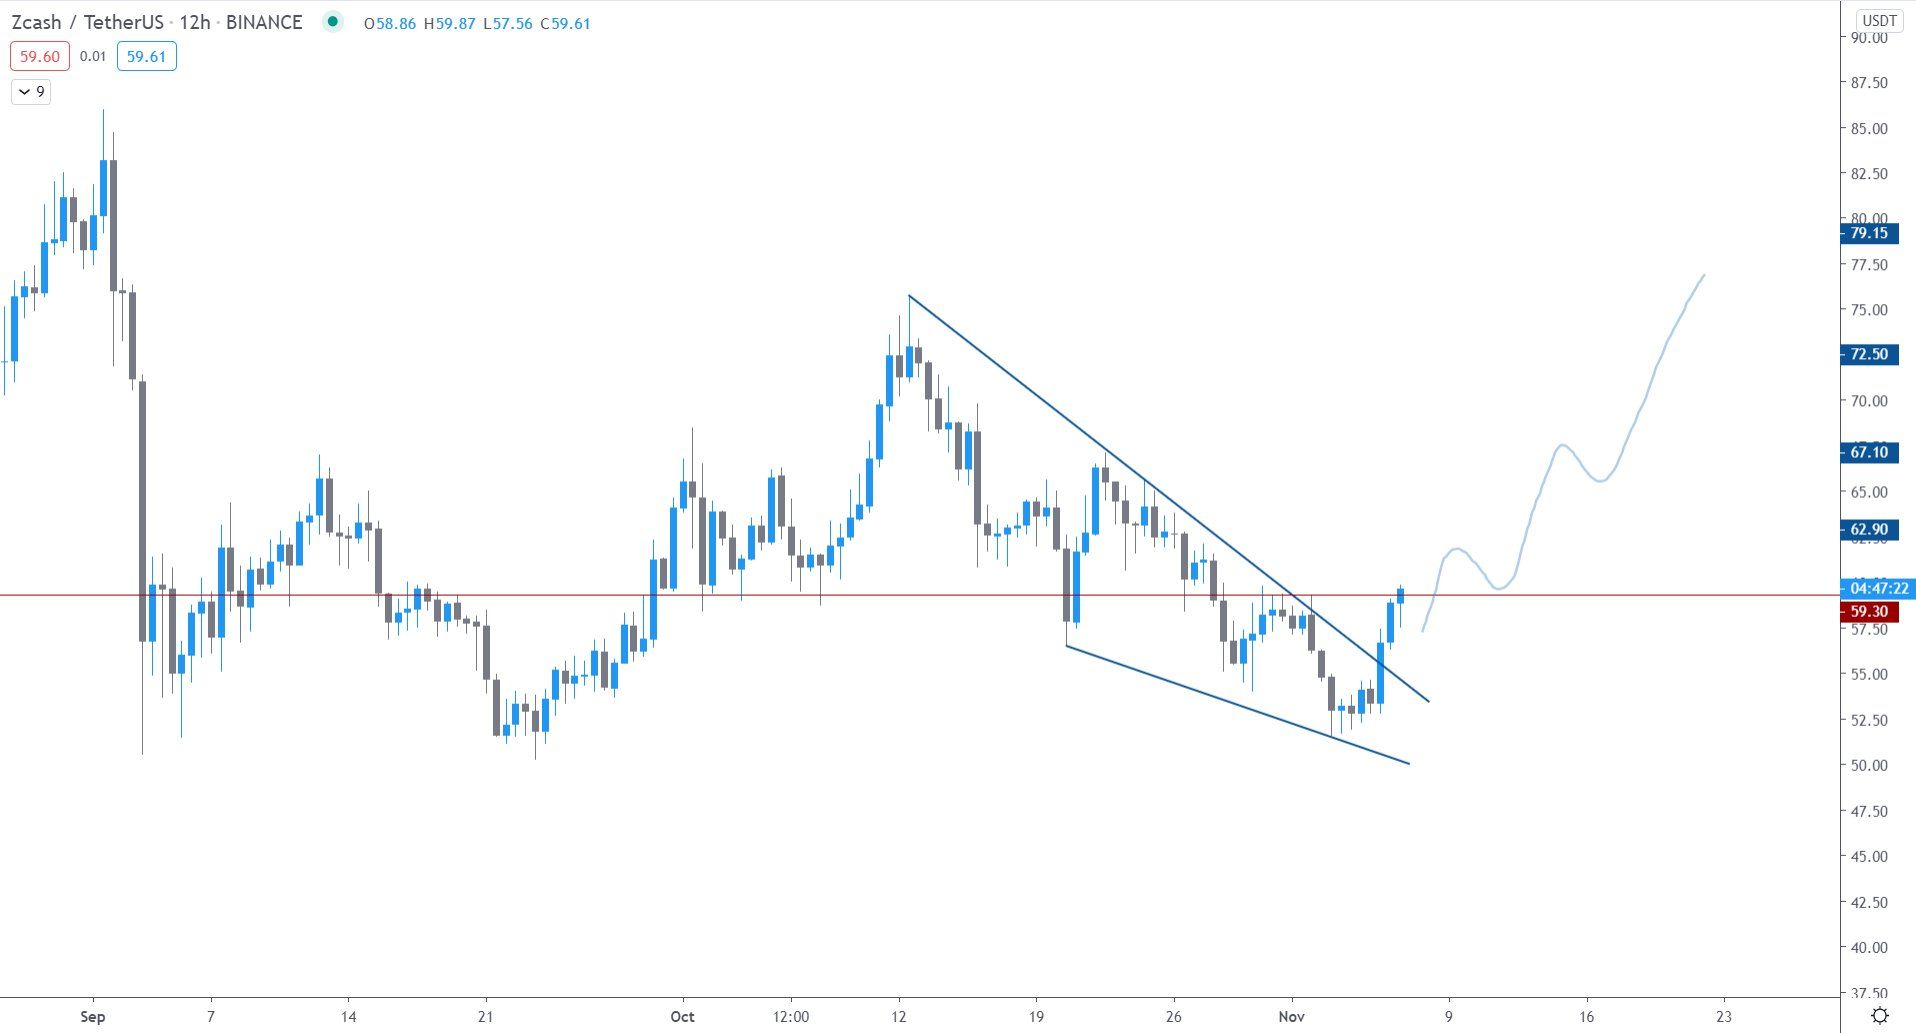
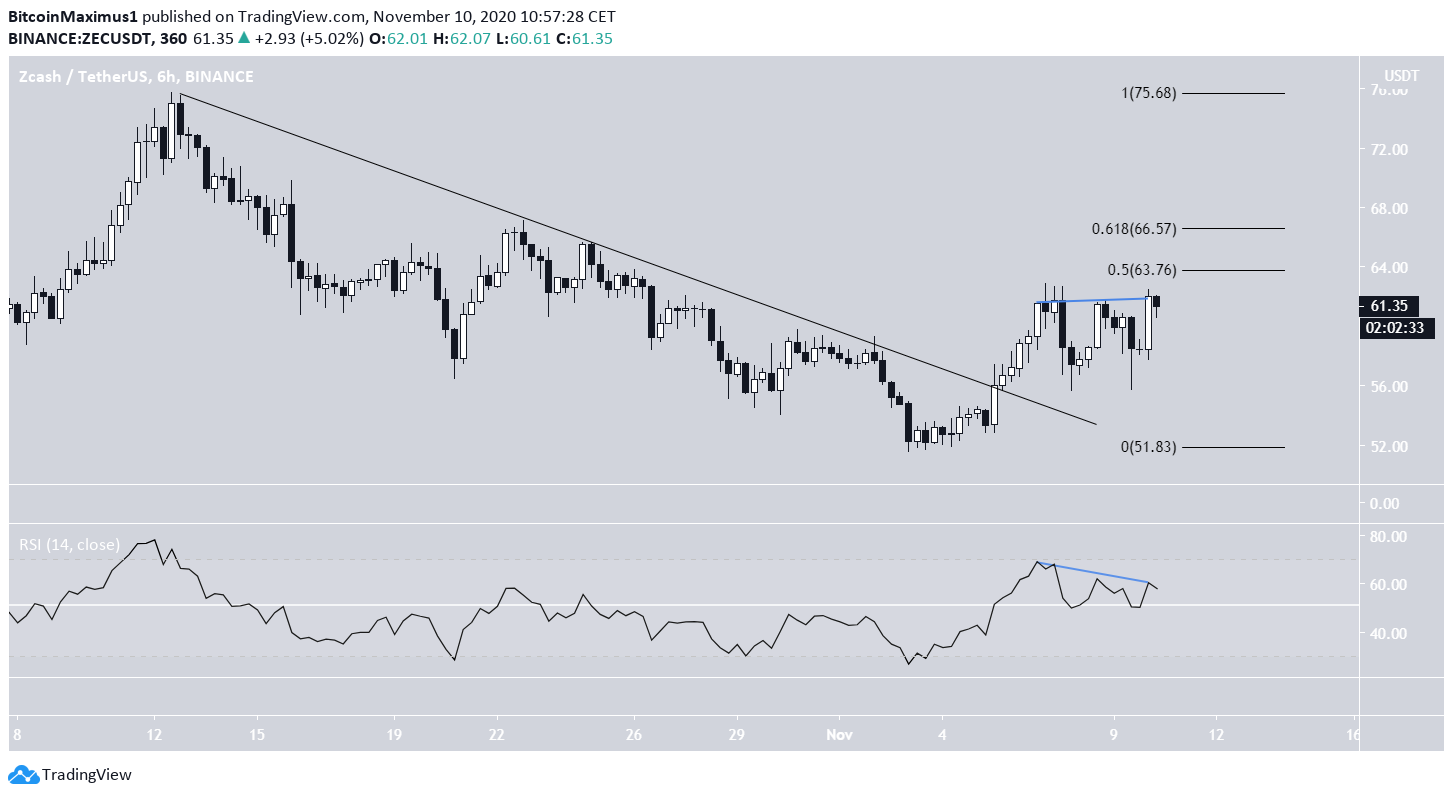
While the price has indeed broken out, it has not yet increased considerably from the breakout level.
In fact, the price has not yet cleared the 0.5 Fib level of the entire decrease. There is also a bearish divergence developing in the RSI, suggesting that the price might drop.
Unless ZEC is able to move above the 0.618 Fib level at $66.50 and validate it as support, the current increase is more likely to be corrective.
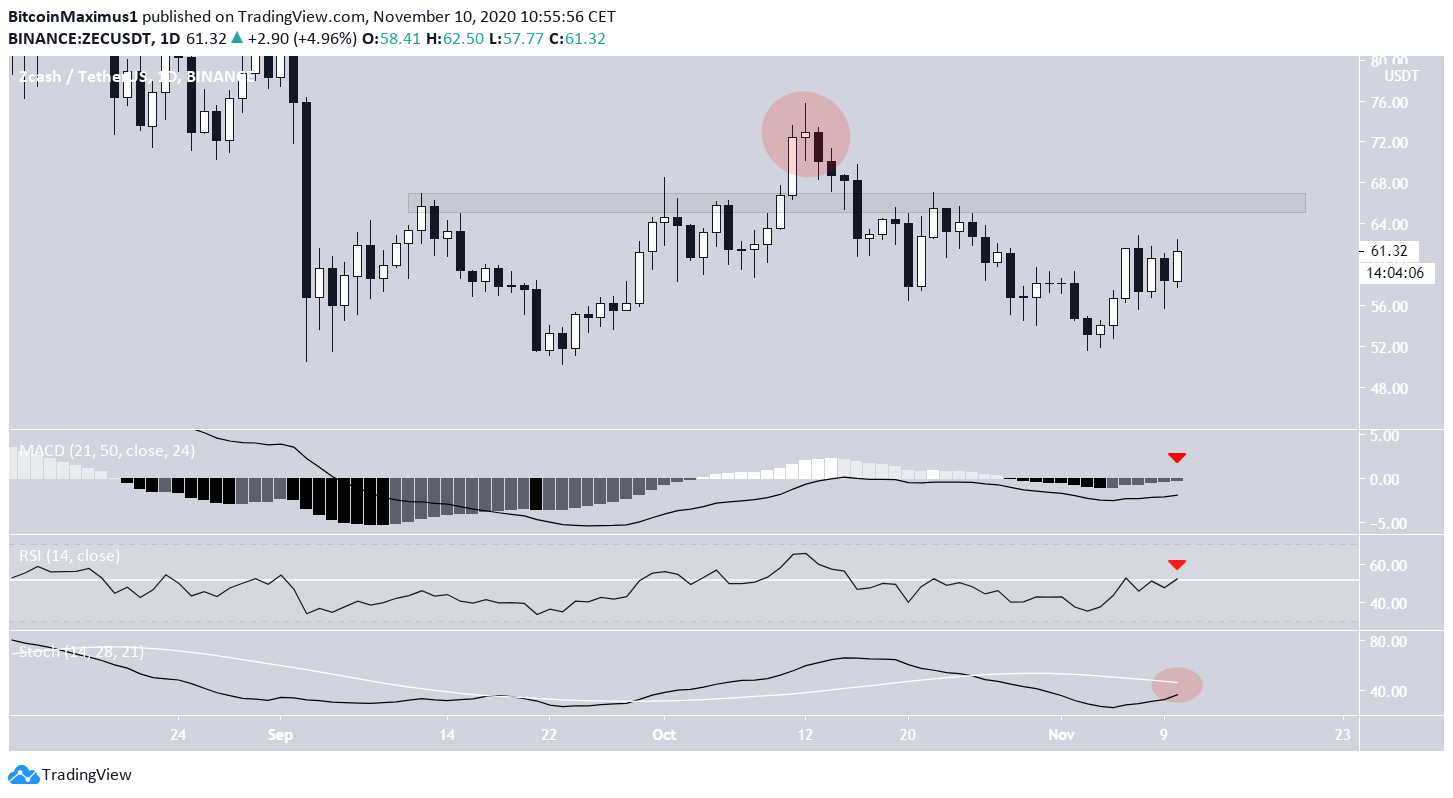
A look at the daily chart supports these findings. The main resistance area is found at $66.50, coinciding with the Fib resistance from the previous chart. The price deviated above this level on Oct 11 before falling right back below.
Despite the ongoing increase, technical indicators are still bearish. Therefore, unless the price is successful in sustaining an upward move above $66.50, the trend is also considered bearish.
Wave Count
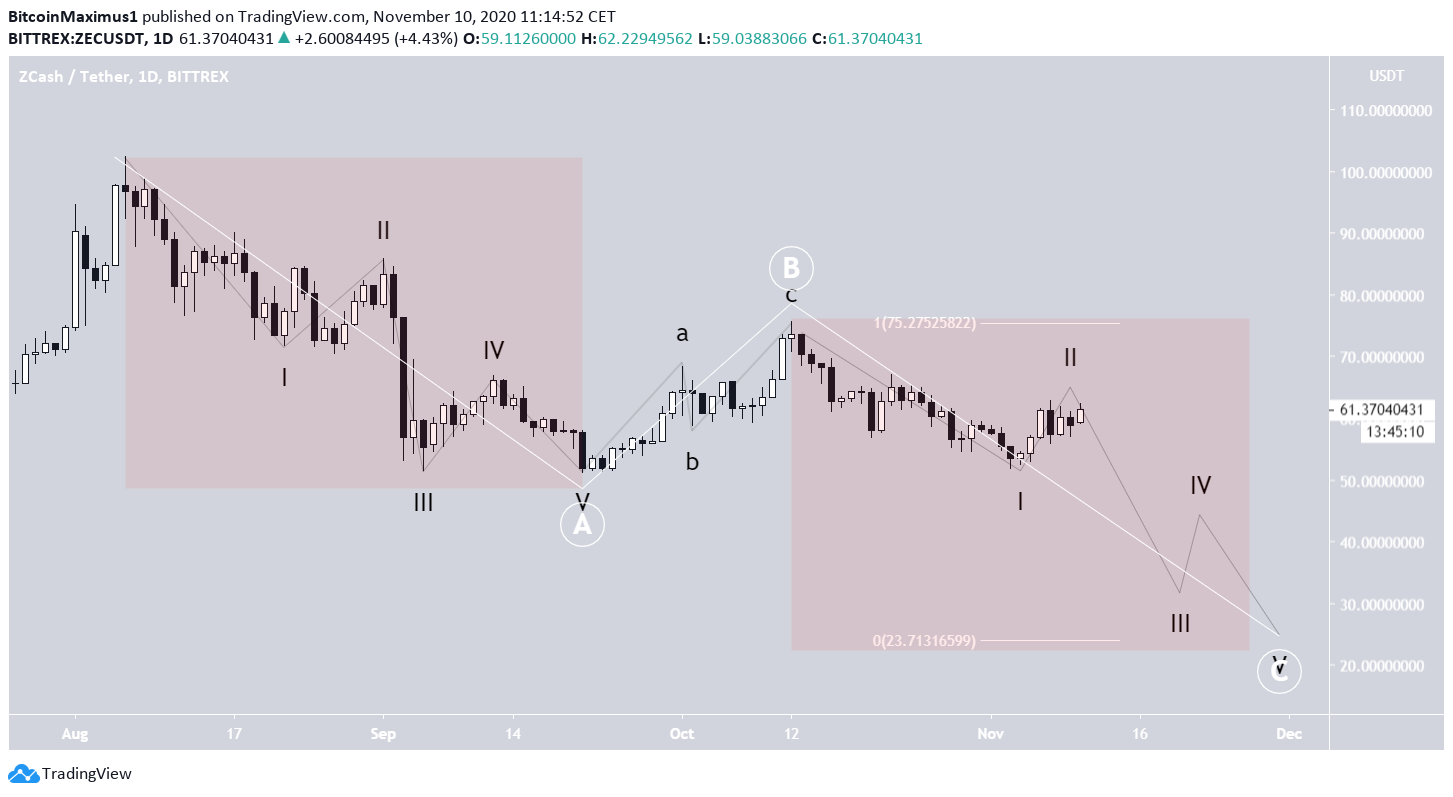
Beginning on Aug 6, it is likely that ZEC entered a corrective phase inside an A-B-C structure (shown in white below). If correct, the price is currently in the C wave, which is created by a bearish impulse (black).
A likely target for the decrease would be $23.71, found by projecting the length of wave A to C.
An increase above $76 would invalidate this particular wave count.
Conclusion
To conclude, the ZEC trend is likely still bearish and would be confirmed by a breakdown from the current long-term support area.
For BeInCrypto’s latest Bitcoin analysis, click here!
Disclaimer: Cryptocurrency trading carries a high level of risk and may not be suitable for all investors. The views expressed in this article do not reflect those of BeInCrypto.
The post Zcash (ZEC) Struggles to Break Out Above Horizontal Resistance Level appeared first on BeInCrypto.


![Decentraland: Review & Beginner's Guide [current_date format=Y] 31 Decentraland: Review & Beginner's Guide](https://cryptheory.org/wp-content/uploads/2020/11/decentraland-02-gID_7-300x150.jpg)