Zcash’s (ZEC) Long-Term Fractal Predicts a 100% Price Increase
2 min readThe Zcash (ZEC) price has moved above a long-term resistance level, and if the price acts in a similar manner to the last time it did so, it could rally by more than 100%.
Breakdown From Support
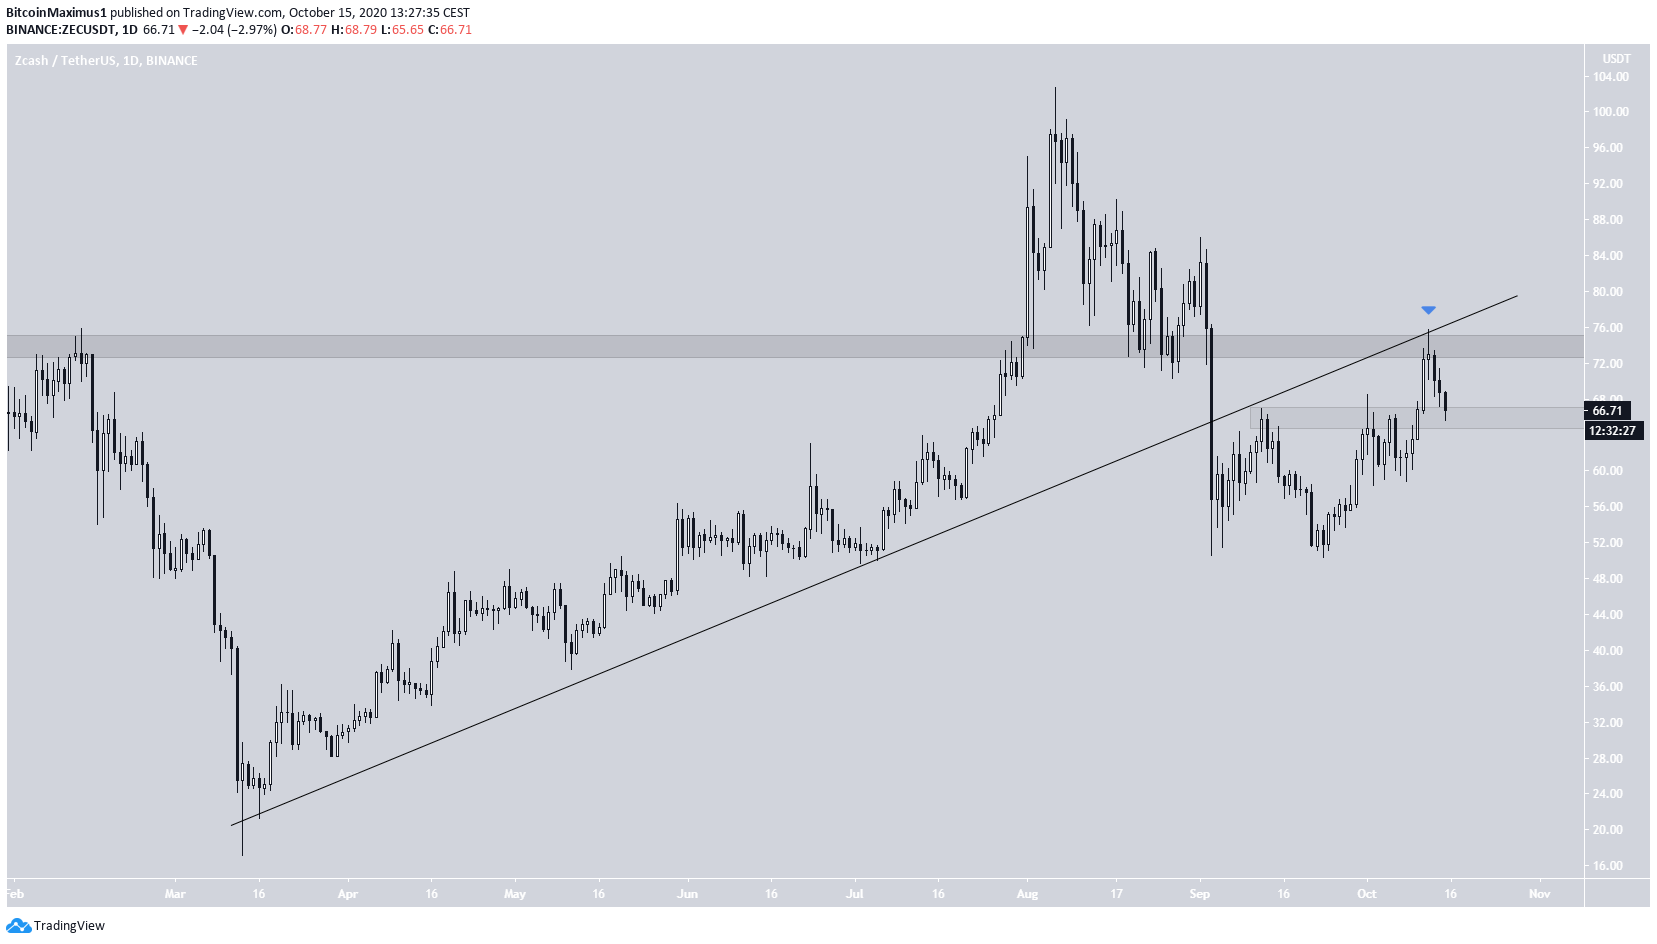
The ZEC price has been falling since Aug 6, when the price reached a high of $102.74. The decline continued until the price reached the $74 support area, bounced briefly but resumed downward afterwards.
On Sept 4, the price broke down from an ascending support line that had previously been in place since March 13. This was a major bearish development.
On Oct 12, the price validated the $74 area and the ascending support line it had broken down from as resistance. It has been declining since.
Currently, it is trading just above the minor support area at $66.
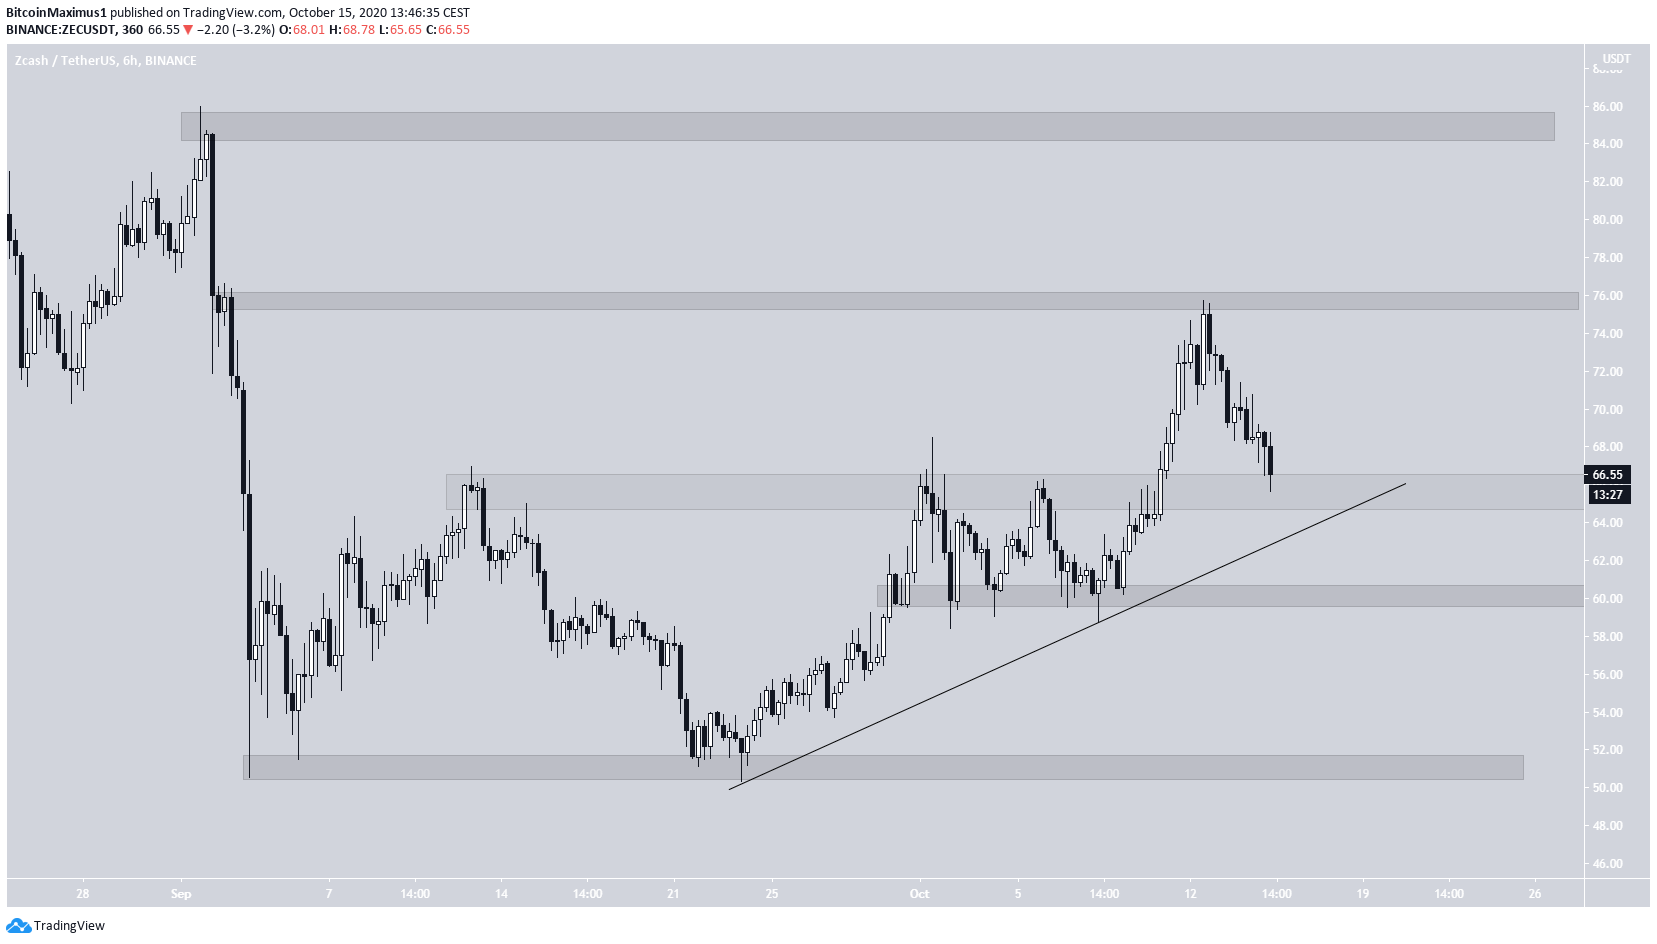
The shorter-term 6-hour chart shows that the price is following another ascending support line. Currently, it is in the process of re-testing it for the third time.
A breakdown from the support line and the $66 support area would likely cause a drop towards $60 and $51. If the price manages to hold on above, it could make another attempt at $74, and possibly $85.
Long-Term Similarity
Cryptocurrency trader @Pentosh1 outlined a ZEC chart, which shows that the previous time the price broke out from and validated the $64 area as support, it eventually doubled in value.
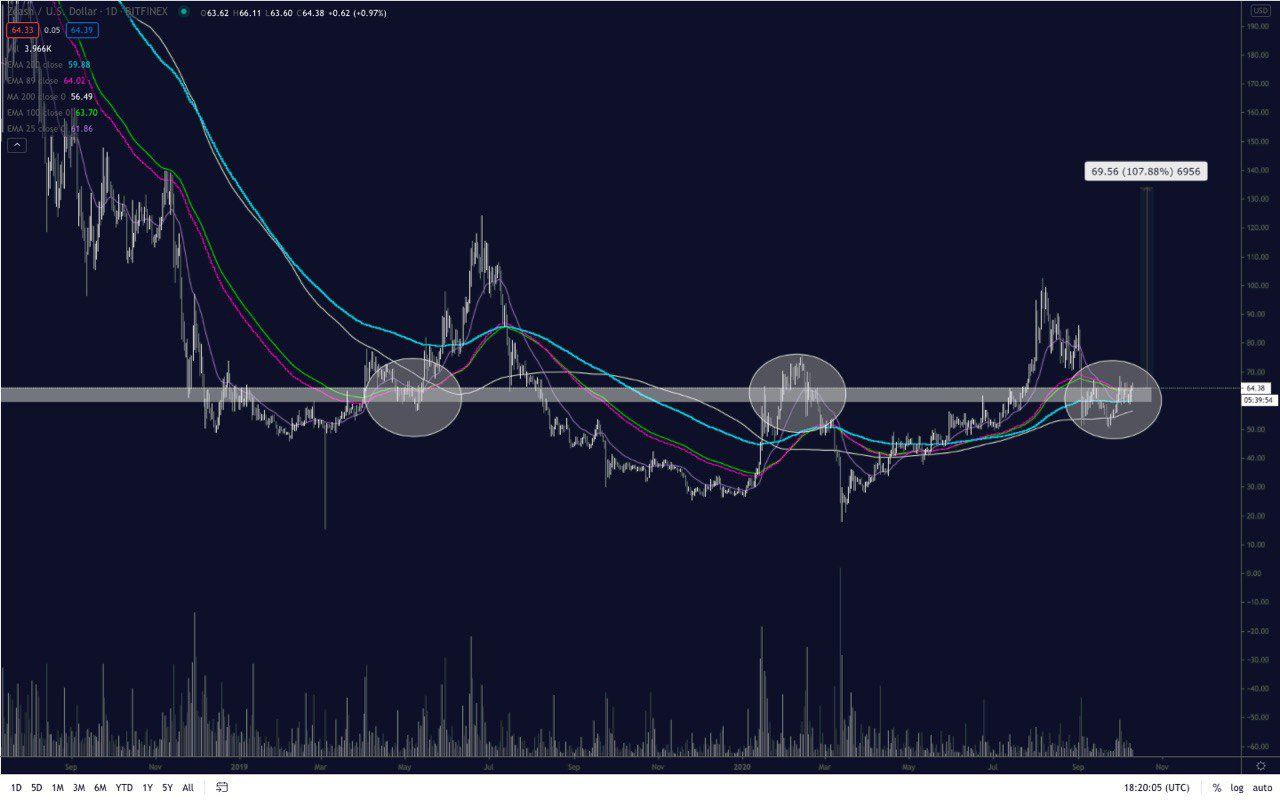
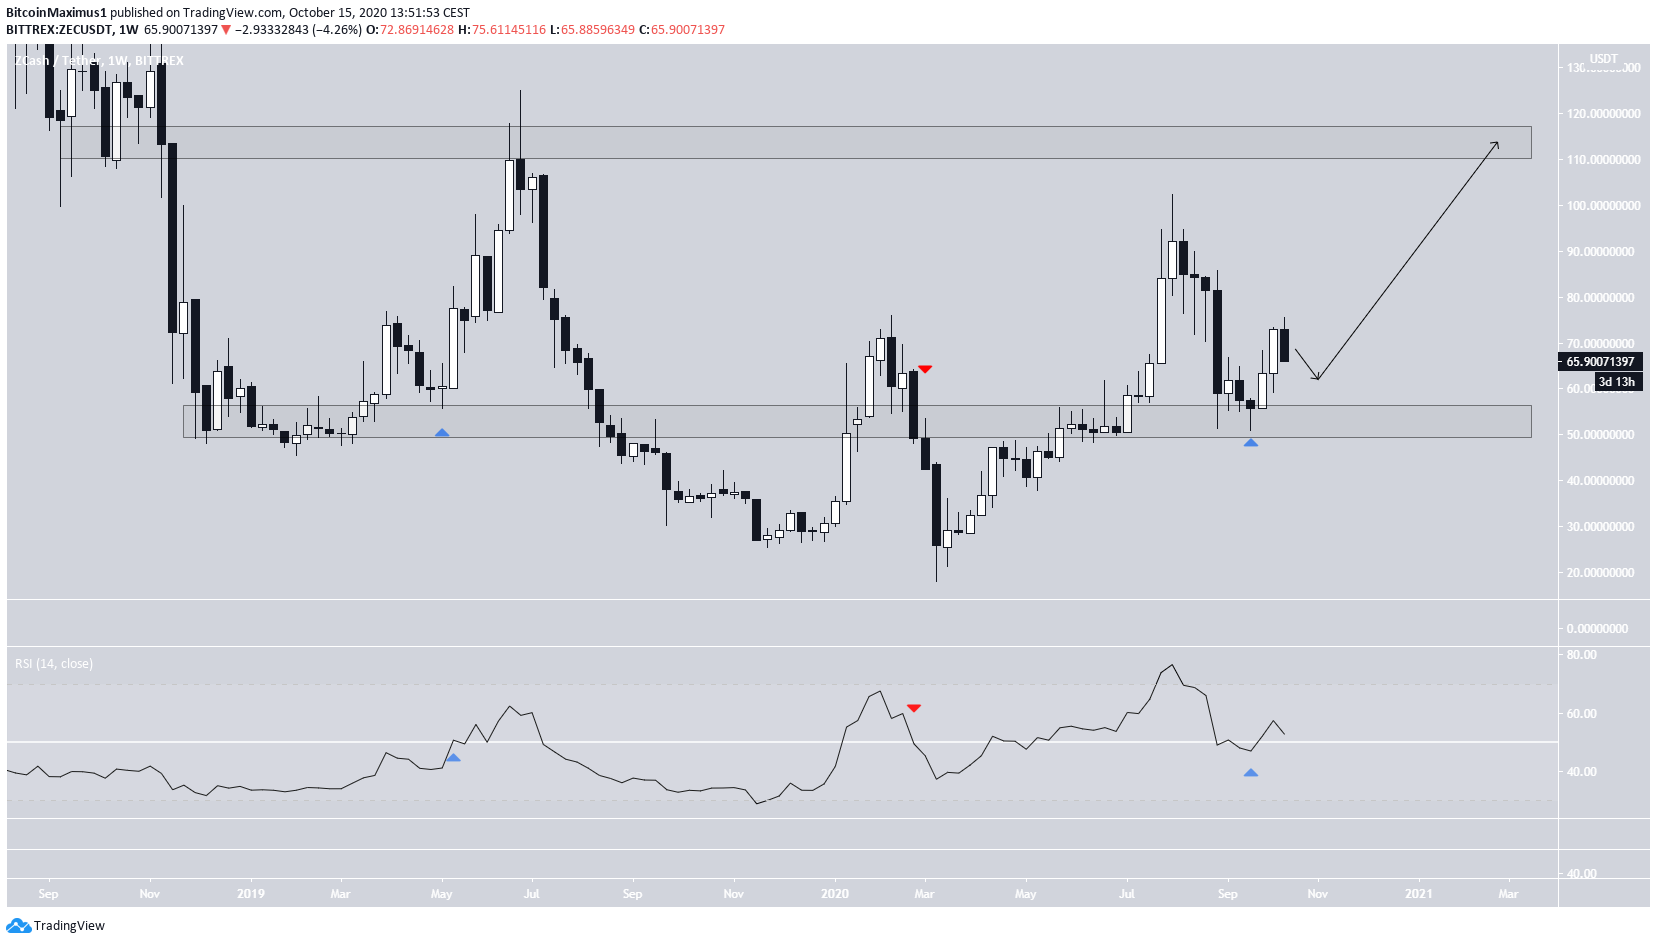
Since Nov 2018. the price has broken out three times from the $55 resistance area. On two of these occasions (shown with blue arrows below), it validated the area as support afterward and continued to move upwards.
The similarity is also supported by the weekly RSI since it validated the 50 line before moving upwards. On the other hand, in one breakout (red arrow), the support area failed to hold and the price broke down along with the RSI.
If the $55 area and the RSI hold, ZEC could rally all the way to $115.
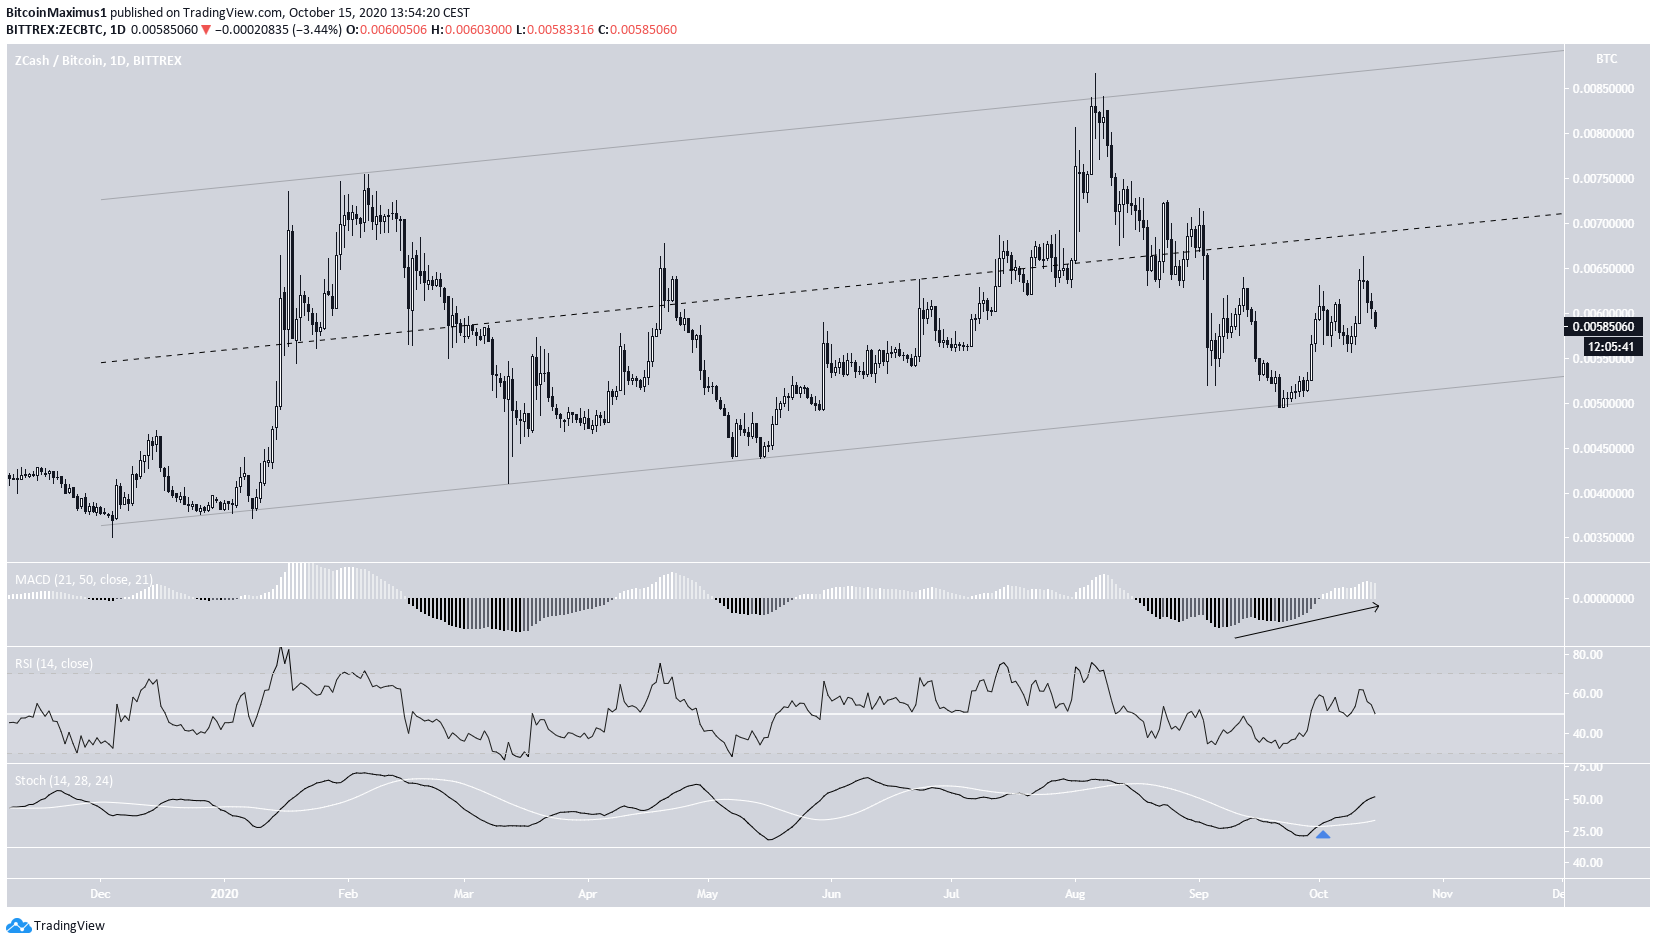
ZEC/BTC
The ZEC/BTC chart shows a differing movement relative to ZEC/USD.
The price has been trading inside a long-term ascending channel since Dec 2019. At the time of writing, it was trading in the lower portion of the channel, close to its ascending support line.
Technical indicators are bullish, suggesting that the price will increase at least towards the middle of the channel, and possibly move upwards towards the resistance line.
A rally in ZEC/USD towards $115 would likely cause the latter.
For BeInCrypto’s latest Bitcoin analysis, click here!
Disclaimer: Cryptocurrency trading carries a high level of risk and may not be suitable for all investors. The views expressed in this article do not reflect those of BeInCrypto.
The post Zcash’s (ZEC) Long-Term Fractal Predicts a 100% Price Increase appeared first on BeInCrypto.


![Decentraland: Review & Beginner's Guide [current_date format=Y] 32 Decentraland: Review & Beginner's Guide](https://cryptheory.org/wp-content/uploads/2020/11/decentraland-02-gID_7-300x150.jpg)