Table of Contents
Ah, Koma Inu—the new underdog in the meme coin arena, but instead of chasing its tail, it’s chasing the moon… or is it?

The Grand Drama: From Snooze to Skyrocket
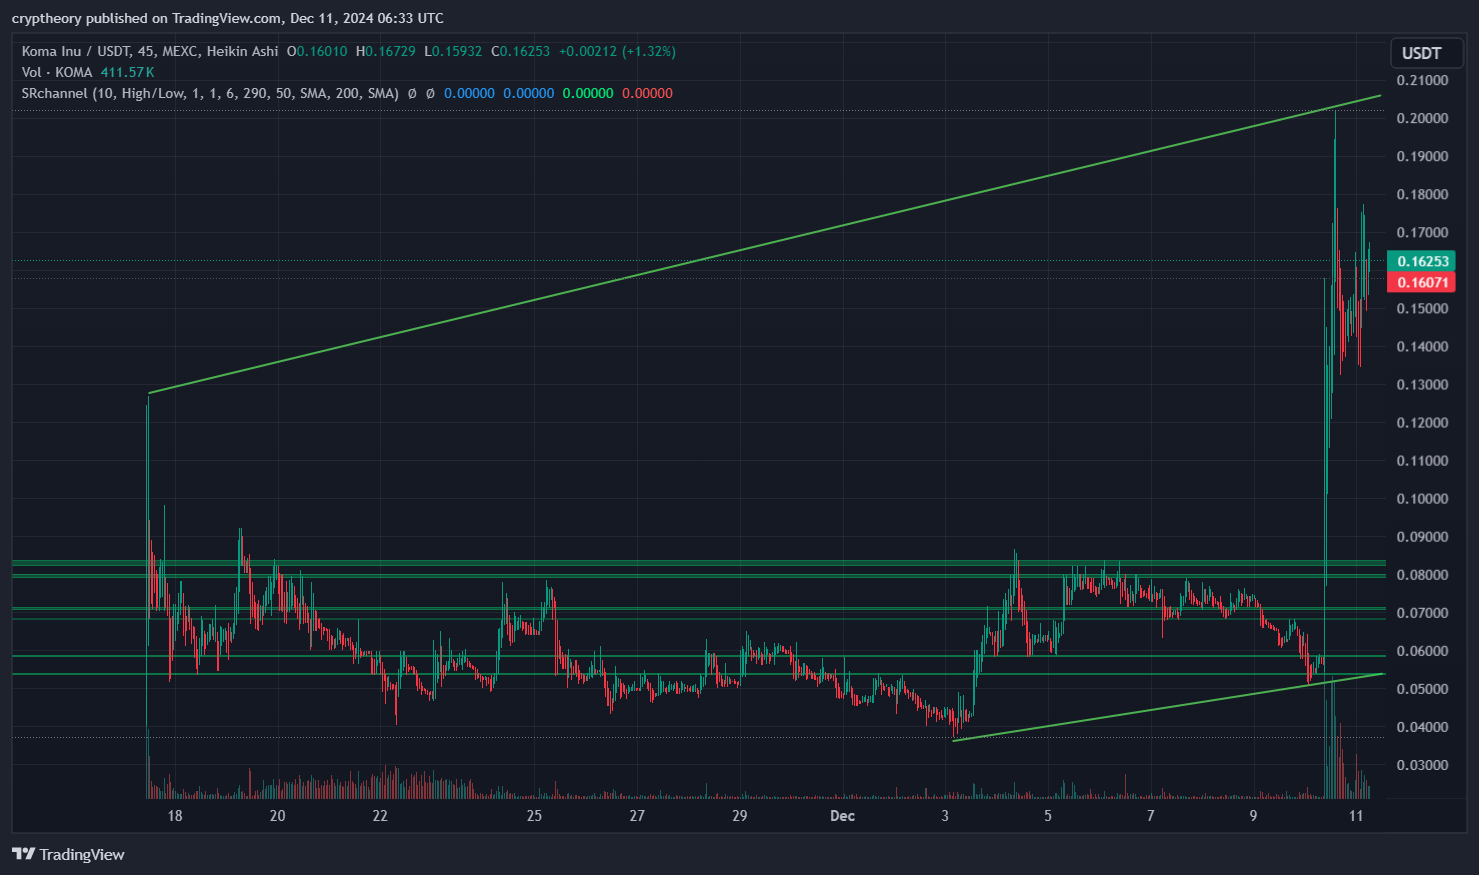
Looking at this chart is like watching a suspense movie with an unexpected plot twist. For weeks, Koma Inu was peacefully grazing in the $0.05 to $0.08 range, barely causing a ripple in the crypto pond. Traders probably thought, “Koma Inu? More like Coma Inu! Wake me up when it does something interesting.”
And then BAM! Koma Inu roared to life, going full beast mode. Breaking through resistance levels like they were made of paper, it skyrocketed to an eye-watering $0.21 before running out of breath faster than a meme coin hype on Twitter.
Resistance and Support Levels: A Comedy of Errors
- Key Resistance Levels:
- $0.17: This is where the price seems to be struggling now, as if it’s trying to leap but has tripped on its own paws.
- $0.21: The all-time high (ATH) for this chart is also a psychological ceiling—if Koma Inu breaks through this, it might head for Mars. If not, well… it might just curl up for a nap again.
- Support Levels:
- $0.12: The first solid support zone, acting as a safety net for those daredevil traders who bought the pump.
- $0.08 – $0.05: The danger zone. If Koma Inu falls back here, we’re talking about a complete reset of this glorious meme moment.
Volume Analysis: Bark Without Bite?
Volume during the pump was impressive—probably driven by both retail investors and some FOMO enthusiasts. However, the recent pullback shows a decrease in volume, like the crowd at a concert slowly leaving after the band stops playing.
Trendlines: The Climbing Meme
The ascending green trendline from the lows signals that Koma Inu has loyal HODLers who believe in its long-term potential—or maybe they’re just hoping for another wild pump to cash out. Either way, this upward trend is one to watch.
Short-Term Koma Inu (KOMA/USDT) Price Analysis

1. Symmetrical Triangle
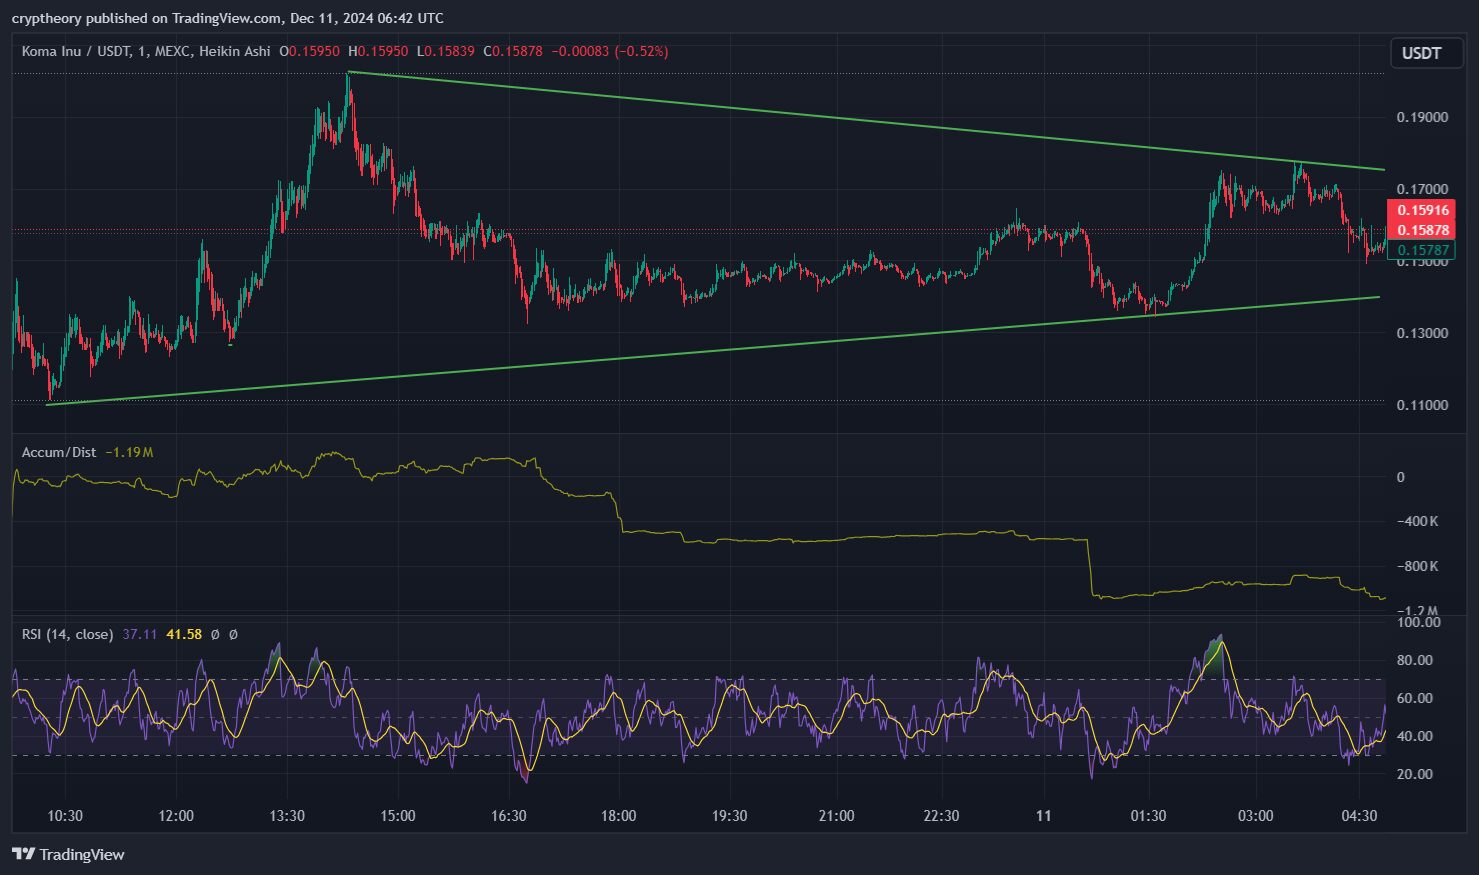
The chart forms a clear symmetrical triangle pattern, with converging trendlines representing lower highs and higher lows. This indicates a period of consolidation where the market is waiting to make its next big move. Traders should keep an eye out for a breakout, as it will likely determine the next direction.
- Upper Trendline: Sloping down from around $0.19 to the current $0.16 level.
- Lower Trendline: Sloping up from approximately $0.13 to $0.15.
A breakout above the upper trendline could signal bullish momentum, while a breakdown below the lower trendline may lead to further bearish pressure.
2. RSI (Relative Strength Index)
The RSI (14) is sitting at 37.11, indicating that the market is approaching oversold territory but hasn’t reached extreme levels yet. This suggests that sellers currently dominate the market, but the price could soon stabilize or reverse if RSI dips further and buyers step in.
- RSI-Based Moving Average: The RSI-based MA is at 41.58, slightly above the current RSI, which indicates bearish momentum. Traders might wait for the RSI to cross back above its moving average for confirmation of a reversal.
3. Accumulation/Distribution (A/D) Line
The Accumulation/Distribution Line is trending downward, sitting at approximately -1.19M, signaling that distribution is outweighing accumulation in the short term. This reflects that selling pressure has been dominant during this consolidation phase, but it is flattening out, which may indicate that selling is slowing down.
Key Levels to Watch
- Resistance Levels:
- $0.16 (current symmetrical triangle upper boundary)
- $0.17 (short-term resistance from the recent highs)
- Support Levels:
- $0.15 (symmetrical triangle lower boundary)
- $0.13 (major support if the triangle breaks downward)
Strategy Insight
- For Bulls: Watch for an RSI crossover above its moving average, combined with a breakout above the symmetrical triangle’s upper boundary. This could signal renewed bullish momentum with potential targets around $0.17–$0.19.
- For Bears: A breakdown below the triangle’s lower boundary, supported by continued downward movement in the A/D line, could present short opportunities with targets near $0.13.
Conclusion
The short-term trend is undecided, with the symmetrical triangle offering a critical inflection point. Momentum indicators like RSI and A/D suggest a bias toward bearishness, but a strong breakout could flip the narrative quickly. Keep those stop losses tight, as meme coins are known for their volatility!
What’s Next for Koma Inu?
Bullish Scenario:
If the current support at $0.16 holds and volume picks up, Koma Inu could gear up for another rocket launch to retest $0.21 or even set new highs. It all depends on whether the meme coin gods bless it with another viral moment.
Bearish Scenario:
If support crumbles and the hype fades, Koma Inu could tumble back to its old stomping grounds in the $0.05 to $0.08 range, where it would probably sulk and wait for a new wave of memes to resurrect it.
Summary
Koma Inu’s chart feels like a wild meme party that got out of hand. One moment it’s chilling in the corner, and the next it’s flipping tables, yelling, “TO THE MOON!” Whether this coin is the next Shiba Inu or just a fleeting fad, one thing’s for sure: it’s entertaining to watch.
For now, remember the golden rule of meme coins: “Only bet what you’re willing to lose, because meme coins don’t sleep—they nap.”
- Koma Inu (KOMA) Price Analysis: 11/12/2024 - December 11, 2024
- How Many Computers and What Power Would Be Needed to Compromise the Bitcoin Network? A Guide to the Crypto-Apocalypse 🚀💻 - December 10, 2024
- Bitcoin Price Predictions for December 2024 and Year 2025 – The King of Crypto on a Roller Coaster Ride - December 6, 2024


