Table of Contents
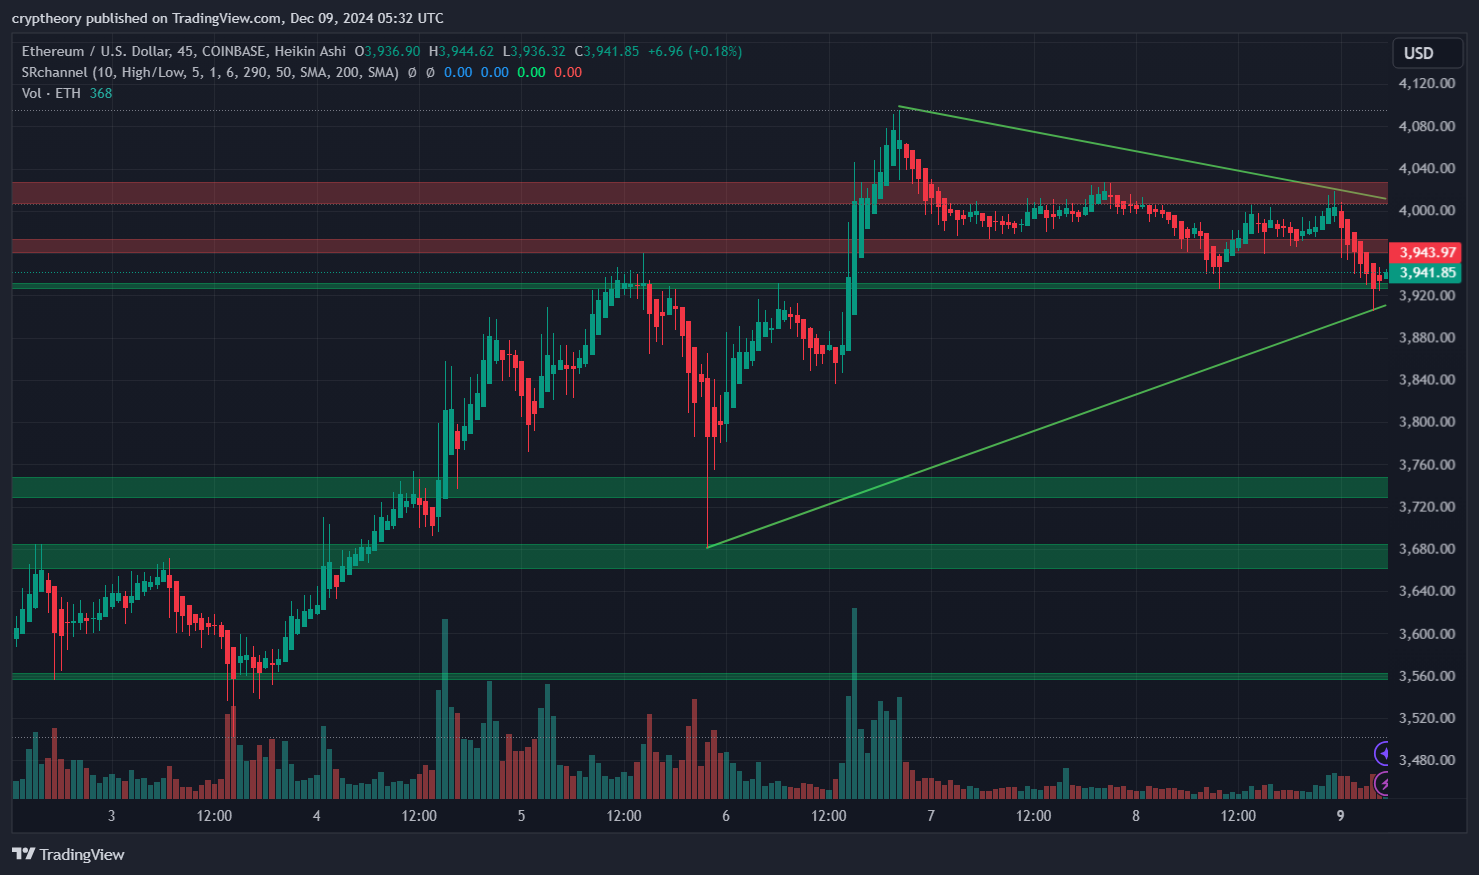
Welcome, fellow Ethereum enthusiasts, to another thrilling episode of “Will ETH Breakout or Break Down?” Our beloved Ethereum is currently sitting at $3,941.85, contemplating its next big move inside a classic symmetrical triangle. This chart is practically dripping with tension—it’s like a blockbuster thriller, and we’re all on the edge of our trading seats. Let’s dive in!

Price Action Overview
Ethereum has been bouncing between support and resistance like a caffeinated ping-pong ball. After hitting a high of $4,040, ETH decided to take a breather, retreating slightly and now consolidating around $3,940. The symmetrical triangle pattern suggests we’re on the brink of a big move, but whether it’s up or down remains to be seen.
Key Levels to Watch
Support Levels:
- $3,920: ETH is currently testing this level, which aligns with the lower trendline of the triangle. Think of it as Ethereum’s safety net—it better not break.
- $3,840: The next line of defense, where Ethereum bulls have historically regrouped for counterattacks.
- $3,720: The ultimate last stand before things get messy. Break below this, and we could be revisiting the depths of $3,600 or worse.
Resistance Levels:
- $4,000: The immediate hurdle for Ethereum. It’s like that friend who won’t let you cut in line—ETH has been trying to break through this level but keeps getting rejected.
- $4,040: The recent high and top of the triangle. A clean breakout here would be a signal for ETH to resume its bull run.
- $4,120: The next logical target after a breakout, potentially setting the stage for a moonshot.
Volume: The Plot Thickens
Volume has been declining as ETH consolidates inside the triangle—a textbook setup for an impending breakout. The trading activity is like a coiled spring waiting to explode, but for now, it’s eerily quiet. Keep an eye out for a volume spike to confirm the direction of the next move.
Trend Analysis: Symmetrical Triangle Drama
The symmetrical triangle pattern is as neutral as Switzerland—it could break out in either direction. On the bullish side, ETH has been forming higher lows, which suggests that buyers are still showing up. On the bearish side, lower highs indicate that sellers are putting up a good fight.
Indicators: ETH’s Crystal Ball
- Simple Moving Averages (SMA 50 & SMA 200):
- ETH is trading comfortably above both the 50 and 200 SMAs, which is a bullish sign. The 50 SMA is acting as dynamic support.
- Momentum:
- Momentum is waning slightly, but the triangle breakout should reinvigorate movement in either direction.

Relative Strength Index (RSI)
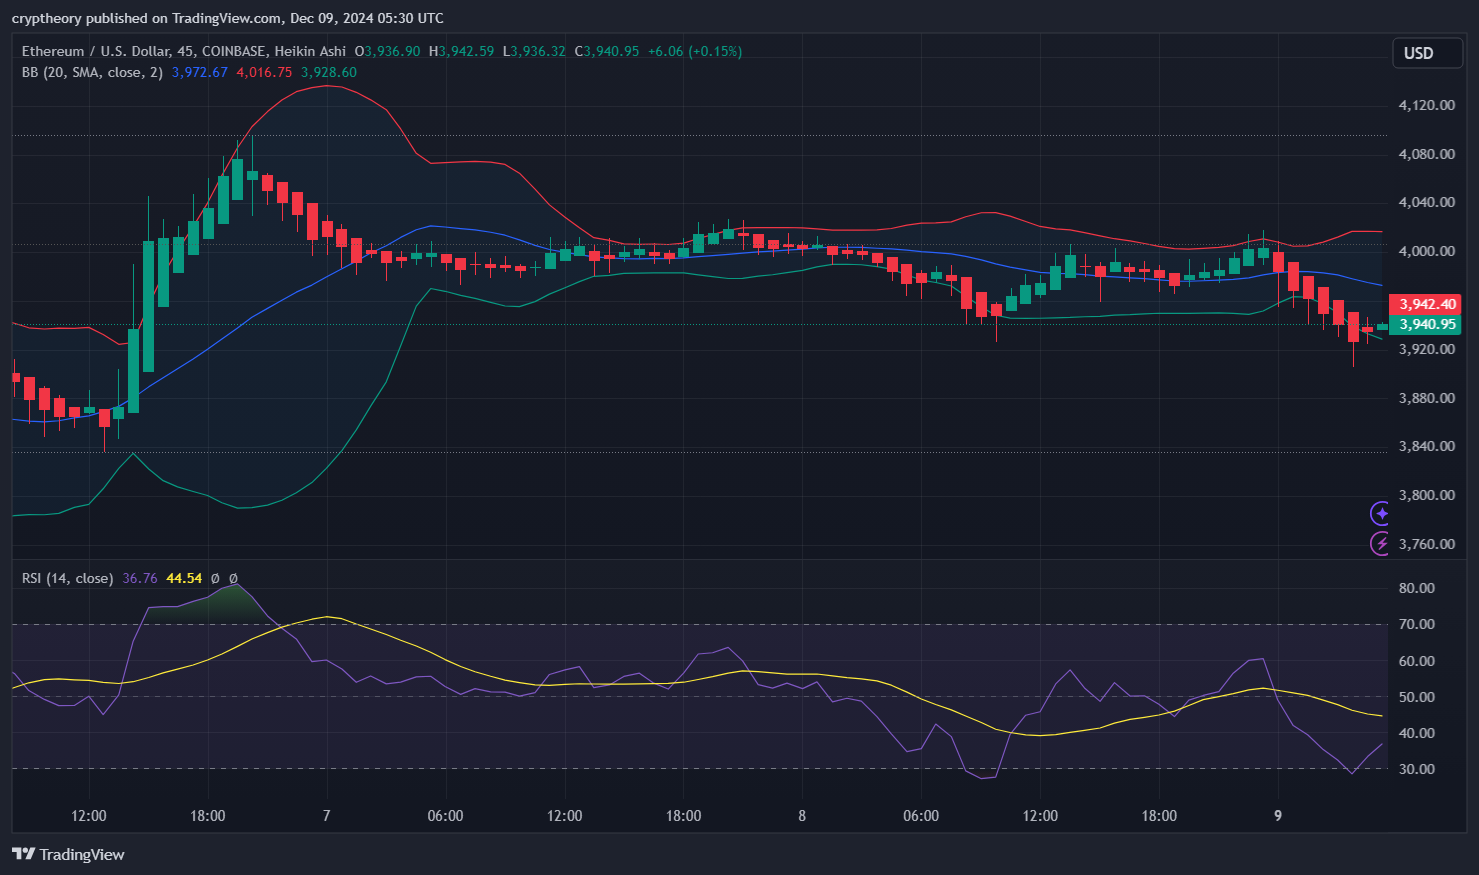
- RSI Value: The RSI (14) is currently at 36.76, indicating that Ethereum is approaching oversold territory. This suggests that bearish momentum is dominant but could slow down soon.
- RSI-Based Moving Average (MA): The RSI-based MA is 44.54, which is above the RSI value, highlighting a bearish trend continuation as the RSI lags behind its moving average.
Bollinger Bands
- Upper Band: Approximately $4,016.75.
- Middle Band (SMA 20): Approximately $3,972.67.
- Lower Band: Approximately $3,928.60.
- Observation: The price is moving closer to the lower Bollinger Band, indicating increased bearish pressure. This suggests a potential bounce from the lower band if selling pressure subsides or continues breakdown below this level if the bearish trend strengthens.
These indicators highlight that Ethereum is in a short-term bearish phase but nearing critical support levels that could provoke a reaction from buyers. Watch for a rebound near the lower Bollinger Band or further downward movement if RSI dives deeper into oversold territory.
Scenarios: Choose Your Own Adventure
Bullish Scenario:
If ETH breaks above $4,040, expect a quick rally to $4,120, with the possibility of testing $4,200 and beyond. A breakout from the triangle could spark a new wave of bullish enthusiasm, targeting $4,500 in the longer term.
Bearish Scenario:
If ETH loses the $3,920 support level, it could fall to $3,840 or even $3,720. A breakdown below the triangle would open the door to a deeper correction, potentially taking ETH to $3,600 or lower.
The Verdict
Ethereum is at a crossroads, caught in the gravitational pull of its symmetrical triangle. The next 24–48 hours will likely determine the direction of the breakout. Traders should watch for a decisive move above $4,040 or below $3,920 before placing their bets.
In the meantime, grab your popcorn and enjoy the show—Ethereum is about to give us the plot twist we’ve all been waiting for. Will it soar to new heights, or will the bears drag it back to the depths? Stay tuned, and may the trend be ever in your favor! 🐂🐻📈
- Bitcoin Price Analysis – 12/12/2024: A Tale of a Triangle Showdown - December 12, 2024
- Goatseus Maximus Price Analysis – December 11, 2024: The Mighty Goat’s Comeback - December 11, 2024
- Sui Price Analysis – December 10, 2024: The Rollercoaster Saga - December 10, 2024


