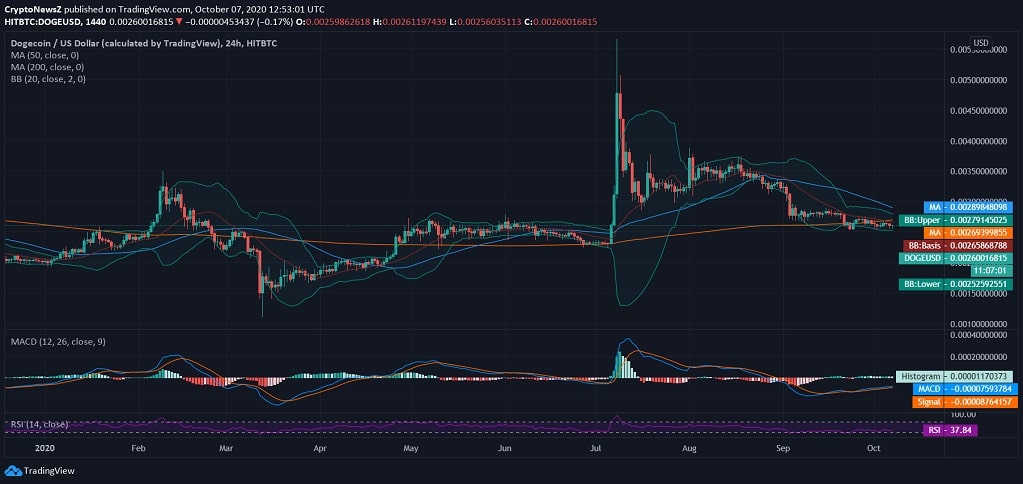

Dogecoin, at the time of writing this analysis was seen trading at $0.002600 and just like any other altcoin including the largest cryptocurrency of the market—Bitcoin, Dogecoin appears to be no exception. Compared to the YTD high marked above $0.005500, DOGE/USD appears bearish at the time of writing and with a negative pull back below $0.0030, it is trading with no active support from daily MAs.
Dogecoin is believed to have a concurrent motion to that of Bitcoin and just as Bitcoin consolidates below $11k, DOGE serves no potential to have a bullish crossover whatsoever.
Dogecoin Price Analysis:

Dogecoin at the time of penning down was seen breaching the lower 20-day Bollinger Band and held no support from 50-day and 200-day daily MA on the daily chart. With a volatile movement recorded for major altcoins of the market, DOGE is expected to have a breakout soon as per the squeezing of 20-day Bollinger Bands. Moreover, with a negative accumulation in the intraday, the price trend is seen breaching the lower 20-day Bollinger Band.
However, the MACD draws a slight bullish crossover on the same daily chart due to intraday price appreciation against the greenback. However, the positive breakthrough of the price on the daily chart is not strong enough to regain the lost support and therefore the RSI of the coin remains inclined towards the support area at 37.84.
- Michaël van de Poppe: Bitcoin to Hit $500,000 This Cycle? 🚀💸 Or Just Another Crypto Fairy Tale? - December 21, 2024
- What is the Meme Coin Bonk, Price Predictions 2025–2030, and Why Invest in BONK? - December 18, 2024
- BNB Price Analysis: 17/12/2024 – To the Moon or Stuck on a Layover? - December 17, 2024


