Table of Contents
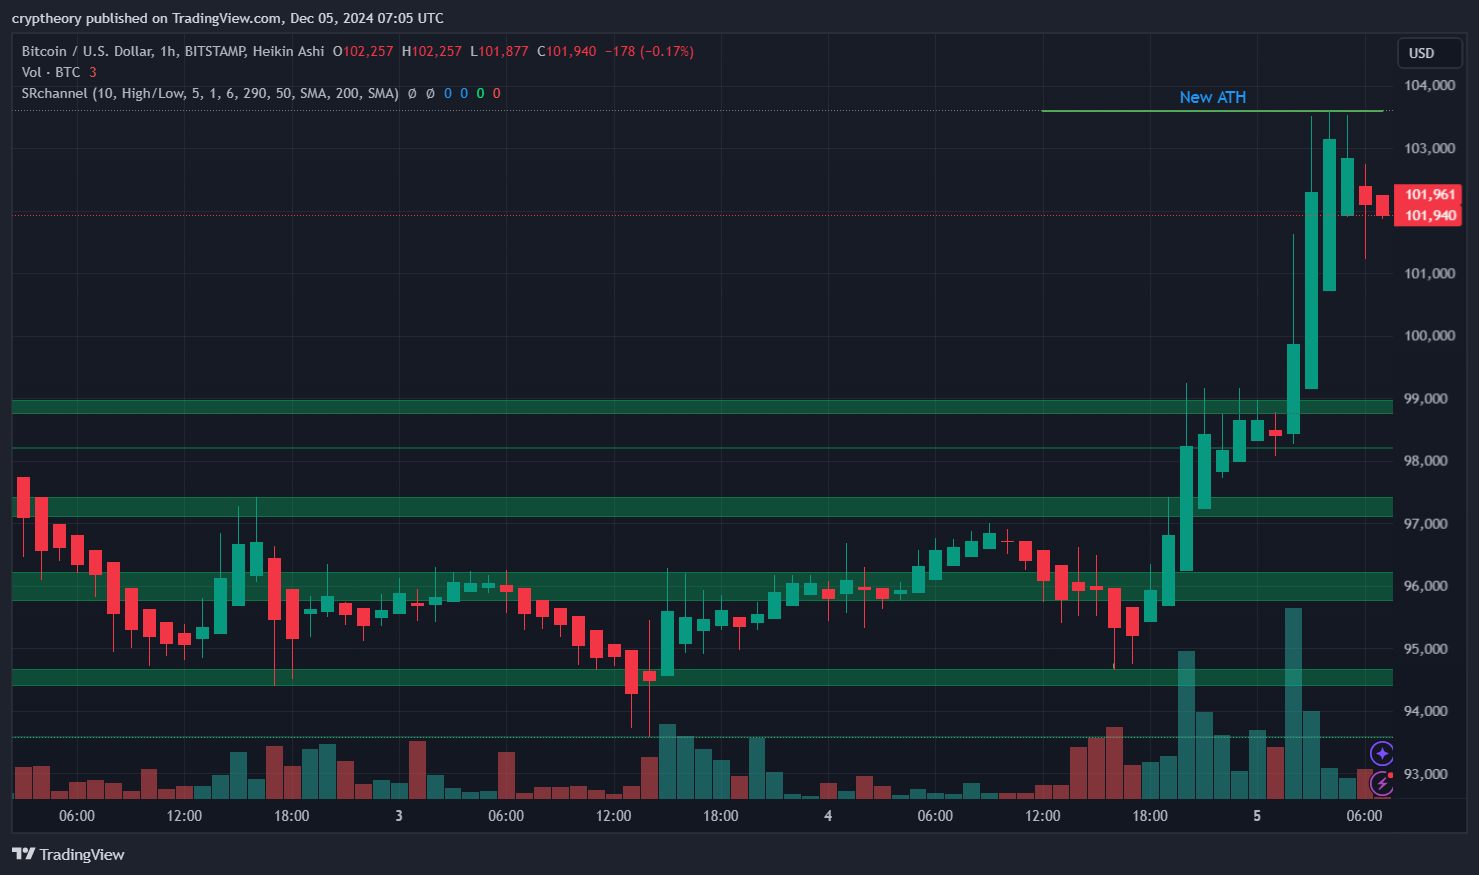
Bitcoin, the ever-dramatic king of cryptocurrencies, has been doing what it does best: keeping traders on their toes! As of the latest candle, BTC is trading around $101,940, down a modest 0.17%—a dip so small it’s like spilling a single drop of coffee on your white shirt. The journey to this point, however, has been nothing short of an epic tale.

Key Levels and Insights
- Support Levels:
- BTC has been bouncing like a hyperactive squirrel between $95,000 and $98,000. The buyers here are clearly saying, “No, you’re not going any lower than this, sir.”
- A strong support zone sits at $96,000, and based on the volume spikes, it looks like traders have been storming in with buy orders like it’s Black Friday.
- Resistance Levels:
- The mighty $103,000—or as the chart humorously marks, a “New ATH”—is where Bitcoin decided to catch its breath. Imagine Bitcoin at the top of a hill, hands on its knees, saying, “Phew, that was a climb!”
- Trend Analysis:
- The 1-hour Heikin Ashi candles are giving us clean, green bullish vibes post the December 4th evening breakout, which catapulted BTC above the $100,000 psychological level.
- Before the breakout, Bitcoin spent several hours loitering in a sideways trend, much like a bored teenager hanging around a shopping mall.
- Volume Surge:
- The breakout was accompanied by a huge spike in volume—think of it as the crypto equivalent of fans rushing the field after a game-winning touchdown. This suggests strong buyer momentum, but we’re seeing the first signs of cooling off near $101,940.
What’s Happening Now?
Bitcoin has now dipped slightly below its recent high, consolidating around $101,900. It’s like it’s saying, “Let me catch my breath before I decide whether to moon or make you cry.”
The Big Picture
🚦 Possible Scenarios 🚦
- Bullish Breakout:
If Bitcoin punches through $103,000, it’s game on! The next target? Likely around $105,000, followed by the ambitious $110,000 zone. At this point, we might see Bitcoin memes flood social media once again. - Bearish Pullback:
Should BTC lose momentum here, expect it to revisit the $98,000–$99,000 support zone. This wouldn’t necessarily mean the bull run is over—just that Bitcoin is taking a nap before its next sprint.

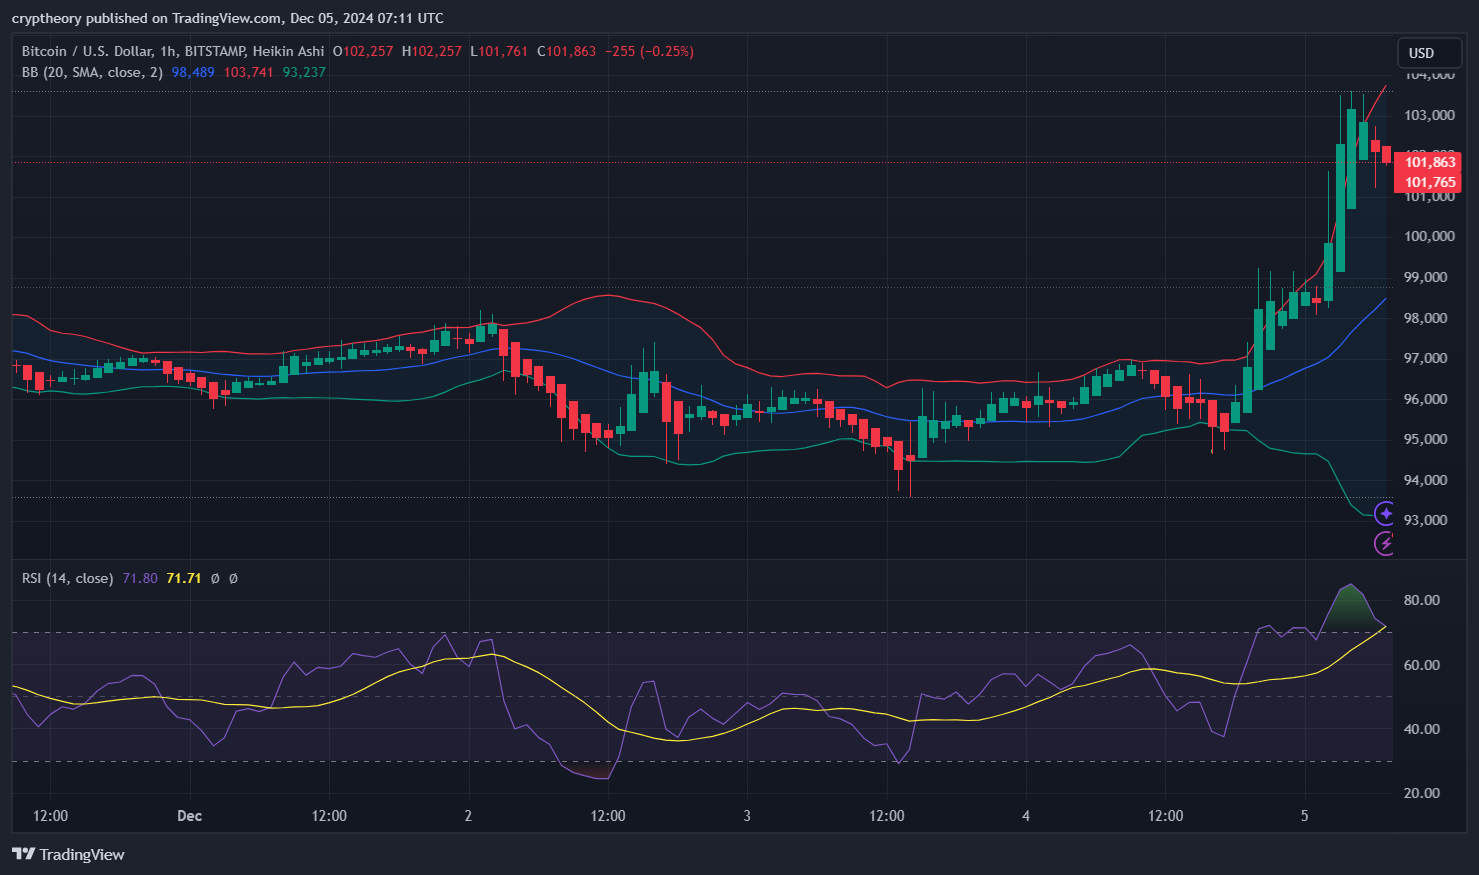
Let’s analyze the RSI (Relative Strength Index), the RSI-based Moving Average (MA), and Bollinger Bands as shown in the chart.
RSI Analysis
- RSI Value: The RSI is currently sitting at 71.80, which places it slightly into the overbought territory (above 70). This suggests that Bitcoin might be overextended in its recent rally and could see a potential pullback or consolidation.
- RSI-Based MA: The yellow moving average line on the RSI (often a smoothed version of RSI) is trending slightly lower than the RSI value, near 71.71. This indicates that the recent surge in RSI was rapid, and the moving average is still catching up.
Bollinger Bands Analysis
- Upper Band: The upper Bollinger Band is positioned at 103,741, which aligns closely with Bitcoin’s recent peak and acts as resistance. This suggests that BTC is pushing the limits of its upward movement.
- Middle Band (SMA): The middle Bollinger Band, a 20-period SMA, is located at 98,489. This acts as a dynamic support level and could be a key area for price retracement if Bitcoin cools down.
- Lower Band: The lower Bollinger Band is resting at 93,237, a significant distance from the current price. If Bitcoin experiences a sharp sell-off, this would be the ultimate support zone based on volatility.
Key Takeaways
- RSI Implications: The RSI’s position near 72 warns of a potential short-term correction. However, the overall trend remains bullish unless RSI drops significantly below 50.
- Bollinger Bands Implications: The price is hugging the upper band, indicating strong bullish momentum but also a potential for overextension. Consolidation or a slight pullback toward the middle band ($98,489) is likely in the short term.
- Trend Strength: The price trading above the Bollinger Bands’ middle line indicates that the uptrend is still intact, with significant buying pressure.
Would you like a tailored trading plan or advanced backtesting for RSI and Bollinger Bands in this scenario? 🚀
The Humor in All This
- Bitcoin hitting new highs? Everyone is suddenly a genius on Twitter.
- Bitcoin consolidating? Analysts be like, “It’s a healthy retracement, trust me.”
- Bitcoin dips to $96,000? You’ll hear cries of, “Bear market confirmed!”
Summary
Bitcoin’s price action right now is like a Hollywood action movie: thrilling, dramatic, and filled with plot twists. With key support around $98,000 and resistance at $103,000, BTC could either explode higher or pull back slightly for some consolidation. Either way, strap in—because Bitcoin isn’t about to get boring anytime soon!
Would you like a detailed trading strategy or some advanced TA metrics based on this chart? 🚀
- Chainlink Price Analysis – January 9, 2025: The Struggle for $20 and Beyond! - January 9, 2025
- 📊 Kekius Maximus Price Analysis – January 7, 2025 🎭 - January 7, 2025
- 🚀 TON Price Prediction – January 6, 2025 📊🤖 - January 6, 2025


