Table of Contents
Ladies and gentlemen, grab your popcorn because Sui price chart looks like the blueprint for a theme park ride! With breathtaking climbs, terrifying drops, and a few loops of consolidation, Sui has been the drama king of the crypto world this past week. Let’s break down what this wild chart has to tell us about Sui’s current state and where it might be heading next.

Price Action Overview
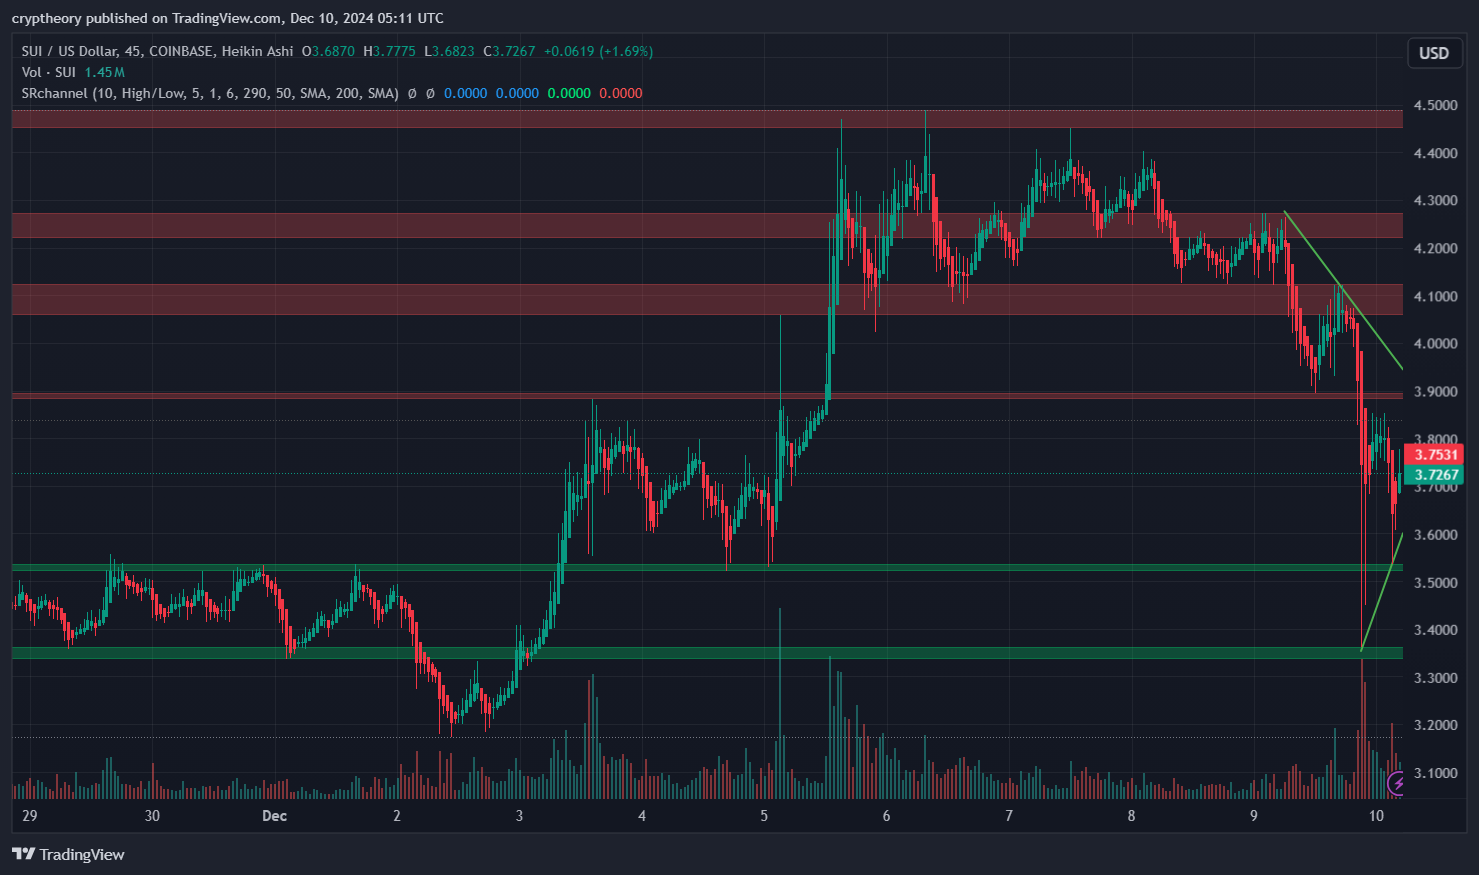
Sui is currently trading at $3.7267, up 1.69% in the past session, clawing its way back from a recent sharp plunge. It’s like watching someone trip on a staircase, tumble three floors down, and then stand up pretending nothing happened. After a stellar run to $4.50, Sui got slapped by the resistance zone and is now trying to find its footing.
Key Levels to Watch
Resistance Levels:
- $4.10 – $4.50: This red zone is where Sui hit its head and got knocked back down. It’s the ultimate ceiling for now, acting like a fortress guarded by bears. Breaking above this range would be a monumental win for the bulls.
- $3.90: The first hurdle Sui needs to clear on its comeback trail. A move above this would signal some serious momentum.
Support Levels:
- $3.50 – $3.60: The green safety net that caught Sui during its free fall. If this zone holds, it could be the springboard for another rally.
- $3.20: The “do-not-go-below-this” level. Falling here would send Sui back to the crypto basement, undoing all recent gains.
Trend Analysis: A Slippery Slope
Sui is stuck in a downward-sloping trendline, acting like a slide at a playground—fun for the bears, not so much for the bulls. However, there’s a glimmer of hope: the sharp recovery off the $3.50 support indicates buyers aren’t giving up just yet.
Volume: A Whisper After the Roar
The recent sell-off came with a burst of volume, suggesting panic selling. However, the recovery lacks the same enthusiasm, with volume tapering off. This could mean traders are either waiting for confirmation of a breakout or licking their wounds in silence.
Momentum Indicators:
- Bulls vs. Bears: The bears have had the upper hand recently, but the quick bounce from $3.50 shows the bulls still have some fight left in them.
- Consolidation Zones: Sui is now consolidating near the mid-$3.70 range, indicating a temporary ceasefire between buyers and sellers.

Relative Strength Index (RSI)
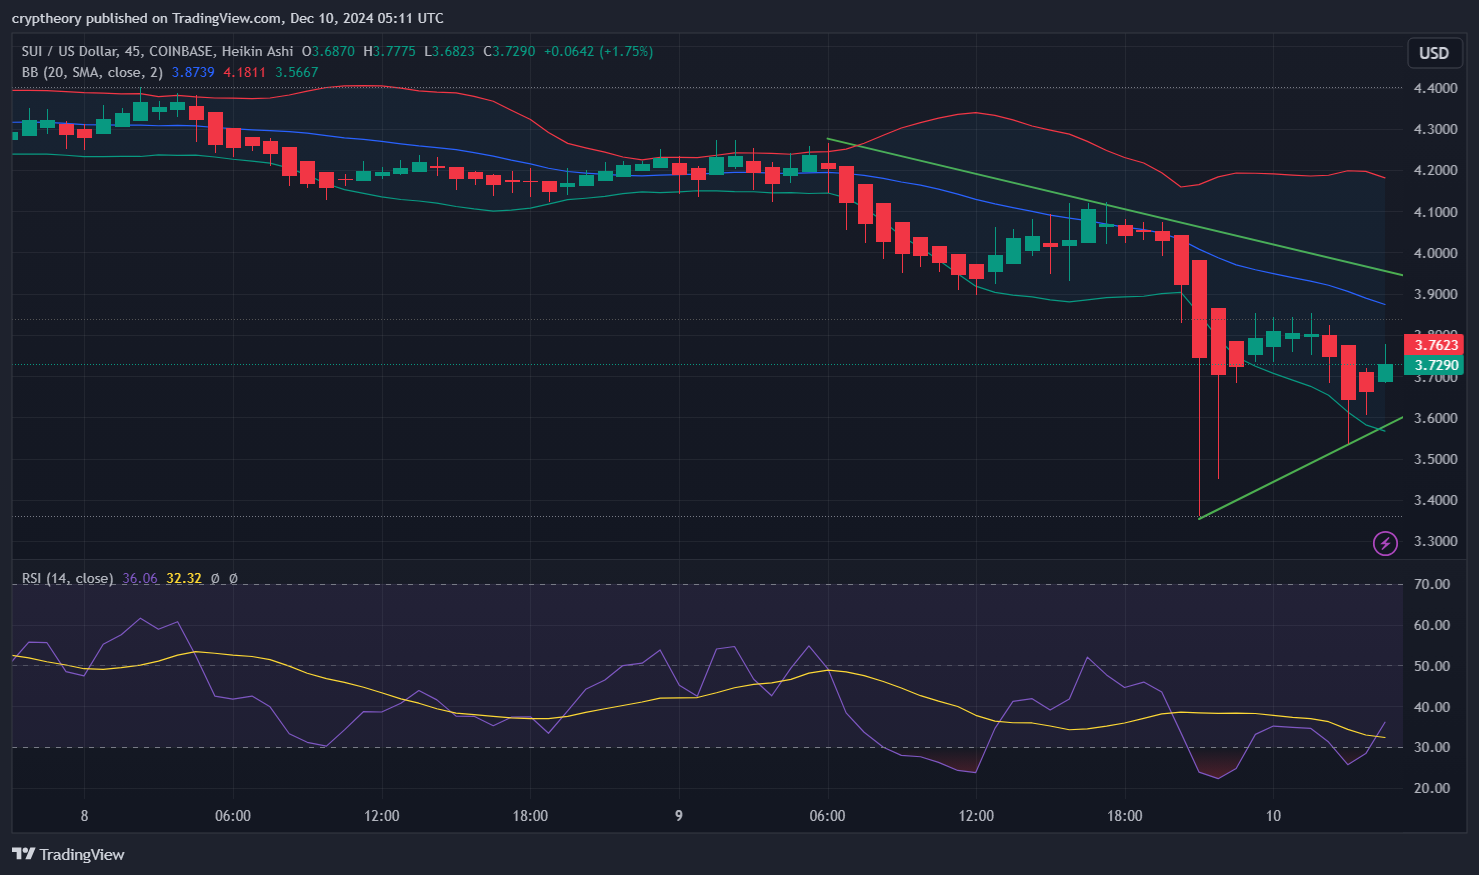
- RSI Value: The RSI (14) is at 36.06, which places it in the lower range, signaling weak momentum and approaching oversold territory.
- RSI-Based Moving Average (MA): The RSI-based MA is at 32.32, indicating that RSI is slightly above its MA, suggesting a potential pause or reversal of the bearish momentum.
Bollinger Bands
- Upper Band: Approximately $4.1811.
- Middle Band (SMA 20): Approximately $3.8739.
- Lower Band: Approximately $3.5667.
- Observation: The price is currently positioned closer to the lower Bollinger Band, which indicates bearish pressure. However, a bounce from this level could signal a short-term recovery if buyers step in.
Summary
- RSI indicates that the price is nearing oversold conditions, but it hasn’t fully triggered a reversal signal yet.
- Bollinger Bands show that Sui is testing the lower range, with volatility still present but less aggressive than during its earlier drop.
This setup suggests a consolidation phase with a potential bounce if the lower Bollinger Band and RSI support align. However, if bearish momentum persists, further downside could occur.
What’s Next? Scenarios for Sui
Bullish Scenario:
If Sui can break above the downward-sloping trendline and reclaim $3.90, it could attempt another charge toward the $4.10 – $4.50 resistance zone. A clean breakout above $4.50 could send Sui flying toward $5.00 and beyond.
Bearish Scenario:
If Sui loses the $3.50 support, it’s likely heading to test $3.20 or even lower. A failure to hold above these levels would mean a complete reversal of the previous bullish momentum.
Sui Price Analysis Conclusion
Sui’s chart is a masterpiece of volatility, and traders should brace themselves for more twists and turns. The battle between bulls and bears is heating up near the $3.70 range, and the next decisive move could set the tone for the coming days.
Will Sui reclaim its crown as the darling of the crypto space, or will it continue its slide into oblivion? Stay tuned, and remember: in the world of Sui, the only thing predictable is the unpredictability. Hold tight and enjoy the ride! 🎢📈📉
- Chainlink Price Analysis – January 9, 2025: The Struggle for $20 and Beyond! - January 9, 2025
- 📊 Kekius Maximus Price Analysis – January 7, 2025 🎭 - January 7, 2025
- 🚀 TON Price Prediction – January 6, 2025 📊🤖 - January 6, 2025


