Table of Contents
Ah, Cookie DAO – the sweet name that brings visions of freshly baked gains but occasionally crumbles under market volatility like a poorly dunked biscuit in tea. Today, we’re diving into this delicious price chart with the enthusiasm of a child in a cookie jar and the precision of a blockchain auditor. Grab your glass of milk; it’s time to snack on some analysis!

🧠 Technical Analysis – The Cookie Crumbles… or Does It?
1. The Great Cookie Triangle 🍕
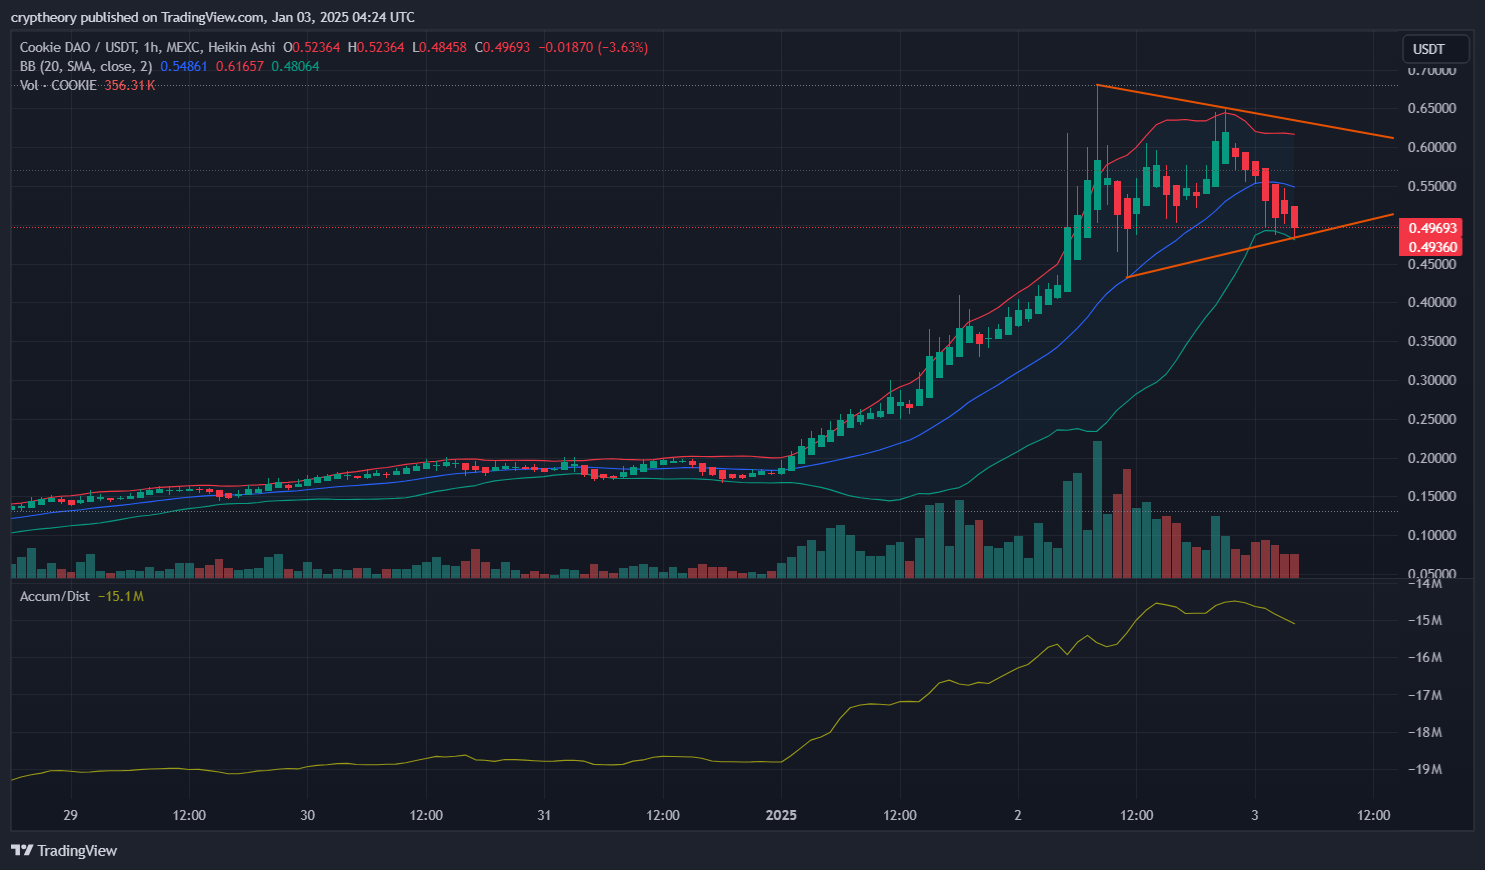
Our chart resembles a perfectly baked symmetrical triangle, with price consolidation forming a neat wedge. This pattern suggests one thing: an impending breakout. Will it rise like a perfectly proofed sourdough loaf or fall like a burnt batch of oatmeal cookies? The triangle hints that the price is reaching a decision point, and soon enough, we’ll either see bullish sprinkles or bearish crumbs.
- Upper Resistance Line: Hovering around $0.65 – like the cookie jar lid that’s slightly ajar.
- Lower Support Line: Around $0.45 – the kitchen counter keeping our cookie dreams alive.
2. Bollinger Bands – Stretchy Dough, Stretchy Price 🎈
The Bollinger Bands are squeezing tighter than grandma’s secret cookie recipe. A breakout seems imminent, but will it be upwards towards the cookie castle in the sky, or will we face the bitter taste of market rejection?
- Upper Band: $0.65 – Resistance is real.
- Lower Band: $0.48 – Support is holding the dough together.
- Middle SMA: $0.54 – Acting as a rolling pin, smoothing out volatility.
3. RSI – Sugar Rush or Energy Crash? 📊
The Relative Strength Index (RSI) sits at 51.48, a neutral stance like a cookie jar halfway full. Not too hot, not too cold. This means the market is indecisive – should it grab another cookie or call it quits? However, the recent drop from overbought territory suggests that some investors might have already had their sugar fix and are now resting on the sidelines.
4. Accumulation/Distribution (Accum/Dist) – Are We Hoarding Cookies? 🍪📦
With an Accum/Dist value of -15.1M, it seems some big players have sneakily grabbed cookies from the jar and left the scene. Smart money might be on a diet, waiting for the perfect dip to load up again.

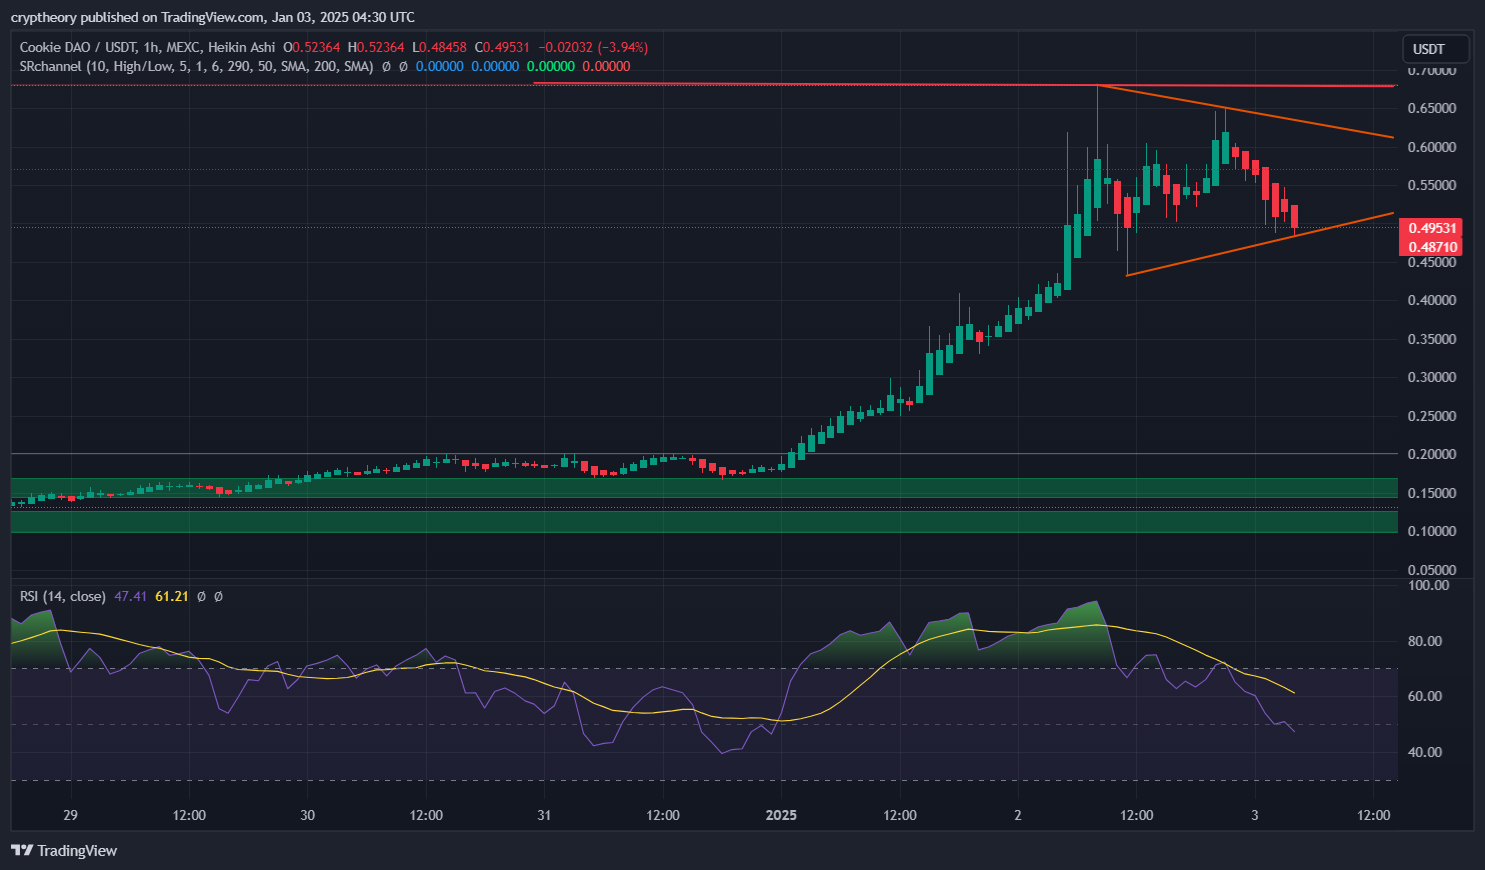
📊 RSI (14, close)
- Value: 47.41
- Interpretation: The RSI is below the neutral zone (50), indicating slight bearish momentum. If RSI drops below 40, it could signal stronger selling pressure. A rebound above 50 would indicate renewed buying strength.
📈 RSI-based Moving Average (MA)
- Value: 61.21
- Interpretation: The RSI-based MA remains above the current RSI, confirming ongoing bearish pressure. For a bullish shift, RSI would need to cross above its MA.
🛡️ Support Levels:
- $0.45 – Strong Support Zone: The lower boundary of the triangle pattern offers strong support. A break below this could trigger a further drop.
- $0.40: A secondary support level based on previous price action and volume profile.
🚧 Resistance Levels:
- $0.55: Immediate resistance within the triangle pattern. Breaking above this could indicate a potential bullish breakout.
- $0.65 – Major Resistance Zone: A key level where selling pressure has historically increased.
📌 Current Market Dynamics:
- The price is consolidating within a symmetrical triangle pattern.
- Volume has shown a slight decrease, indicating indecision in the market.
- RSI is hovering in neutral-bearish territory.
- The next move will depend on whether the price breaks above resistance ($0.55) or below support ($0.45).
Trading Tip:
- A breakout above $0.55 could signal a bullish move towards $0.65.
- A breakdown below $0.45 could send the price towards $0.40 or lower.
- Watch RSI for a potential crossover above 50 and RSI-based MA for early reversal signals.
Conclusion:
The market is currently indecisive, and traders should await confirmation from either a breakout or breakdown before making substantial moves. 🚀📉
🚀 Short-Term Prediction – The Bake-Off Showdown! 🥊
If Cookie DAO can break above $0.55, we might see a short-term sugar high that propels the price toward $0.65 and potentially beyond. On the flip side, failure to hold support at $0.48 could cause a correction back down to $0.40 or lower.
🟢 Bullish Scenario: A breakout above $0.55 could send Cookie DAO moonwalking into the cookie jar of success, eyeing $0.70+ in the near term.
🔴 Bearish Scenario: If support crumbles like a stale cookie, expect price action to revisit levels around $0.40-$0.35.
📊 Market Sentiment – Do Investors Have a Sweet Tooth? 🍭
The volume bars show rising interest during upward moves and fading excitement during dips. This means that market participants still have faith in Cookie DAO’s recipe for success. The current price pattern suggests a classic wait-and-see approach, as bulls and bears face off in the ultimate bake-off.
🥇 Cookie DAO Price Analysis Final Thoughts – To HODL or To Dunk? 🤔
Cookie DAO is currently sitting in a high-stakes baking competition. The triangle formation, tight Bollinger Bands, and moderate RSI all point towards an explosive move – but the direction is still uncertain.
- If you’re feeling bullish, grab a spatula and get ready to flip some gains! 🚀
- If you’re bearish, maybe it’s time to tighten your apron strings and wait patiently for a better entry point. 📉
But hey, no matter the outcome, one thing’s for sure: the Cookie DAO chart is heating up, and soon we’ll see whether it’s a golden-brown victory or a slightly burnt disappointment.
Disclaimer: This analysis was conducted with a humorous spirit and a questionable craving for cookies. Please trade responsibly and consult a financial advisor before investing – especially if you’re out of milk. 🥛🍪
Next Price Levels to Watch:
- Upside Target: $0.65
- Downside Support: $0.45
Now, go forth, brave cookie warrior, and may your trades be ever in your favor! 🍪📈
- 🚀 TON Price Prediction – January 6, 2025 📊🤖 - January 6, 2025
- 🍪 Cookie DAO Price Prediction – January 3, 2025 🍪 - January 3, 2025
- Virtual Protocol Price Analysis – January 2, 2025 - January 2, 2025


![Best Platforms for Copy Trading in [current_date format=Y] 22 Best Platforms for Copy Trading](https://cryptheory.org/wp-content/uploads/2024/12/copy-trading-120x86.jpg)


