XRP surprised the market two days ago with a price surge of over 10%, reaching a peak of $2.60. This sudden movement has sparked the question: Can this upward momentum continue? In this article, we’ll analyze the key price levels and what the near future might hold for XRP.
XRP Eyeing the $3 Mark
The daily XRP chart reveals a price range between $2 and $3. Breaking out of this range will be crucial in determining the coin’s future momentum. A bullish breakout above the $3 level could trigger a strong rally, while a drop below $2 might indicate a bearish trend.
Interestingly, as seen in the chart below, XRP broke out of a triangle pattern yesterday. This formation had kept XRP in check since December, when it peaked at $2.90. If XRP can flip the upper boundary of this pattern into a support level, it could pave the way for a push toward the psychological $3 level—or potentially even higher.
Can XRP Reach $10?
In the long term, even bigger developments could be on the horizon. According to analyst Yoddha, XRP’s current momentum mirrors the market movements of 2017. After years of consolidation, XRP appears poised for a significant upward trend.
Yoddha compares this situation to a spring that has been under tension for a long time and is now finally releasing its energy. If this analogy holds true, XRP could be gearing up for a breakout that takes it toward the highly anticipated $10 mark.
While speculative, XRP could potentially rise to levels beyond $10 in the long term. However, the first critical milestone remains breaking through the $3 barrier.
The next few days will be crucial in determining whether XRP can establish this key level as support. If successful, it could set the stage for further gains and pave the way for even more ambitious price targets.
XRP Price Analysis
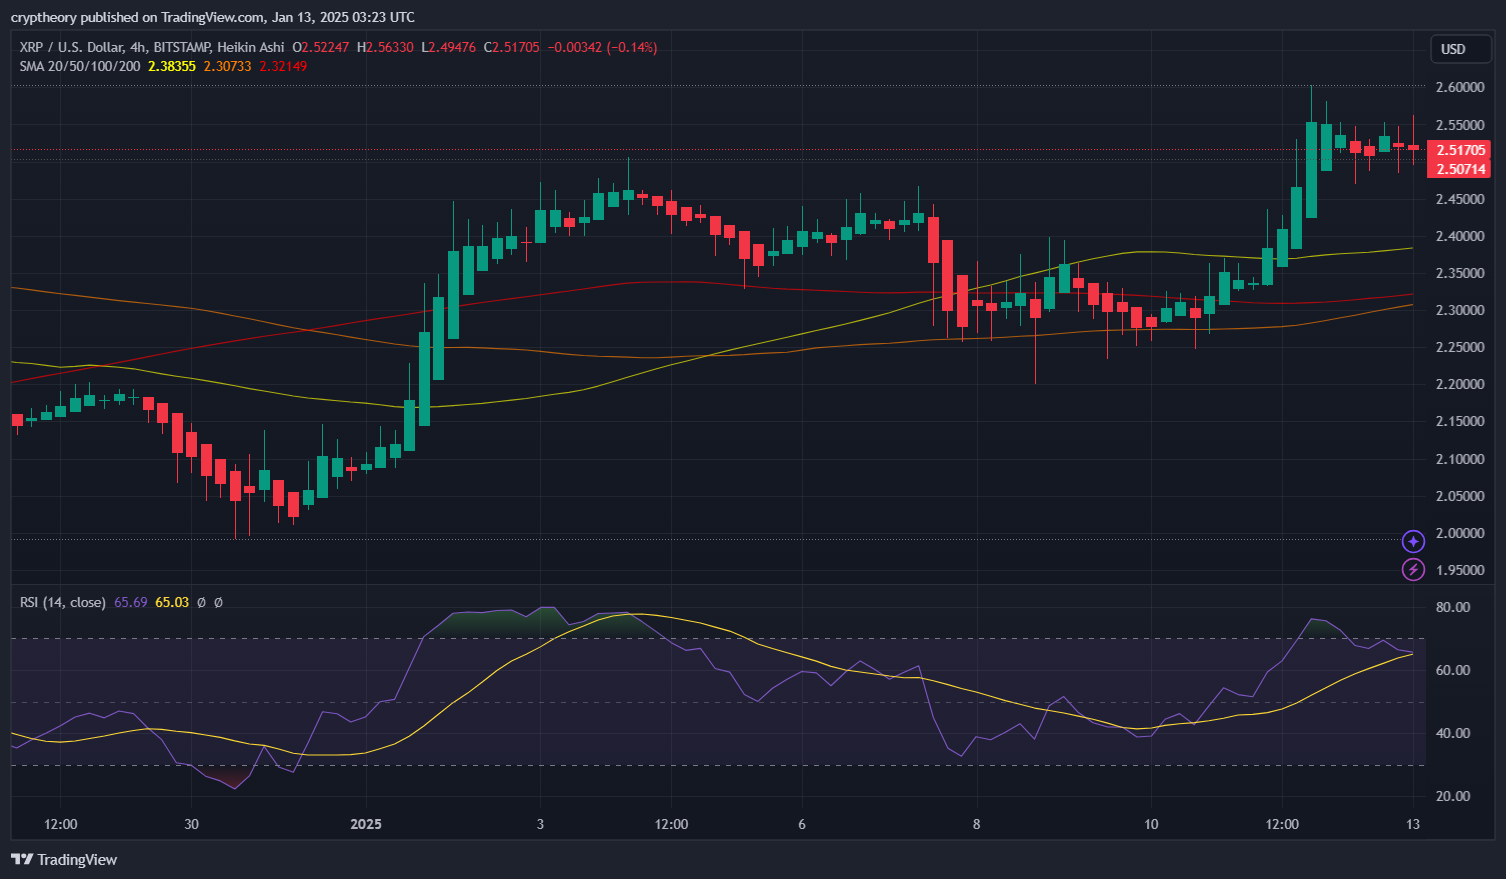
The 4-hour XRP/USD chart shows a bullish trend emerging after a prolonged consolidation phase, supported by key moving averages and increasing momentum. Below is a concise analysis based on the visible chart data.
Key Observations:
- Price Movement:
- XRP is trading at $2.517 and has shown steady upward movement over the past sessions.
- The price is currently above the 20, 50, 100, and 200 SMAs, indicating a strong bullish trend.
- Moving Averages:
- The 20 SMA at $2.38 is acting as immediate dynamic support.
- A golden cross occurred earlier (when the 50 SMA crossed above the 200 SMA), further confirming bullish momentum.
- Relative Strength Index (RSI):
- The RSI (14) is at 65, indicating bullish momentum but nearing overbought conditions.
- A potential pullback might occur if the RSI moves closer to 70.
- Support and Resistance Levels:
- Immediate Support: $2.45 (20 SMA).
- Key Resistance: $2.55 (recent high and psychological barrier).
- Volume and Momentum:
- The steady upward trend indicates growing buyer interest, but volume spikes are needed to confirm a breakout above $2.55.
Short-Term Outlook:
- Bullish Case: A break above $2.55 could lead to further upside toward $2.60 and beyond.
- Bearish Case: If XRP fails to break resistance, a pullback to $2.45 or the 50 SMA at $2.32 is possible.
Recommendation:
Traders should watch for a breakout above $2.55 or consolidation around the 20 SMA for confirmation of the next move.
- XRP Breaks Months-Long Consolidation: What Does This Mean for the Price? - January 13, 2025
- Elon Musk warns: His plans for the dollar could delay Bitcoin’s price rise - January 10, 2025
- Is the Bitcoin bull market over? Not according to this analyst - January 10, 2025


