Table of Contents
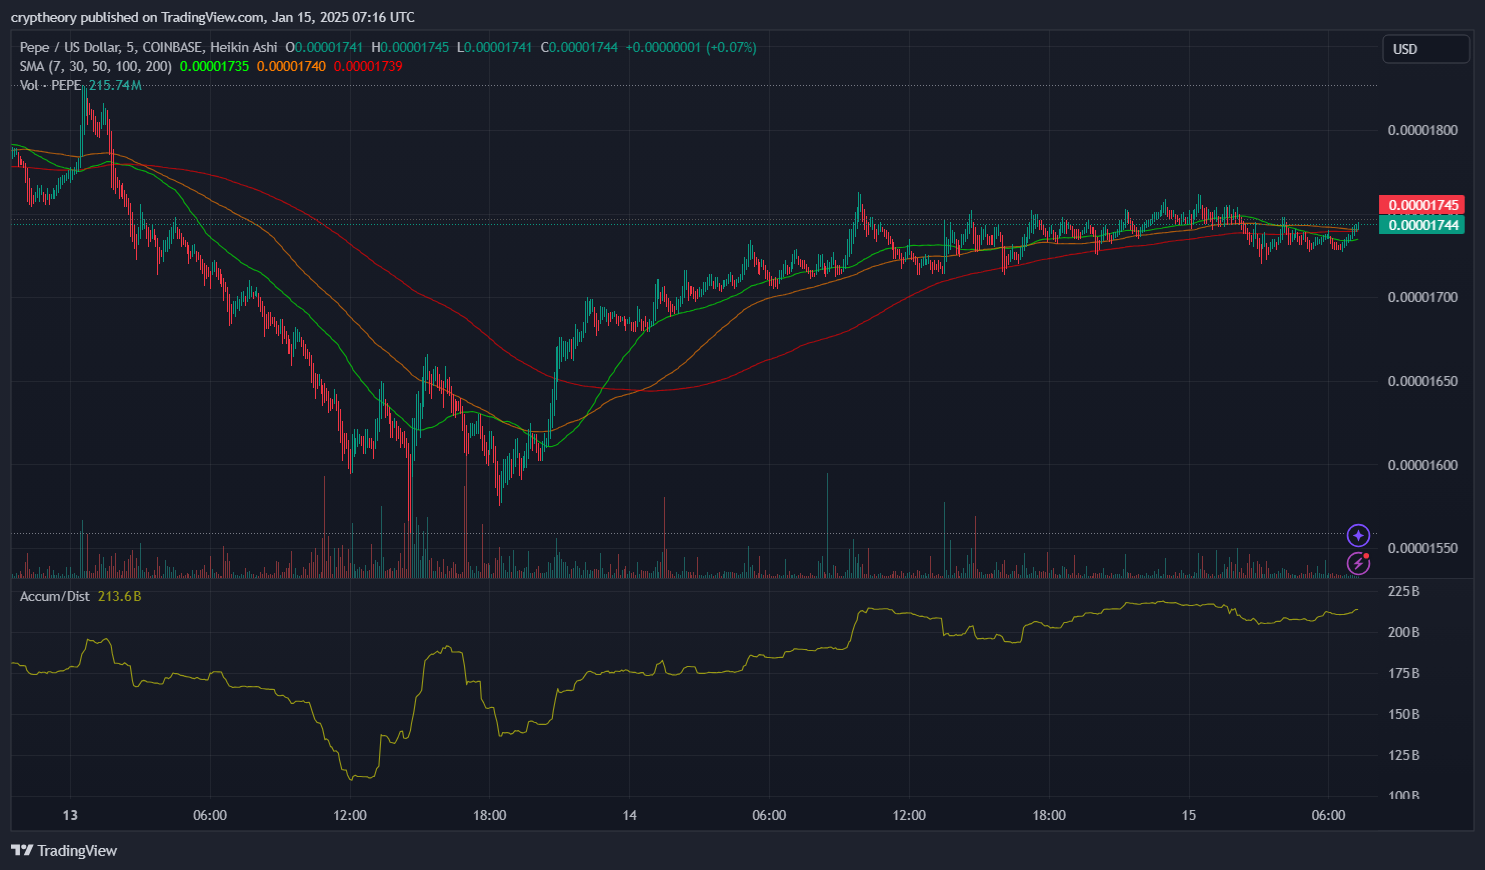
The 5-minute chart for PEPE/USD reveals a recovery from recent lows and consolidation in a tight range. The price is currently trading at $0.00001745, reflecting a modest upward trend supported by moving averages. However, market momentum remains neutral to mildly bullish, as indicated by the Accumulation/Distribution (A/D) indicator and volume dynamics.

Key Observations:
Price Movement and Trend:
- PEPE experienced a drop to a low of approximately $0.00001600 before bouncing back and stabilizing above $0.00001700.
- The price is now in a gradual uptrend, as indicated by higher lows and the price remaining above the 7 SMA ($0.00001735), 30 SMA ($0.00001740), and 50 SMA ($0.00001744).
Volume Analysis:
- Volume surged during the recovery phase from the lows, suggesting strong buying interest at lower levels.
- Current volumes are lower, indicating that momentum is slowing, which aligns with the consolidation phase near the $0.00001745 resistance.
Accumulation/Distribution (A/D) Indicator:
- A/D Value: 213.6B
- The steady increase in the A/D line after the recent recovery suggests gradual accumulation, signaling that buyers are stepping in and supporting the price.
Technical Indicators:
Moving Averages:
- The short-term moving averages (7, 30, and 50 SMAs) are all converging near the price, indicating consolidation with a slight bullish bias.
- The 200 SMA at $0.00001550 is significantly lower, confirming long-term bullish sentiment and serving as strong support.
Momentum:
- The upward trajectory of the A/D line supports a bullish outlook in the short term.
- The lack of volume suggests that a significant breakout is unlikely without renewed buying interest.
PEPE/USD 1D Chart Analysis
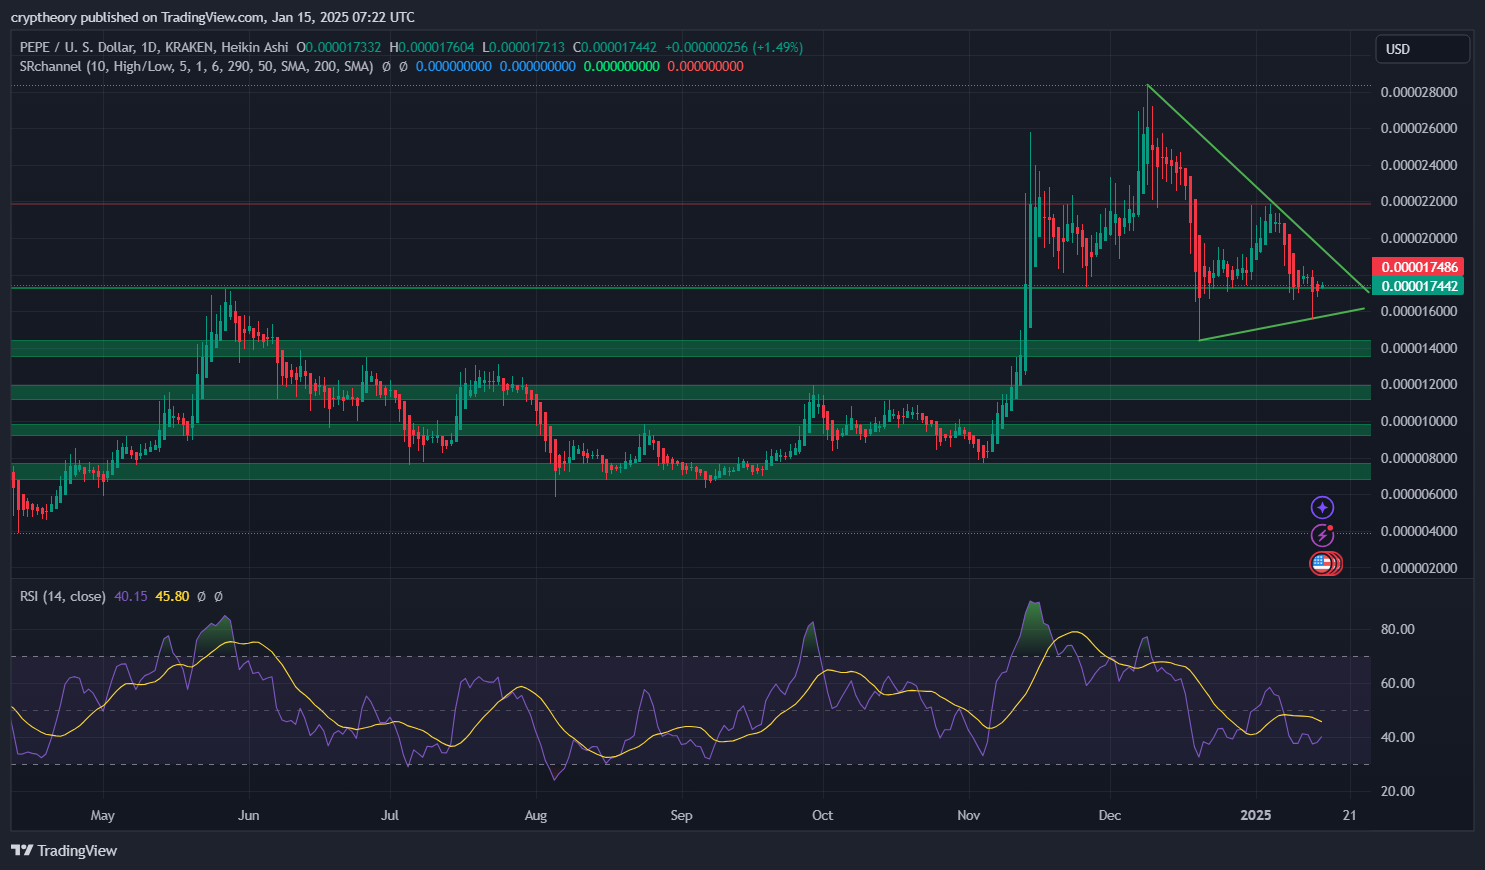
The 1-day chart of PEPE/USD highlights a consolidation phase following a strong uptrend that peaked in late November. The price is forming a symmetrical triangle pattern, which indicates market indecision and potential for a breakout. Below is an analysis of RSI, RSI-based moving averages, and key chart patterns.

RSI Analysis:
- RSI (14): 45.80
- The RSI is currently neutral, leaning slightly toward bearish momentum as it stays below 50. This suggests that bullish momentum is weakening but hasn’t completely reversed.
- Previous peaks in RSI during rallies reached overbought territory (~80), showing that the current conditions are far from overheated.
- RSI-Based Moving Average: 40.15
- The RSI-based MA is positioned below the current RSI, indicating a slight improvement in momentum in the short term. However, the difference is minimal, signaling weak conviction.
Chart Pattern:
- The price is consolidating within a symmetrical triangle, characterized by lower highs and higher lows.
- Upper Trendline: Acting as resistance, currently around $0.00001850.
- Lower Trendline: Providing support, currently near $0.00001650.
- Symmetrical triangles typically precede a breakout. The direction will depend on whether the price breaks above the upper resistance or below the lower support.
Key Support and Resistance Levels:
- Support Levels:
- $0.00001650: Strong support along the triangle’s lower boundary.
- $0.00001450: A previous accumulation zone.
- Resistance Levels:
- $0.00001850: The triangle’s upper boundary and first breakout target.
- $0.00002000: A psychological and historical resistance.
Technical Indicators:
- Momentum: Neutral, as indicated by the RSI near 45.
- Volume: Decreasing, which is typical during a triangle pattern, further confirming consolidation.
Summary:
PEPE is consolidating in a symmetrical triangle, with the RSI showing neutral momentum near 45.80. Traders should watch for a breakout above $0.00001850 or a breakdown below $0.00001650 to confirm the next trend direction.
Prediction and Forecast:
Bullish Scenario:
- If PEPE breaks above the $0.00001750 resistance level with strong volume, it could test the next resistance at $0.00001800.
- A sustained breakout above $0.00001800 could lead to a rally toward $0.00001900, driven by bullish momentum and further accumulation.
Bearish Scenario:
- If the price fails to hold above the $0.00001700 support level, it may retest $0.00001650, the next key support level.
- A breakdown below $0.00001600 would signal renewed bearish pressure, with potential to revisit the 200 SMA at $0.00001550.
Trading Strategy Suggestions:
For Long Positions:
- Entry: Above $0.00001750 after confirmation of a breakout.
- Take Profit (TP): $0.00001800 (short-term) and $0.00001900 (extended target).
- Stop Loss (SL): Below $0.00001700 to limit downside risk.
For Short Positions:
- Entry: Below $0.00001700 after confirmation of bearish pressure.
- Take Profit (TP): $0.00001650 (short-term) and $0.00001550 (extended target).
- Stop Loss (SL): Above $0.00001750.
Summary and Prediction:
PEPE is currently consolidating near $0.00001745, with bullish momentum showing signs of exhaustion. A breakout above $0.00001750 is required for further upside, targeting $0.00001800 or $0.00001900. Conversely, a failure to hold above $0.00001700 could lead to a pullback toward $0.00001650 or lower.
Forecast Chart Summary:
| Scenario | Price Levels | Probability | Notes |
|---|---|---|---|
| Bullish Breakout | $0.00001750 → $0.00001800 → $0.00001900 | Medium | Requires volume support. |
| Bearish Pullback | $0.00001700 → $0.00001650 → $0.00001550 | Medium | Likely on volume decline or selling pressure. |
Traders should monitor volume and price action near the key resistance and support zones for confirmation of the next major move.
- Is Dogecoin on the Verge of Explosive Growth? Experts Predict a 1,000% Surge - January 15, 2025
- PEPE Price Analysis and Prediction – January 14, 2025 - January 15, 2025
- Washington Post: Trump to sign new bitcoin legislation on first day in office - January 14, 2025


![Best Platforms for Copy Trading in [current_date format=Y] 20 Best Platforms for Copy Trading](https://cryptheory.org/wp-content/uploads/2024/12/copy-trading-120x86.jpg)


