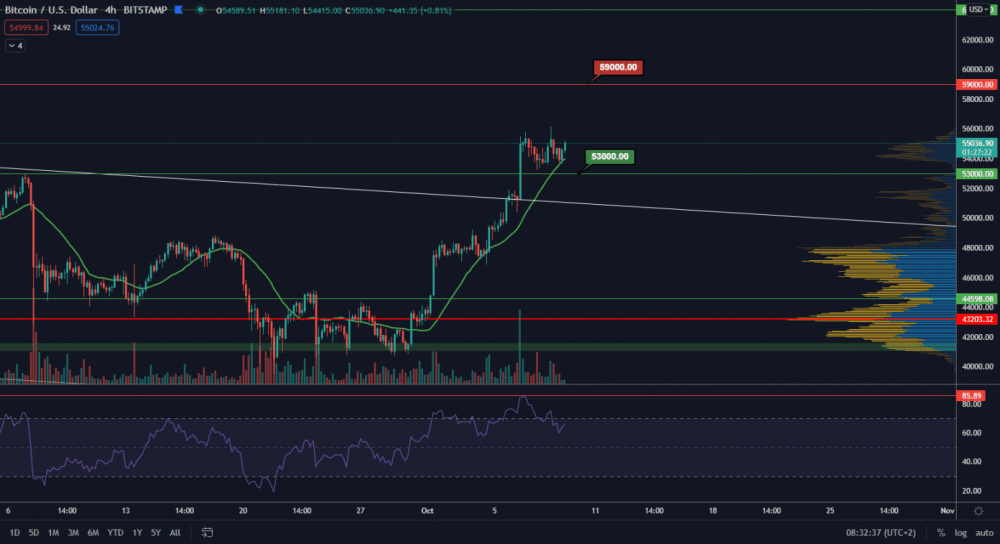
Unlike the correction leg, BTC only created a short-term sideway structure similar to October 2-4, when the price tested MA21. It seems that the price will respect the support of this indicator even now. Volumes are not waking up yet, but are likely to increase today. The price is despite the short-term negative divergence on RSI will continue the growing trend.
BTC has tested the MA21 indicator again and the price will continue to rise after the creation of the sideway structure. Such structures are not typical of trend reversal, but on the contrary, indicate that the price will continue the trend. So where is the next potential target? Many resistances of BTC did not remain before the new ATH was reached.
BTC is heading for a new ATH
Another target we will pursue is the $ 59,000 level. This is the second highest long-term maximum after ATH. ATH levels are a psychological threshold rather than resistance. Of course, there’s also a script in the game the price reaches the new ATH before the correction occurs, but it should be noted that the longer the price goes up without the correction, the stronger the correction will be.
Sentiment for the rest of the year thus continues to expect BTC to reach the new ATH and likely be 6-digit. BTC / USD also meets the conditions so far Stock-to-flow model, with the minimum for the close price for October is at $ 63,000. It is possible that the price will grow similarly to a year ago. However, this growth may be the last phase in the halving cycle.
- CryptoQuant Analyst: Bitcoin Nowhere Near Its Peak – Buckle Up, Hodlers! - December 21, 2024
- Chainalysis: $2.2 Billion Lost to Crypto Hacks in 2024 - December 21, 2024
- Bank of Japan leaves interest rate unchanged: Impact on the macroeconomy and the crypto market - December 20, 2024


