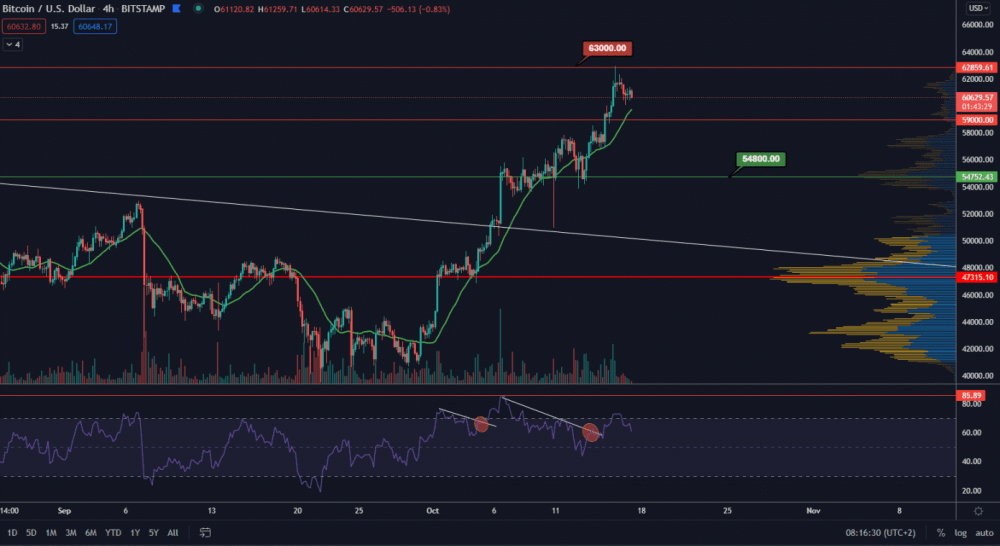
BTC continues the growing trend, but for the last day began to decline slightly. The price hit a resistance zone of around $ 63,000. However, the volumes with falling candles were minimal and there was no change in sentiment. Meanwhile, the dominance is still in a growing trend, but on the last day it rather stagnated at around 46.20%.
BTC created a local maximum of $ 62,944 and thus respected the last resistance band on the chart. The price can basically make the sideway structure before overcoming ATH or increase again after the correction leg. It is important that ATH will eventually overcome. The moment the price succeeds, many people, under pressure from the media, succumb to FOMO and the real hype is just beginning.
BTC on the way to ATH
Volumes they are still on the side of the bulls and the RSI is experiencing a negative divergence. However, we are not in a short-term trend in the short term, but rather growth can be defined as stable. On the daily chart, however, we have already reached an overbought and therefore it is possible that the price of ATH will not immediately exceed, but we will go sideway beforehand or to a slight correction.
The nearest support is at MA21 at $ 59,700, followed by another support at $ 54,800, resulting from the previous short-term sideway structure. In the short term, so the price must cool down a bit before we attack the new ATH. Subsequently, BTC enters the price discovery zone and the no-resistance zone.
- CryptoQuant Analyst: Bitcoin Nowhere Near Its Peak – Buckle Up, Hodlers! - December 21, 2024
- Chainalysis: $2.2 Billion Lost to Crypto Hacks in 2024 - December 21, 2024
- Bank of Japan leaves interest rate unchanged: Impact on the macroeconomy and the crypto market - December 20, 2024


![Top 10 Cryptocurrency Platforms for Grid Trading in [current_date format=Y] 20 Top 10 Cryptocurrency Platforms for Grid Trading](https://cryptheory.org/wp-content/uploads/2024/12/grid-trading-120x86.jpg)


