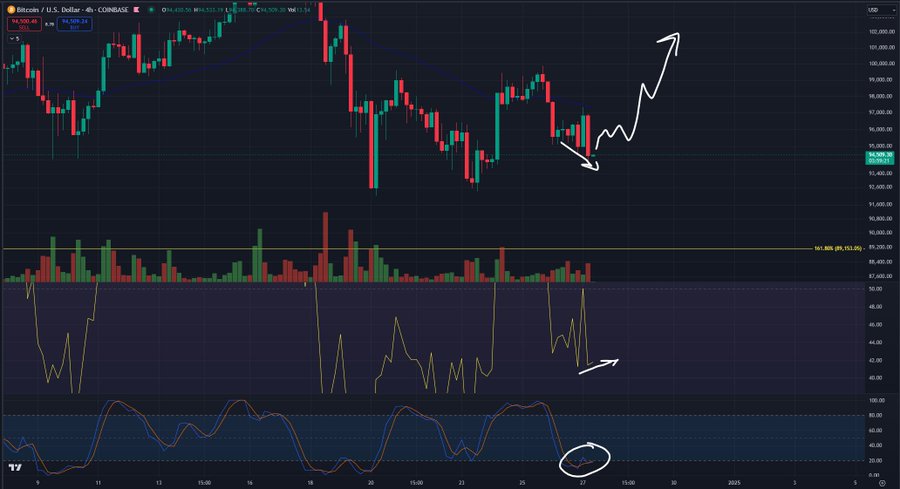
At the time of writing, Bitcoin has fallen below the $94,000 mark, marking a significant drop from its all-time high of $108,000. It seems the king of crypto might need a power nap—or at least a strong coffee. ☕
Bitcoin Battles Resistance: The EMA Tug-of-War ⚔️📊
Currently, Bitcoin is trading well below its 20-day Exponential Moving Average (EMA) and inching closer to the 50-day EMA. The price seems trapped in a consolidation cage between $92,000 and $99,000—like a lion pacing nervously in its enclosure. 🦁🔒
On the bright side, Bitcoin has managed to stay above its 200-day EMA, a critical support level since October 2024. Meanwhile, the Relative Strength Index (RSI) sits at 42, suggesting that Bitcoin isn’t sweating buckets from overbuying nor shivering in the cold from overselling.
So, while the bears might be sharpening their claws, the bulls haven’t packed up and gone home just yet. 🐂🔥
This suggests a potential “reset” in market sentiment—a much-needed pit stop before the next leg of the bull run. Historically, these cooldown phases act like a quick nap for Bitcoin, letting it recharge before it attempts another skyward sprint. 🛌💪
What’s impressive is that Bitcoin hasn’t tumbled dramatically during this reset phase. In fact, it’s holding its ground like a stubborn cat refusing to leave a warm laptop. 🐱💻
Analysts, drawing from past bull markets, actually expected much sharper corrections. But Bitcoin seems to be saying, “Not today, bears!” 🐻❌
All in all, the digital gold remains surprisingly stable, hinting that this might just be a strategic timeout before the next climb begins. 🥾⛰️
Are the Bears in Control? Or Are They Just Hosting a Temporary Takeover Party? 🐻📊🎉
The Taker-Buy-Sell Ratio for Bitcoin currently sits at 0.92. For those not fluent in crypto math: a value below 1 typically means the bears are calling the shots, while anything above 1 signals the bulls are flexing their horns. 🐂📈
Warning Signs from Analysts: The Red Flags Are Waving 🚩🔍
TradingView analyst The ForexX Mindset has sounded the alarm, warning of a potential larger correction. He points out that USDT (Tether) is gaining dominance over Bitcoin. Why does this matter? Because when investors start piling into stablecoins, it’s usually a sign they’re pulling back from riskier assets—like Bitcoin. Think of it as traders running for cover under the stablecoin umbrella in a stormy market. ☔💵
Meanwhile, renowned technical analyst Aksel Kibar isn’t exactly radiating optimism either. According to his analysis, Bitcoin is showing a Head-and-Shoulders pattern on the charts—a classic sign of an upcoming drop. If this pattern plays out, Bitcoin could take a tumble to around $80,000. 🪂📉
If the pattern acts as a H&S top, the price target is at 80K. This can be the pullback to the broadening pattern that completed with a breakout above 73.7K. $BTCUSD https://t.co/aWeNdWVkMz pic.twitter.com/QbGi08AfcH
— Aksel Kibar, CMT (@TechCharts) December 26, 2024
So, are the bears in control? For now, they’re certainly holding the microphone and dropping some bearish beats. But Bitcoin has surprised us before—and there’s always a chance the bulls are just waiting for their cue to stage a dramatic comeback. 🐂🎤🔥
- Analyst predicts “Grand Finale” for Altcoins in early 2025 - January 2, 2025
- Dutch crypto analyst: “This is the right time to buy XRP” - January 2, 2025
- Bitcoin Drops Below $94,000: Are the Bears Throwing a Blockchain BBQ? 🐻🔥📉 - December 30, 2024


